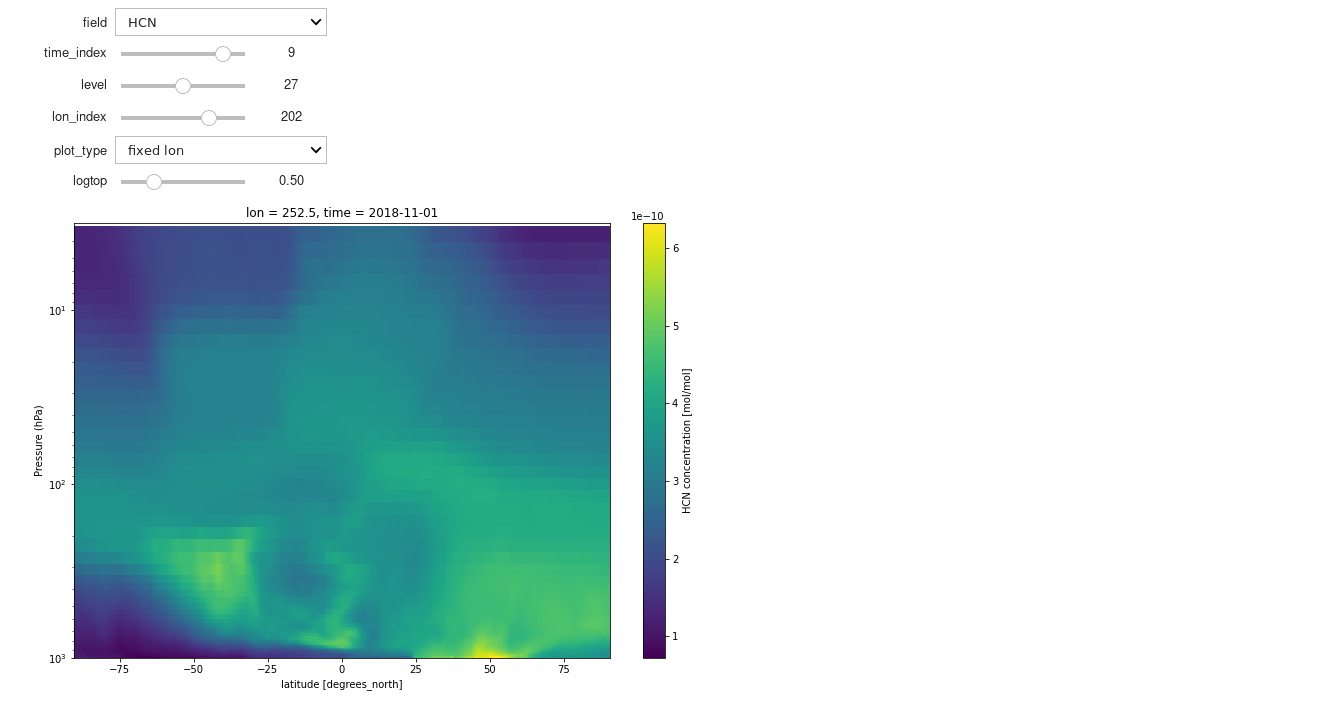
Code to create a widget for a quicklook
# Create a widget for a quicklook at model output Provides options to look at output along various altitude slices of lat/lon plots, zonal averages or longitude vs altitude slices.
# Dan Marsh, 2020-08-12
# Widget to help navigate through some varables in your output files.
Load python packages
import matplotlib.pyplot as plt
import numpy as np
import xarray as xr
from ipywidgets import interactive
Load file
archive_dir = '/glade/work/buchholz/CAM_chem_output/'
ds = xr.open_dataset(archive_dir+'CAM_chem_merra2_FCSD_1deg_QFED_monthly_2018.nc')
ntime = ds['time'].size
nlon = ds['lon'].size
nlev = ds['lev'].size
Create reusable functions
def plt_field(field, time_index, level, lon_index, plot_type, logtop):
    plt.figure(figsize=(12,8))

    var = ds[field]

    if (var.dims == ('time','lev', 'lat', 'lon')):

        var1 = var.isel(time=time_index)

        if (plot_type == 'lon-lat'):
            var1[level,:,:].plot.imshow()
        elif (plot_type == 'zonal mean'):
            a = var1.mean(dim='lon')
            a.where(ds.coords["lev"] > 10**logtop).plot.pcolormesh()
            ax = plt.gca()
            ax.set_ylim([1000,10**logtop])
            ax.set_yscale('log')
            ax.set_ylabel('Pressure (hPa)')
        elif (plot_type == 'fixed lon'):
            a = var1[:,:,lon_index]
            a.where(ds.coords["lev"] > 10**logtop).plot.pcolormesh()
            ax = plt.gca()
            ax.set_ylim([1000,10**logtop])
            ax.set_yscale('log')
            ax.set_ylabel('Pressure (hPa)')
    elif (var.dims == ('time', 'lat', 'lon')):
        var[time_index,:,:].plot.imshow()
    else:
        plt.scatter((0,360),(-90,90))
        plt.text(180, 0, 'select a 2-D or 3-D field', horizontalalignment='center')

    plt.show()

    return
Call the widget
w = interactive(plt_field, field=ds.data_vars.keys(),
          time_index = (0,ntime-1,1),
          level=(0,nlev-1,1),
          lon_index = (0,nlon-1,1),
          plot_type=['lon-lat', 'zonal mean', 'fixed lon'],
          logtop=(0,2,0.25))

output = w.children[-1]
output.layout.height = '500px'
display(w)
