import glob
import re
import matplotlib.pyplot as plt
import numpy as np
import scipy as sp
import xarray as xr
import intake
import intake_esm
import pandas as pd
import os
# Set up your sratch folder path
username = os.environ["USER"]
glade_scratch = "/glade/derecho/scratch/" + username
print(glade_scratch)
#
jra3q_catalog_url = 'https://data.gdex.ucar.edu/d640000/catalogs/d640000-osdf.json'
# jra3q_catalog_url = 'https://osdf-director.osg-htc.org/ncar/gdex/d640000/catalogs/d640000-https.json'/glade/derecho/scratch/harshah
# GMST function ###
# calculate global means
def get_lat_name(ds):
    for lat_name in ['lat', 'latitude']:
        if lat_name in ds.coords:
            return lat_name
    raise RuntimeError("Couldn't find a latitude coordinate")

def global_mean(ds):
    lat = ds[get_lat_name(ds)]
    weight = np.cos(np.deg2rad(lat))
    weight /= weight.mean()
    other_dims = set(ds.dims) - {'time'}
    return (ds * weight).mean(other_dims)
USE_PBS_SCHEDULER = True# Create a PBS cluster object
def get_pbs_cluster():
""" Create cluster through dask_jobqueue.
"""
from dask_jobqueue import PBSCluster
cluster = PBSCluster(
job_name = 'dask-osdf-24',
cores = 1,
memory = '4GiB',
processes = 1,
local_directory = glade_scratch + '/dask/spill',
log_directory = glade_scratch + '/dask/logs/',
resource_spec = 'select=1:ncpus=1:mem=4GB',
queue = 'casper',
walltime = '3:00:00',
#interface = 'ib0'
interface = 'ext'
)
return cluster
def get_gateway_cluster():
""" Create cluster through dask_gateway
"""
from dask_gateway import Gateway
gateway = Gateway()
cluster = gateway.new_cluster()
cluster.adapt(minimum=2, maximum=4)
return cluster
def get_local_cluster():
""" Create cluster using the Jupyter server's resources
"""
from distributed import LocalCluster, performance_report
cluster = LocalCluster()
cluster.scale(6)
return cluster# Obtain dask cluster in one of three ways
if USE_PBS_SCHEDULER:
cluster = get_pbs_cluster()
elif USE_DASK_GATEWAY:
cluster = get_gateway_cluster()
else:
cluster = get_local_cluster()
# Connect to cluster
from distributed import Client
client = Client(cluster)# Scale the cluster and display cluster dashboard URL
n_workers =5
cluster.scale(n_workers)
client.wait_for_workers(n_workers = n_workers)
clusterLoading...
# test = xr.open_dataset(
#     'osdf:///ncar/gdex/d640000/kerchunk/fcst_surf-remote-osdf.parq',
#     engine='kerchunk',
#     storage_options={"direct_reads": True}
# )
jra3q_cat = intake.open_esm_datastore(jra3q_catalog_url)
jra3q_catLoading...
jra3q_cat.df.head()Loading...
jra3q_unique_vars= jra3q_cat.df[['variable','long_name']].drop_duplicates()
jra3q_unique_vars
Loading...
jra3q_unique_vars[1:100]Loading...
Filter variables that start with temp
temp_cat = jra3q_cat.search(long_name='temp*')
temp_cat.df
Loading...
Let us pick the 2m max air temperature and compute GMST
Currently intake-esm does not support the kerchunk engine. So, let us download a PR that does
jra3q_temps = jra3q_cat.search(variable='tmp2m-hgt-an-gauss')
jra3q_datasets = jra3q_temps.to_dataset_dict(xarray_open_kwargs={'engine':'kerchunk',"chunks": {}})
--> The keys in the returned dictionary of datasets are constructed as follows:
	'variable.short_name'
Loading...
Loading...
jra3q_datasets.keys()dict_keys(['tmp2m-hgt-an-gauss.tmp2m-hgt-an-gauss'])ds = jra3q_datasets['tmp2m-hgt-an-gauss.tmp2m-hgt-an-gauss']
ds['tmp2m-hgt-an-gauss'].isel(time=0).plot(cmap='coolwarm')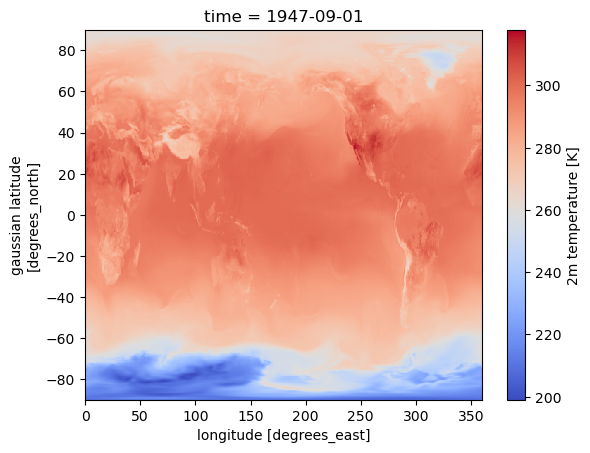
%%time
# a quick calculation of global mean surface temperature hourly time series
da_tmp2m = ds['tmp2m-hgt-an-gauss'].sel(time=slice('2025-01-01','2025-09-25')).mean(dim=['lat','lon']).compute()
CPU times: user 1min 28s, sys: 3.7 s, total: 1min 32s
Wall time: 6min 51s
# Create a customized time series plot
fig = plt.figure(figsize=(10, 4))
ax = fig.add_axes([0, 0, 1, 1])

# plot time series
da_tmp2m.plot(ax=ax, color='steelblue', linewidth=1.5)

# Customize the plot
ax.set_title('Global Mean 2m Temperature - JRA3Q', fontsize=14, fontweight='bold')
ax.set_xlabel('Time', fontsize=12)
ax.set_ylabel('2m Temperature (K)', fontsize=12)
ax.grid(True, alpha=0.3, linestyle='--')
ax.spines['top'].set_visible(False)
ax.spines['right'].set_visible(False)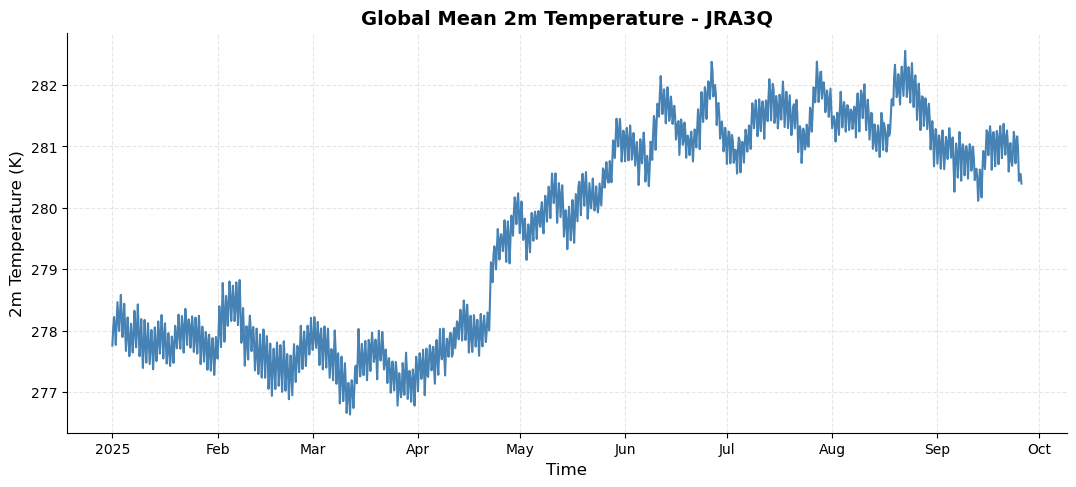
cluster.close()