import intake
import numpy as np
import pandas as pd
import xarray as xr
import re
import aiohttp
import time
from contextlib import contextmanager
import matplotlib.pyplot as plt
import seaborn as sns
import fsspec.implementations.http as fshttp
from pelicanfs.core import PelicanFileSystem, PelicanMap, OSDFFileSystem import dask
from dask_jobqueue import PBSCluster
from dask.distributed import Client
from dask.distributed import performance_reportinit_year0 = '1991'
init_year1 = '2020'
final_year0 = '2071'
final_year1 = '2100'# # This overwrites the default scheduler with a single-threaded scheduler
# dask.config.set(scheduler='synchronous') # File paths
rda_scratch = '/gpfs/csfs1/collections/rda/scratch/harshah'
#
rda_url = 'https://data.rda.ucar.edu/'
intake_url = rda_url + 'harshah/intake_catalogs/cesm2-lens-osdf/aws-cesm2-le.json'
aws_intake_url = 'https://raw.githubusercontent.com/NCAR/cesm2-le-aws/main/intake-catalogs/aws-cesm2-le.json'Create a Dask cluster
Select the Dask cluster type
The default will be LocalCluster as that can run on any system.
If running on a HPC computer with a PBS Scheduler, set to True. Otherwise, set to False.
USE_PBS_SCHEDULER = TrueIf running on Jupyter server with Dask Gateway configured, set to True. Otherwise, set to False.
USE_DASK_GATEWAY = FalsePython function for a PBS cluster
# Create a PBS cluster object
def get_pbs_cluster():
    """ Create cluster through dask_jobqueue.
    """
    from dask_jobqueue import PBSCluster
    cluster = PBSCluster(
        job_name = 'dask-osdf-24',
        cores = 1,
        memory = '4GiB',
        processes = 1,
        local_directory = rda_scratch + '/dask/spill',
        log_directory = rda_scratch + '/dask/logs/',
        resource_spec = 'select=1:ncpus=1:mem=4GB',
        queue = 'casper',
        walltime = '3:00:00',
        #interface = 'ib0'
        interface = 'ext'
    )
    return cluster
Python function for a Gateway Cluster
def get_gateway_cluster():
    """ Create cluster through dask_gateway
    """
    from dask_gateway import Gateway

    gateway = Gateway()
    cluster = gateway.new_cluster()
    cluster.adapt(minimum=2, maximum=4)
    return cluster
Python function for a Local Cluster
def get_local_cluster():
    """ Create cluster using the Jupyter server's resources
    """
    from distributed import LocalCluster, performance_report
    cluster = LocalCluster()

    cluster.scale(4)
    return cluster
This uses True/False boolean logic based on the variables set in the previous cells
Python logic to select the Dask Cluster type
# Obtain dask cluster in one of three ways

if USE_PBS_SCHEDULER:
    cluster = get_pbs_cluster()
elif USE_DASK_GATEWAY:
    cluster = get_gateway_cluster()
else:
    cluster = get_local_cluster()

# Connect to cluster
from distributed import Client
client = Client(cluster)
# Scale the cluster and display cluster dashboard URL
# cluster.scale(4)
clusterLoading...
Access the data from the AWS bucket using intake
osdf_catalog   = intake.open_esm_datastore(intake_url)
https_catalog  = intake.open_esm_datastore(aws_intake_url)
osdf_catalog
Loading...
osdf_catalog.df['path'].head().valuesarray(['osdf:///aws-opendata/us-west-2/ncar-cesm2-lens/atm/daily/cesm2LE-historical-cmip6-FLNS.zarr',
'osdf:///aws-opendata/us-west-2/ncar-cesm2-lens/atm/daily/cesm2LE-historical-cmip6-FLNSC.zarr',
'osdf:///aws-opendata/us-west-2/ncar-cesm2-lens/atm/daily/cesm2LE-historical-cmip6-FLUT.zarr',
'osdf:///aws-opendata/us-west-2/ncar-cesm2-lens/atm/daily/cesm2LE-historical-cmip6-FSNS.zarr',
'osdf:///aws-opendata/us-west-2/ncar-cesm2-lens/atm/daily/cesm2LE-historical-cmip6-FSNSC.zarr'],
dtype=object)https_catalog.df['path'].head().valuesarray(['s3://ncar-cesm2-lens/atm/daily/cesm2LE-historical-cmip6-FLNS.zarr',
's3://ncar-cesm2-lens/atm/daily/cesm2LE-historical-cmip6-FLNSC.zarr',
's3://ncar-cesm2-lens/atm/daily/cesm2LE-historical-cmip6-FLUT.zarr',
's3://ncar-cesm2-lens/atm/daily/cesm2LE-historical-cmip6-FSNS.zarr',
's3://ncar-cesm2-lens/atm/daily/cesm2LE-historical-cmip6-FSNSC.zarr'],
dtype=object)osdf_catalog_temp = osdf_catalog.search(variable ='TREFHTMX', frequency ='daily')
https_catalog_temp = https_catalog.search(variable ='TREFHTMX', frequency ='daily')
https_catalog_tempLoading...
%%time
#dsets = osdf_catalog_temp.to_dataset_dict(storage_options={'anon':True})
dsets_osdf  = osdf_catalog_temp.to_dataset_dict()
Loading...
dsets_https = https_catalog_temp.to_dataset_dict(storage_options={'anon':True})%%time
dsets_osdf.keys()ds_osdf = dsets_osdf['atm.historical.daily.smbb']
ds_https = dsets_https['atm.historical.daily.smbb']
#
ds_osdf = ds_osdf.TREFHTMX
ds_https = ds_https.TREFHTMX
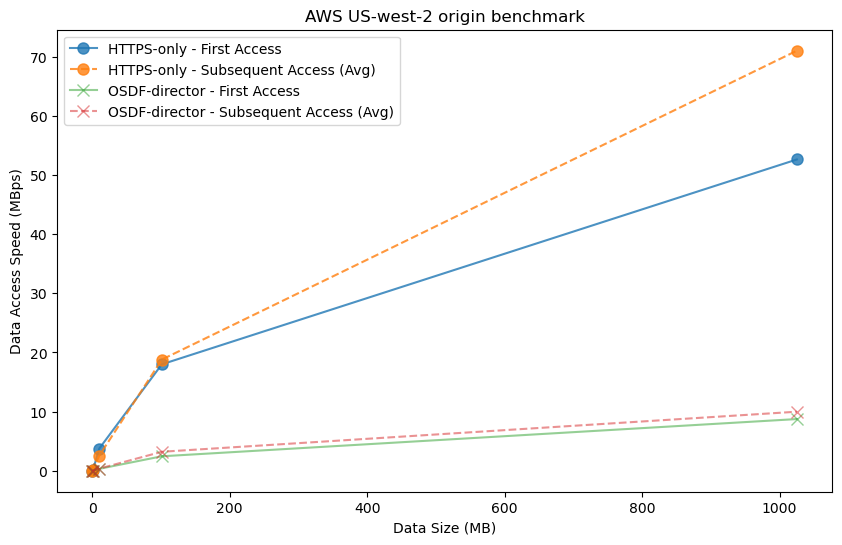
ds_osdfData Access Speed tests
- We will now test how long it takes to access data (via OSDF) for various sizes using one of the above arrays
Prepare data subsets
ds_osdf_1Kb  = ds_osdf.isel(lat=0,lon=0,member_id=0).isel(time=np.arange(260))
ds_https_1Kb = ds_https.isel(lat=0,lon=0,member_id=0).isel(time=np.arange(260))
# ds_osdf_1Kb
ds_osdf_1Mb = ds_osdf.isel(time=0).isel(member_id =1+ np.arange(5))
ds_https_1Mb = ds_https.isel(time=0).isel(member_id =1+ np.arange(5))
# ds_osdf_1Mbds_osdf_10Mb = ds_osdf.isel(member_id =6).isel(time=np.arange(48))
ds_https_10Mb = ds_https.isel(member_id =6).isel(time=np.arange(48))
# ds_osdf_10Mbds_osdf_100Mb = ds_osdf.isel(member_id =7).isel(time=np.arange(480))
ds_https_100Mb = ds_https.isel(member_id =7).isel(time=np.arange(480))
# ds_osdf_100Mbds_osdf_200Mb = ds_osdf.isel(member_id =7).isel(time=np.arange(480))
ds_https_200Mb = ds_https.isel(member_id =7).isel(time=np.arange(480))
ds_https_200Mb ds_osdf_1Gb = ds_osdf.isel(member_id = 8 + np.arange(6)).isel(time = np.arange(810))
ds_https_1Gb = ds_https.isel(member_id = 8 + np.arange(6)).isel(time = np.arange(810))
ds_osdf_1GbLoading...
ds_osdf_10Gb  = ds_osdf.isel(member_id  = 15)
ds_https_10Gb = ds_https.isel(member_id = 15)
ds_osdf_10Gb
Loading...
Now access data and plot
# Define file path for CSV
csv_file_path = "aws_uswest2_benchmark_withdask.csv"
ds_osdf_list = [ds_osdf_1Kb,ds_osdf_1Mb,ds_osdf_10Mb,ds_osdf_100Mb,ds_osdf_1Gb]
ds_https_list = [ds_https_1Kb,ds_https_1Mb,ds_https_10Mb,ds_https_100Mb,ds_https_1Gb]# Number of data access calls
num_calls = 8 # Modify this as needed
n_workers = 4 # Set this to your preferred number of workers# DiagnosticTimer class to keep track of runtimes
class DiagnosticTimer:
def __init__(self):
self.diagnostics = []
@contextmanager
def time(self, **kwargs):
tic = time.time()
yield
toc = time.time()
kwargs["runtime"] = toc - tic
self.diagnostics.append(kwargs)
def dataframe(self):
return pd.DataFrame(self.diagnostics)
# Initialize the DiagnosticTimer
diag_timer = DiagnosticTimer()# Function to check existing CSV file and determine missing runs
def load_existing_results():
if os.path.exists(csv_file_path):
# Load existing CSV into DataFrame
existing_df = pd.read_csv(csv_file_path)
else:
# Create an empty DataFrame if the file does not exist
existing_df = pd.DataFrame(columns=["dataset_size", "protocol", "call_number", "runtime", "MBps"])
return existing_df
def filter_missing_runs(datasets, protocol_name, existing_df):
# Convert dataset sizes to MB for checking, using a list of tuples
dataset_sizes_mb = [(dataset, dataset.nbytes / (1024 ** 2)) for dataset in datasets]
# Identify missing dataset sizes and calls
filtered_datasets = []
for dataset, dataset_size_mb in dataset_sizes_mb:
for call_num in range(1, num_calls + 1):
# Check if this dataset size and call number combination already exists
if not ((existing_df["dataset_size"] == dataset_size_mb) &
(existing_df["protocol"] == protocol_name) &
(existing_df["call_number"] == call_num)).any():
filtered_datasets.append((dataset, dataset_size_mb, call_num))
return filtered_datasetsdef benchmark_protocol(datasets, protocol_name, cluster=None):
existing_df = load_existing_results() # Load existing results as a checkpoint
# Filter for missing runs based on existing results
missing_runs = filter_missing_runs(datasets, protocol_name, existing_df)
diag_timer = DiagnosticTimer() # Initialize the diagnostic timer
# Process each dataset and call
for (dataset, dataset_size_mb, call_num) in missing_runs:
# Restart the Dask cluster if provided
if cluster is not None:
cluster.scale(0) # Scale down to release worker memory
cluster.scale(n_workers) # Scale up to required number of workers
client.wait_for_workers(n_workers) # Wait for workers to be ready
# Inform the start of processing for this dataset and call
print(f"Starting processing of dataset for protocol '{protocol_name}' (Size: {dataset_size_mb} MB) in call {call_num}")
# Only count the time for loading dataset into memory
dataset_copy = dataset.copy()
with diag_timer.time(dataset_size=dataset_size_mb, protocol=protocol_name, call_number=call_num):
dataset_copy.load() # Load the dataset into memory
# Convert the single call result to a DataFrame and add MBps column
call_result_df = diag_timer.dataframe().iloc[[-1]].copy() # Get the latest diagnostic entry
call_result_df["MBps"] = call_result_df["dataset_size"] / call_result_df["runtime"]
# Append this call's result to CSV
call_result_df.to_csv(csv_file_path, mode='a', header=not os.path.exists(csv_file_path), index=False)
print(f"Appended results for protocol '{protocol_name}', call {call_num} to '{csv_file_path}'")
# Print statement after finishing each call
print(f"Finished processing dataset for protocol '{protocol_name}' in call {call_num}")
# Run benchmark for each protocol
benchmark_protocol(ds_https_list, "HTTPS-only",cluster)
benchmark_protocol(ds_osdf_list, "OSDF-director",cluster)

# Convert diagnostics to a DataFrame for analysis
df_diagnostics = diag_timer.dataframe()

# Calculate MB/s for each run
df_diagnostics['MBps'] = df_diagnostics['dataset_size'] / df_diagnostics['runtime']
df_diagnostics
Loading...
# Plotting MBps vs data size for each protocol and call type
# Define different alpha values for each protocol
alpha_values = {"HTTPS-only": 0.8, "OSDF-director": 0.5}  # Adjust transparency as needed
marker_style = {"HTTPS-only": "o", "OSDF-director": "x"}  # Define different markers for each protocol
#
fig, ax = plt.subplots(figsize=(10, 6))
for protocol in ["HTTPS-only", "OSDF-director"]:
    # First access (call_number == 1)
    first_access = df_diagnostics[(df_diagnostics['protocol'] == protocol) & (df_diagnostics['call_number'] == 1)]
    ax.plot(first_access['dataset_size'], first_access['MBps'], label=f"{protocol} - First Access",
            alpha=alpha_values[protocol],marker=marker_style[protocol],markersize=8)

    # Subsequent access (call_number > 1)
    subsequent_access = df_diagnostics[(df_diagnostics['protocol'] == protocol) & (df_diagnostics['call_number'] > 1)]
    subsequent_access_avg = subsequent_access.groupby('dataset_size')['MBps'].mean()
    ax.plot(subsequent_access_avg.index, subsequent_access_avg.values,
            linestyle='--', label=f"{protocol} - Subsequent Access (Avg)",alpha=alpha_values[protocol],marker=marker_style[protocol],markersize=8)

# Customize plot appearance
ax.set_xlabel("Data Size (MB)")
ax.set_ylabel("Data Access Speed (MBps)")
ax.set_title("AWS US-west-2 origin benchmark")
ax.legend()
plt.show()
/glade/derecho/scratch/harshah/tmp/ipykernel_13477/2772681286.py:15: FutureWarning: The default of observed=False is deprecated and will be changed to True in a future version of pandas. Pass observed=False to retain current behavior or observed=True to adopt the future default and silence this warning.
subsequent_access_avg = subsequent_access.groupby('dataset_size')['MBps'].mean()
# Convert dataset size to categorical to control the order in the plot
df_diagnostics['dataset_size'] = df_diagnostics['dataset_size'].astype("category")

# Set the order for dataset sizes to appear in ascending order
size_order = sorted(df_diagnostics['dataset_size'].unique())

# Create the box plot
plt.figure(figsize=(12, 6))
sns.boxplot(
    data=df_diagnostics,
    x="dataset_size",
    y="MBps",
    hue="protocol",
    order=size_order
)

# Customize plot appearance
plt.xlabel("Data Size (MB)")
plt.ylabel("Data Access Speed (MBps)")
plt.title("(US-west-2 to UWMadison) Dask: 4x4GiB, 5 requests")
plt.legend(title="Protocol")
plt.show()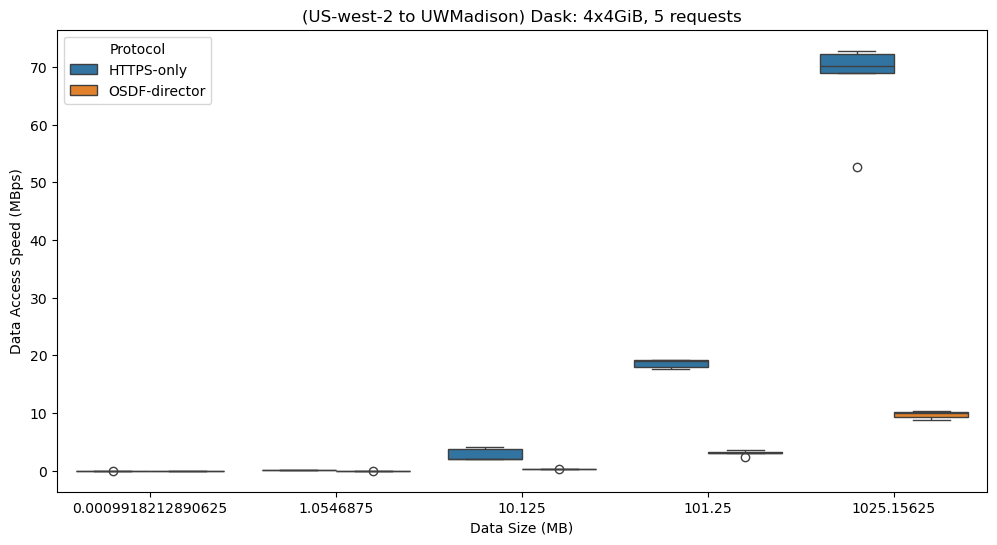
size_order = sorted(df_diagnostics['dataset_size'].unique())
size_order
[0.0009918212890625, 1.0546875, 10.125, 101.25, 1025.15625]############################################################################ #Try using a specific cache
# sdsc_cache='https://sdsc-cache.nationalresearchplatform.org:8443/aws-opendata/us-west-2/ncar-cesm2-lens/atm/monthly/'+\
# 'cesm2LE-historical-smbb-TREFHTMX.zarr'# %%time
# test_1 = xr.open_zarr(sdsc_cache).TREFHTMX.isel(time=0)
# test_1