Danica Lombardozzi (Oct 26 2020 at 16:48): Danica Lombardozzi (Oct 26 2020 at 16:48):
Does anyone have experience using GeoTIFF files for model evaluation? I received some satellite-derived GPP data in .tif format (/glade/work/dll/SIF_GPP/data.globalecology.unh.edu/data/GOSIF-GPP_v2/Monthly/Mean/) and would like to ultimately compare to CLM GPP.
There is some information online about working with GeoTIFF files (https://towardsdatascience.com/reading-and-visualizing-geotiff-images-with-python-8dcca7a74510), but I'm having trouble getting started. I don't know how to update or change environments on casper to be able to add the georaster or osgeo modules so that I can read in the data. From there, it's not clear to me how I will be able to manipulate the data for comparison against CLM. Any thoughts or advice for reading in and manipulating data in GeoTIFF format are very much appreciated!
Anderson Banihirwe (Oct 26 2020 at 17:01):@Danica Lombardozzi,
If you haven't done so already, give xarray + rasterio a try
In [9]: import xarray as xr

In [10]: da = xr.open_rasterio('/glade/work/dll/SIF_GPP/data.globalecology.unh.edu/data/GOSIF-GPP_v2/Monthly/Mean/GOSIF_GPP_2000.M0
    ...: 3_Mean.tif')

In [11]: da
Out[11]:
<xarray.DataArray (band: 1, y: 3600, x: 7200)>
[25920000 values with dtype=uint16]
Coordinates:
  * band     (band) int64 1
  * y        (y) float64 89.97 89.92 89.88 89.83 ... -89.83 -89.88 -89.93 -89.98
  * x        (x) float64 -180.0 -179.9 -179.9 -179.8 ... 179.8 179.9 179.9 180.0
Attributes:
    transform:         (0.05, 0.0, -180.0, 0.0, -0.05, 90.0)
    crs:               +init=epsg:4326
    res:               (0.05, 0.05)
    is_tiled:          1
    nodatavals:        (nan,)
    scales:            (1.0,)
    offsets:           (0.0,)
    AREA_OR_POINT:     Area
    TIFFTAG_SOFTWARE:  MATLAB 8.6, Mapping Toolbox 4.2
For this to work, you need to have rasterio which is available via conda
conda install -c conda-forge rasterio
Anderson Banihirwe (Oct 26 2020 at 17:11):I don't know how to update or change environments on casper to be able to add the georaster or osgeo modules so that I can read in the data
Do you own the environment you are using or is this one of the public/"official" environments?
Deepak Cherian (Oct 26 2020 at 17:16):rioxarray may also be helpful (https://corteva.github.io/rioxarray/stable/index.html)
Danica Lombardozzi (Oct 26 2020 at 17:29):Thank you Anderson and Deepak! I was able to read in the file. Now I just have to figure out how to use it.
@Anderson Banihirwe: I don't know whether I own the environment or not. Is there an easy way to check? I'm using conda env: miniconda-analysis. I participated in several different tutorials that set up environments before I really knew what this meant. I'd ultimately like to clean up the environment space and gain a better understanding of how to set up and manage my own environments.
Anderson Banihirwe (Oct 26 2020 at 17:38):I don't know whether I own the environment or not. Is there an easy way to check?
Inside a notebook, try the following
In [21]: import sys

In [22]: sys.executable
Out[22]: '/glade/work/abanihi/softwares/miniconda3/envs/playground/bin/python'
This will tell you where the Python executable is coming from
Deepak Cherian (Oct 26 2020 at 17:39):^ nice! should go in the xdev FAQ.
Anderson Banihirwe (Oct 26 2020 at 18:00):. I'd ultimately like to clean up the environment space and gain a better understanding of how to set up and manage my own environments.
:+1: When you get a chance, there's a great resource residing here: https://carpentries-incubator.github.io/introduction-to-conda-for-data-scientists/
If you are more of a visual learner, there's a video tutorial too: https://youtu.be/qn5zfdJtcYc
Most of the things covered in these tutorials are cross-platform i.e. they work the same regardless of the machine you are using... There is a few exceptions/caveats when working with conda on Cheyenne/Casper. @xdev folks will be happy to answer any question you may have....
Danica Lombardozzi (Oct 26 2020 at 22:21):Thanks for sharing these resources! I will take a look and try to improve my environment. It looks like the environment I'm using is my personal environment, so hopefully I should be able to set that up properly.
Danica Lombardozzi (Oct 26 2020 at 23:59):Danica Lombardozzi,
If you haven't done so already, give xarray + rasterio a try
In [9]: import xarray as xr

In [10]: da = xr.open_rasterio('/glade/work/dll/SIF_GPP/data.globalecology.unh.edu/data/GOSIF-GPP_v2/Monthly/Mean/GOSIF_GPP_2000.M0
    ...: 3_Mean.tif')

In [11]: da
Out[11]:
<xarray.DataArray (band: 1, y: 3600, x: 7200)>
[25920000 values with dtype=uint16]
Coordinates:
  * band     (band) int64 1
  * y        (y) float64 89.97 89.92 89.88 89.83 ... -89.83 -89.88 -89.93 -89.98
  * x        (x) float64 -180.0 -179.9 -179.9 -179.8 ... 179.8 179.9 179.9 180.0
Attributes:
    transform:         (0.05, 0.0, -180.0, 0.0, -0.05, 90.0)
    crs:               +init=epsg:4326
    res:               (0.05, 0.05)
    is_tiled:          1
    nodatavals:        (nan,)
    scales:            (1.0,)
    offsets:           (0.0,)
    AREA_OR_POINT:     Area
    TIFFTAG_SOFTWARE:  MATLAB 8.6, Mapping Toolbox 4.2
For this to work, you need to have
rasteriowhich is available via condaconda install -c conda-forge rasterio
Anderson: In working with the data (the same as above), it looks to me as if there aren't any data in the file. Am I missing something? I also tried to make a plot, but the plot is blank. I'm wondering if loading the file this way somehow strips the data or if there is something else I may be doing incorrectly. I've been working on regridding to a coarser resolution, but that will be pointless if there aren't useable data. Thanks!
Anderson Banihirwe (Oct 27 2020 at 20:33):@Danica Lombardozzi , that's strange...
it looks to me as if there aren't any data in the file.
I think the data is there because when I compute some metrics such as mean, min, etc... I get values
In [1]: import xarray as xr

In [2]: da = xr.open_rasterio('/glade/work/dll/SIF_GPP/data.globalecology.unh.edu/data/GOSIF-GPP_v2/Monthly/Mean/GOSIF_GP
   ...: P_2000.M03_Mean.tif')

In [3]: da.mean(), da.min(), da.max(), da.std()
Out[3]:
(<xarray.DataArray ()>
 array(52212.33478943),
 <xarray.DataArray ()>
 array(0, dtype=uint16),
 <xarray.DataArray ()>
 array(65535, dtype=uint16),
 <xarray.DataArray ()>
 array(25213.59032424))
I will look into the plotting issue and will get back to you
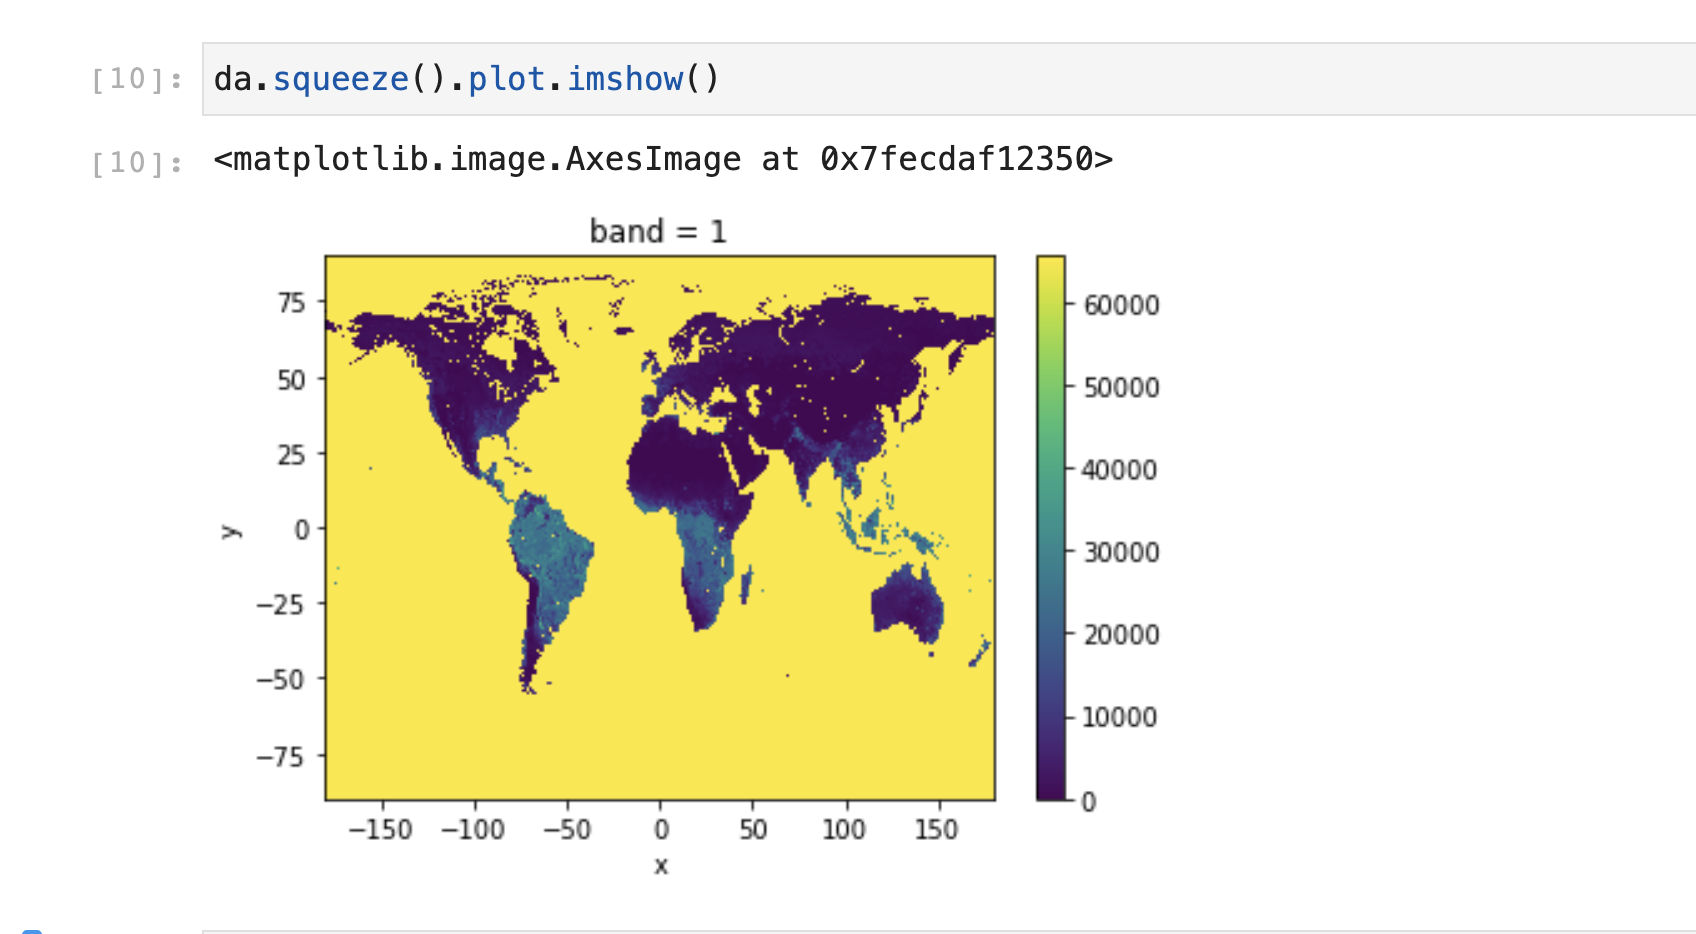
Anderson Banihirwe (Oct 27 2020 at 20:57):I think I figured out how to get an image/plot from the data.
Using da.squeeze().plot.imshow() --which displays data as an image, i.e., on a 2D regular raster-- works perfectly fine:
Screen-Shot-2020-10-27-at-2.39.59-PM.png
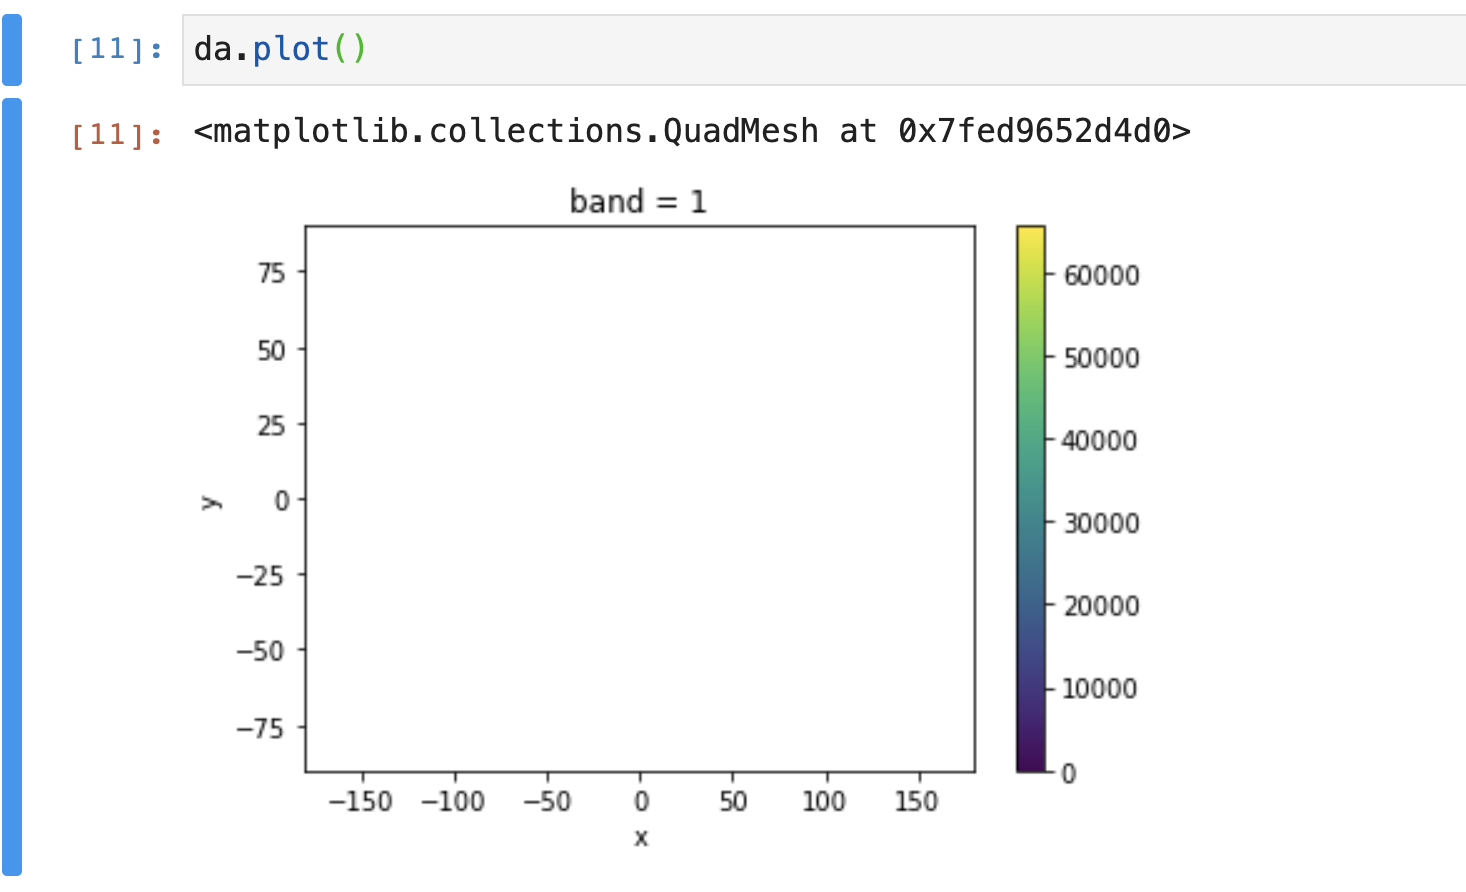
I don't know why the colormesh plot is blank though (Ccing @Deepak Cherian who knows more than me. There's a chance he might have a clue about what's going on :slight_smile:)
Screen-Shot-2020-10-27-at-2.52.48-PM.png
Danica Lombardozzi (Oct 27 2020 at 22:24):Thanks Anderson! I was able to get that to work, and I'm glad to know that the data are there. I was wondering if you can help with another problem related to these data. The data are on a very high resolution grid (0.05-degree), and I would like to make direct comparisons to CESM simulations. I've been using the xesmf tool to regrid, but it hangs for 10 minutes or more before I give up. I'm currently testing the code for only a single file and I have many more that I hope to regrid (and save). Is there an easy way to make this more efficient that what I'm currently doing? This assumes that I'm doing the regridding correctly in the first place, which I've not yet verified.
#Data
sifdat = xr.open_rasterio(sifdir + "GOSIF_GPP_2001.M01_Mean.tif")
sifdat = sifdat.rename({'x':'lat'})
sifdat = sifdat.rename({'y':'lon'})
#<xarray.DataArray (lat: 3600, lon: 7200)>

#Regrid
sif_coarse = xr.Dataset({'lat': (['lat'], np.arange(-90,90,0.94)),
                         'lon': (['lon'], np.arange(0,360,1.25)),
                        }
                       )
sif_coarse
#<xarray.Dataset: Dimensions:  (lat: 192, lon: 288)>

# Next line very slow, never successfully completed
regridder = xe.Regridder(sifdat, sif_coarse, 'bilinear')
sif_out = regridder(sif_coarse)
Matt Long (Oct 27 2020 at 22:43):@Danica Lombardozzi, that problem may be too big for xesmf, which calls the serial version of the ESMF to generate weights.
Here's a script that invokes a parallel version of ESMF_RegridWeightGen
https://github.com/marbl-ecosys/marbl-forcing/blob/master/Fe_sediment_flux/esmf_gen_weights.pbs
In order to use this, you will need SCRIP format grid files for the SRC and DST grids.
Here's a function that creates a SCRIP grid file for regular lat/lon grids
https://github.com/matt-long/krill-cesm-le/blob/75d749197e2754f3bd6c2a714866816b56822d3a/notebooks/util.py#L292
More complicated grids are...more complicated. pop_tools.get_grid can return a SCRIP grid.
Once you have the weight files, you can likely use xESMF to apply them.
I have code to do this too that is based on xESMF, but provides some other features.
https://github.com/matt-long/krill-cesm-le/blob/75d749197e2754f3bd6c2a714866816b56822d3a/notebooks/util.py#L499
Would be great to get the @geocat team involved here; we are really lacking a clean, comprehensive solution to regridding.
Alea Kootz (Oct 27 2020 at 22:44):Consider us informed, I'll start reading and see if our current or planned regridding tools would help in this case.
Danica Lombardozzi (Oct 28 2020 at 14:41):Thanks Matt! I'll see if I can get something working based on the scripts you point me to.
Danica Lombardozzi (Nov 17 2020 at 23:42):Another question related to GeoTIFF files: Is there a way to read in multiple files? I've been using open_rasterio, but can only seem to open a single file at a time. I have >200 monthly files that I'd like to open as a data array, so I think I'm looking for the equivalent of open_mfdataset for GeoTiff files in xarray. Thanks!
Anderson Banihirwe (Nov 17 2020 at 23:55):It's my understanding that currently xarray.open_mfdataset() works for netCDF and HDF files only (this may change in the future).
So, to read in multiple GeoTiff files, you may want to try something along these lines:
list_of_files = ['file1.tif', 'file2.tif']
dsets = []
# Loop over the list of files, reading each one in its own dataarray
for file in list_of_files:
  da = xr.open_rasterio(file, .....)
  dsets.append(da)

# concatenate/merge the list of read files into a single datarray/dataset
ds = xr.combine_by_coords(dsets)
Anderson Banihirwe (Nov 18 2020 at 00:01)::warning: :warning: It turns out that the code snippet above has a bug in it :slight_smile:...
Anderson Banihirwe (Nov 18 2020 at 00:11):@Danica Lombardozzi, is this what you are looking for?
In [1]: import xarray as xr

In [2]: import pathlib

In [3]: root_path = pathlib.Path('/glade/work/dll/SIF_GPP/data.globalecology.unh.edu/data/GOSIF-GPP_v2/Monthly/Mean/')

In [4]: files = sorted(root_path.rglob("*.tif"))

In [5]: len(files)
Out[5]: 226

In [6]: files[:4]
Out[6]:
[PosixPath('/glade/work/dll/SIF_GPP/data.globalecology.unh.edu/data/GOSIF-GPP_v2/Monthly/Mean/GOSIF_GPP_2000.M03_Mean.tif'),
 PosixPath('/glade/work/dll/SIF_GPP/data.globalecology.unh.edu/data/GOSIF-GPP_v2/Monthly/Mean/GOSIF_GPP_2000.M04_Mean.tif'),
 PosixPath('/glade/work/dll/SIF_GPP/data.globalecology.unh.edu/data/GOSIF-GPP_v2/Monthly/Mean/GOSIF_GPP_2000.M05_Mean.tif'),
 PosixPath('/glade/work/dll/SIF_GPP/data.globalecology.unh.edu/data/GOSIF-GPP_v2/Monthly/Mean/GOSIF_GPP_2000.M06_Mean.tif')]

In [7]: # Loop over the first 4 files for testing purposes

In [8]: dsets = []

In [37]: for file in files[:4]:
    ...:     da = xr.open_rasterio(file)
    ...:     dsets.append(da)

In [38]: ds = xr.concat(dsets, dim='new_dim')
Anderson Banihirwe (Nov 18 2020 at 00:12):The resulting ds looks like:
In [39]: ds
Out[39]:
<xarray.DataArray (new_dim: 4, band: 1, y: 3600, x: 7200)>
array([[[[65535, 65535, 65535, ..., 65535, 65535, 65535],
         [65535, 65535, 65535, ..., 65535, 65535, 65535],
         [65535, 65535, 65535, ..., 65535, 65535, 65535],
         ...,
         [65535, 65535, 65535, ..., 65535, 65535, 65535],
         [65535, 65535, 65535, ..., 65535, 65535, 65535],
         [65535, 65535, 65535, ..., 65535, 65535, 65535]]],


       [[[65535, 65535, 65535, ..., 65535, 65535, 65535],
         [65535, 65535, 65535, ..., 65535, 65535, 65535],
         [65535, 65535, 65535, ..., 65535, 65535, 65535],
         ...,
         [65535, 65535, 65535, ..., 65535, 65535, 65535],
Danica Lombardozzi (Nov 18 2020 at 00:33):Thanks @Anderson Banihirwe! I'll try that out.
Anderson Banihirwe (Nov 18 2020 at 00:38):Of course! Let me know how it goes.. I don't know how much memory you have access to, but it looks like you need at least 10GB to load all 200+ files in memory... or you could chunk the files (which will allow you to take advantage of dask's parallelism) by changing this line
da = xr.open_rasterio(file)
to
da = xr.open_rasterio(file, chunks={})
Danica Lombardozzi (Nov 18 2020 at 00:51):Oh, thanks! Do I specify a value in chunks={}, or does leaving it open also work?
Anderson Banihirwe (Nov 18 2020 at 19:09):Leaving chunks={} open works too. Each file will be loaded in a single chunk of ~ 50MB
Danica Lombardozzi (Dec 10 2020 at 21:47):@Matt Long : I am circling back to trying to figure out regridding using the information you provided here but still having trouble. I am trying to use the latlon_to_scrip function you wrote (from https://github.com/matt-long/krill-cesm-le/blob/75d749197e2754f3bd6c2a714866816b56822d3a/notebooks/util.py#L292), but when I apply it to my data, I get an error message.
ds
<xarray.DataArray (sif_gpp: 216, band: 1, y: 3600, x: 7200)>
dask.array<shape=(216, 1, 3600, 7200), dtype=uint16, chunksize=(1, 1, 3600, 7200)>
Coordinates:
  * band     (band) int64 1
  * y        (y) float64 89.97 89.92 89.88 89.83 ... -89.83 -89.88 -89.93 -89.98
  * x        (x) float64 -180.0 -179.9 -179.9 -179.8 ... 179.8 179.9 179.9 180.0
Dimensions without coordinates: sif_gpp
Attributes:
    transform:   (0.05, 0.0, -180.0, 0.0, -0.05, 90.0)
    crs:         +init=epsg:4326
    res:         (0.05, 0.05)
    is_tiled:    1
    nodatavals:  (nan,)


latlon_to_scrip(ds.x, ds.y)

---------------------------------------------------------------------------
ValueError                                Traceback (most recent call last)
<ipython-input-40-a2db51e14aae> in <module>
----> 1 latlon_to_scrip(ds.x, ds.y)

<ipython-input-39-4e3c68adb9d8> in latlon_to_scrip(nx, ny, lon0, grid_imask, file_out)
     27     dx = 360. / nx
     28     dy = 180. / ny
---> 29     lat = np.arange(-90. + dy / 2., 90., dy)
     30     lon = np.arange(lon0 + dx / 2., lon0 + 360., dx)
     31

~/miniconda/envs/analysis/lib/python3.7/site-packages/xarray/core/common.py in __bool__(self)
     80
     81     def __bool__(self):
---> 82         return bool(self.values)
     83
     84     # Python 3 uses __bool__, Python 2 uses __nonzero__

ValueError: The truth value of an array with more than one element is ambiguous. Use a.any() or a.all()
Any idea what is going wrong here?
Also, do you have any examples of applying this function and then regridding high resolution data? I'm not confident that I'll know how to apply the mask properly once it's created.
Matt Long (Dec 10 2020 at 22:13):@Danica Lombardozzi, the function signature for latlon_to_scrip expects nx and ny, which are number of of grid cells in the x and y directions, respectively. It looks to me like you are passing in x and y themselves.
Matt Long (Dec 10 2020 at 22:16):Here's a hi-res-regridding weigh generation step:
https://github.com/marbl-ecosys/forcing-Fe-sedflux/blob/mom6-dev/notebooks/esmf_gen_weights_etopo1_to_POP.pbs
Danica Lombardozzi (Dec 11 2020 at 00:01):Thanks @Matt Long . I was able to get the latlon_to_scrip function to work and create the files. I've submitted a script similar to the example you shared to generate the weights.
Assuming this works, I'm still not sure how to to apply these weights using the xESMF regridder. The documentation shows xe.Regridder(grid_in, grid_out, method), with options to reuse and clean weights, but I don't see an option to use or specify a weights file. Do you know how to do this or have an example? Thanks!
Matt Long (Dec 11 2020 at 00:04):My latest incarnation of this is here:
https://github.com/marbl-ecosys/forcing-Fe-sedflux/blob/mom6-dev/notebooks/preliminary_MOM6_forcing.ipynb
Relying on a module regrid_tools
Again, not well documented...but I think you can probably follow reasonably well.
Danica Lombardozzi (Dec 11 2020 at 00:07):Thanks! I'll give it a shot tomorrow -- hopefully the script to create the weights will be done by then!
Danica Lombardozzi (Dec 16 2020 at 18:28):@Matt Long Thanks for all your help so far. I'm still struggling with the regrid function from your regrid_tools module and was hoping you can point me in the right direction. I created the src, dst, and weights files, but I think I'm likely specifying the inputs for regrid incorrectly. Note that the src (sifgrid_latlon_0.05x0.05_180W.nc) and dst (CESM_latlon_1x1_180W.nc) files are here: /glade/work/dll/esmlab-regrid and the weights file is here: /glade/work/dll/esmlab-regrid/weights.
ds

<xarray.DataArray (sif_gpp: 216, band: 1, y: 3600, x: 7200)>
dask.array<shape=(216, 1, 3600, 7200), dtype=uint16, chunksize=(1, 1, 3600, 7200)>
Coordinates:
  * band     (band) int64 1
  * y        (y) float64 89.97 89.92 89.88 89.83 ... -89.83 -89.88 -89.93 -89.98
  * x        (x) float64 -180.0 -179.9 -179.9 -179.8 ... 179.8 179.9 179.9 180.0
Dimensions without coordinates: sif_gpp
Attributes:
    transform:   (0.05, 0.0, -180.0, 0.0, -0.05, 90.0)
    crs:         +init=epsg:4326
    res:         (0.05, 0.05)
    is_tiled:    1
    nodatavals:  (nan,)

regrid_dir = f'/glade/work/dll/esmlab-regrid/weights'
src_grid   = 'sifgrid_latlon_0.05x0.05_180W'
dst_grid   = 'CESM_latlon_1x1_180W'
method     = 'conserve'

sif_1deg = regridder.regrid(ds, renormalize=True, apply_mask=True)
sif_1deg

---------------------------------------------------------------------------
TypeError                                 Traceback (most recent call last)
<ipython-input-19-828097d1ff00> in <module>
      2 # https://github.com/marbl-ecosys/forcing-Fe-sedflux/blob/mom6-dev/notebooks/preliminary_MOM6_forcing.ipynb
      3
----> 4 sif_1deg = regridder.regrid(ds, renormalize=True, apply_mask=True)
      5 sif_1deg

TypeError: regrid() missing 1 required positional argument: 'obj'
I also tried
grid_file  = 'sifgrid_latlon_0.05x0.05_180W_to_CESM_latlon_1x1_180W_conservative.nc'
regridder  = regrid_utils.regridder(src_grid, dst_grid, method, clobber=False)
---------------------------------------------------------------------------
AttributeError                            Traceback (most recent call last)
<ipython-input-22-31fc67c0dae3> in <module>
      1 grid_file  = 'sifgrid_latlon_0.05x0.05_180W_to_CESM_latlon_1x1_180W_conservative.nc'
----> 2 regridder  = regrid_utils.regridder(src_grid, dst_grid, method, clobber=False)

/glade/work/dll/CTSM_py/ctsm_py/regrid_utils.py in __init__(self, src_grid, dst_grid, method, clobber)
    126     def __init__(self, src_grid, dst_grid, method='bilinear', clobber=False):
    127
--> 128         self.src_grid_file = src_grid.grid_file
    129         self.dst_grid_file = dst_grid.grid_file
    130         self.method = method

AttributeError: 'str' object has no attribute 'grid_file'
I used this code as an example: https://github.com/marbl-ecosys/forcing-Fe-sedflux/blob/mom6-dev/notebooks/preliminary_MOM6_forcing.ipynb
Where am I going wrong?
Matt Long (Dec 21 2020 at 22:11):@Danica Lombardozzi, sorry, I probably won't have time to get back to you until the New Year.
Last updated: May 16 2025 at 17:14 UTC