Stephen Yeager (Apr 09 2020 at 16:13): Stephen Yeager (Apr 09 2020 at 16:13):
mom6_tools has some nice plotting functionality in m6plot.py. It would be nice if those of us analyzing POP didn't have to individually reinvent the wheel to generate standard plots. How hard would it be to add a version of m6plot.py to pop_tools?
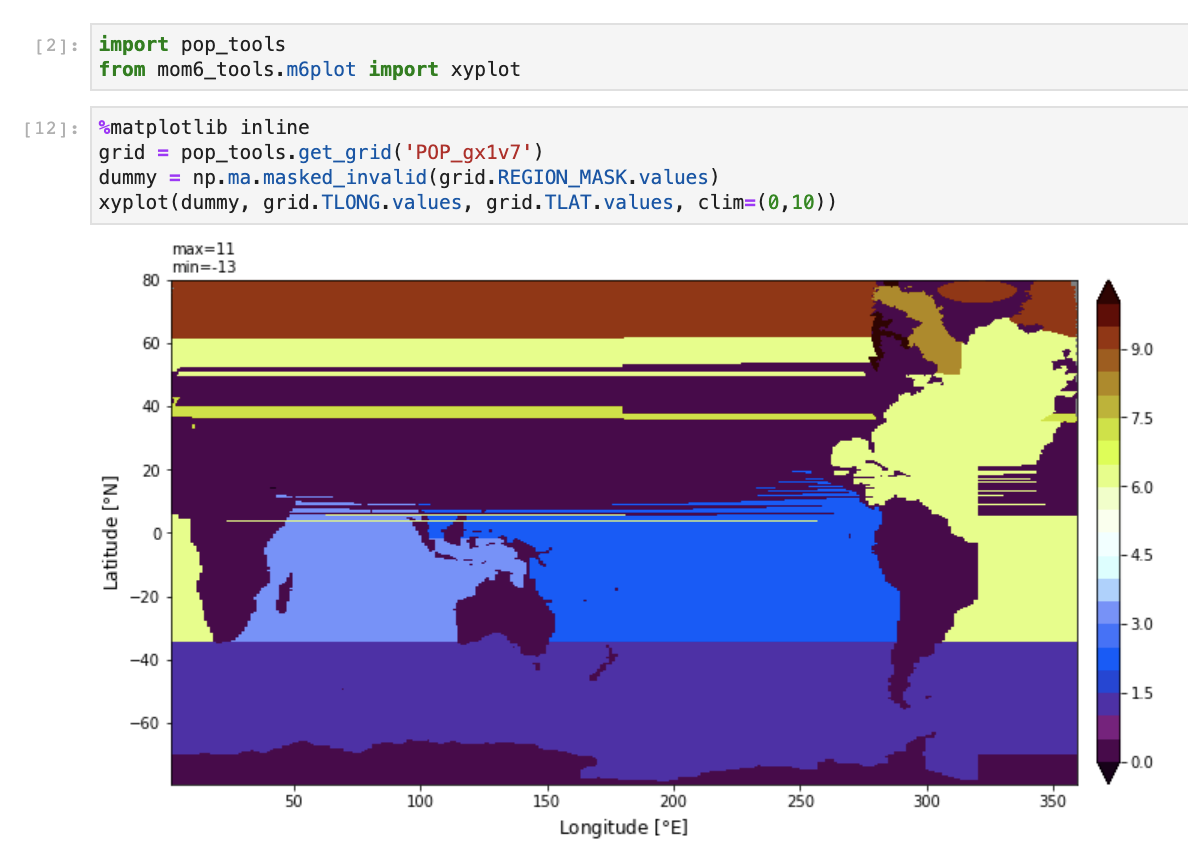
Gustavo M Marques (Apr 10 2020 at 19:42):mom6_tools has some nice plotting functionality in m6plot.py. It would be nice if those of us analyzing POP didn't have to individually reinvent the wheel to generate standard plots. How hard would it be to add a version of m6plot.py to pop_tools?
Adding a version of m6plot.py into pop_tools would not be hard. However, as shown below, it seems some of the plotting capabilities need to be adjusted to work properly with the gx1v7 grid. I am not sure what's happening here...
pasted image
Deepak Cherian (Apr 10 2020 at 19:50):This may need the add_cyclic_point workaround
Fred Castruccio (Apr 10 2020 at 20:26):Yes. The longitude in POP grid are not monotonic and most plotting tools don't like that. We came up with the a workaround. Matt wrapped it in the following function.
def pop_add_cyclic(ds):

    nj = ds.TLAT.shape[0]
    ni = ds.TLONG.shape[1]

    xL = int(ni/2 - 1)
    xR = int(xL + ni)

    tlon = ds.TLONG.data
    tlat = ds.TLAT.data

    tlon = np.where(np.greater_equal(tlon, min(tlon[:,0])), tlon-360., tlon)
    lon  = np.concatenate((tlon, tlon + 360.), 1)
    lon = lon[:, xL:xR]

    if ni == 320:
        lon[367:-3, 0] = lon[367:-3, 0] + 360.
    lon = lon - 360.

    lon = np.hstack((lon, lon[:, 0:1] + 360.))
    if ni == 320:
        lon[367:, -1] = lon[367:, -1] - 360.

    #-- trick cartopy into doing the right thing:
    #   it gets confused when the cyclic coords are identical
    lon[:, 0] = lon[:, 0] - 1e-8

    #-- periodicity
    lat = np.concatenate((tlat, tlat), 1)
    lat = lat[:, xL:xR]
    lat = np.hstack((lat, lat[:,0:1]))

    TLAT = xr.DataArray(lat, dims=('nlat', 'nlon'))
    TLONG = xr.DataArray(lon, dims=('nlat', 'nlon'))

    dso = xr.Dataset({'TLAT': TLAT, 'TLONG': TLONG})

    # copy vars
    varlist = [v for v in ds.data_vars if v not in ['TLAT', 'TLONG']]
    for v in varlist:
        v_dims = ds[v].dims
        if not ('nlat' in v_dims and 'nlon' in v_dims):
            dso[v] = ds[v]
        else:
            # determine and sort other dimensions
            other_dims = set(v_dims) - {'nlat', 'nlon'}
            other_dims = tuple([d for d in v_dims if d in other_dims])
            lon_dim = ds[v].dims.index('nlon')
            field = ds[v].data
            field = np.concatenate((field, field), lon_dim)
            field = field[..., :, xL:xR]
            field = np.concatenate((field, field[..., :, 0:1]), lon_dim)
            dso[v] = xr.DataArray(field, dims=other_dims+('nlat', 'nlon'),
                                  attrs=ds[v].attrs)


    # copy coords
    for v, da in ds.coords.items():
        if not ('nlat' in da.dims and 'nlon' in da.dims):
            dso = dso.assign_coords(**{v: da})


    return dso
Gustavo M Marques (Apr 10 2020 at 20:30):That should go into pop_tools if it is not already there.
Deepak Cherian (Apr 16 2020 at 20:03):On a related note, Ben Johnson (who will join soon), apparently has a plotting function that handles the tripole seam. cc @Dan Amrhein
Last updated: May 16 2025 at 17:14 UTC