
Climatology#
Overview#
This section covers the following climatology functions from NCL, which can be replicated in Python using xarray and/or geocat.comp:
Functions#
calcDayAnom*#
calcDayAnomTLL calculates daily anomalies from a daily data climatology.
Grab and Go#
import xarray as xr
import geocat.datafiles as gcd
from matplotlib import pyplot as plt
ds = xr.open_dataset(gcd.get("applications_files/inputs/CMIP6_sea_ice_daily_subset.nc"))
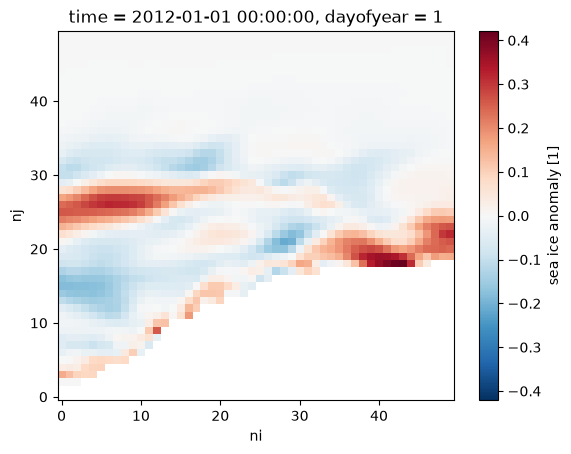
DayTLL = ds.aice_d.groupby("time.dayofyear")
clmDayTLL = DayTLL.mean("time")
calcDayAnomTLL = DayTLL - clmDayTLL
calcDayAnomTLL[0, :, :].assign_attrs(long_name="sea ice anomaly").plot();
Downloading file 'applications_files/inputs/CMIP6_sea_ice_daily_subset.nc' from 'https://github.com/NCAR/geocat-datafiles/raw/main/applications_files/inputs/CMIP6_sea_ice_daily_subset.nc' to '/home/runner/.cache/geocat'.
from geocat.comp import climate_anomaly
import geocat.datafiles as gcd

ds = xr.open_dataset(gcd.get("applications_files/inputs/CMIP6_sea_ice_daily_subset.nc"))

calcDayAnomTLL = climate_anomaly(ds.aice_d, "day")
calcMonAnom*#
calcMonAnomTLL, calcMonAnomTLLL, calcMonAnomLLT, and calcMonAnomLLLT calculate monthly anomalies by subtracting the long-term mean from each point.
Grab and Go#
import xarray as xr
import geocat.datafiles as gcd
ds = xr.open_dataset(
gcd.get("applications_files/inputs/CMIP6_sea_ice_monthly_subset.nc")
)
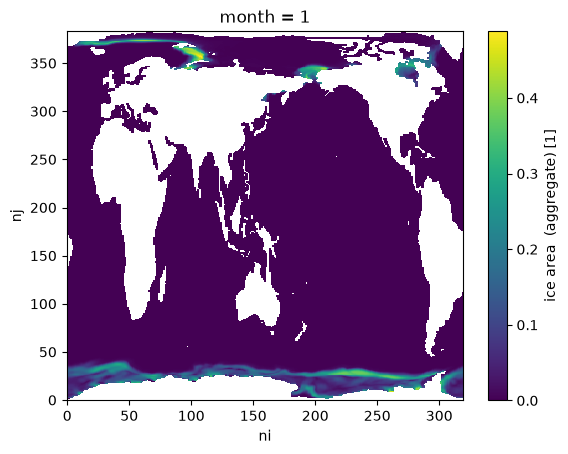
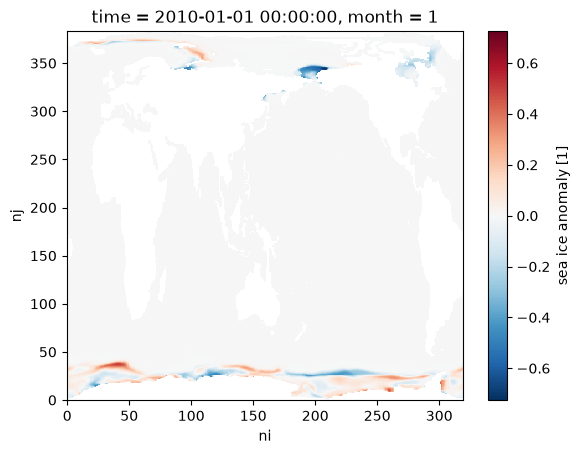
MonTLL = ds.aice.groupby("time.month")
clmMonTLL = MonTLL.mean("time")
calcMonAnomTLL = MonTLL - clmMonTLL
calcMonAnomTLL = calcMonAnomTLL.assign_attrs(long_name="sea ice anomaly")
calcMonAnomTLL[0, :, :].plot();
Downloading file 'applications_files/inputs/CMIP6_sea_ice_monthly_subset.nc' from 'https://github.com/NCAR/geocat-datafiles/raw/main/applications_files/inputs/CMIP6_sea_ice_monthly_subset.nc' to '/home/runner/.cache/geocat'.
from geocat.comp import climate_anomaly
import geocat.datafiles as gcd

ds = xr.open_dataset(
    gcd.get("applications_files/inputs/CMIP6_sea_ice_monthly_subset.nc")
)

calcMonAnomTLL = climate_anomaly(ds.aice, "month")
clmDay*#
clmDayTLL and clmDayTLLL calculate long-term daily means (daily climatology) from daily data.
Grab and Go#
import xarray as xr
import geocat.datafiles as gcd
ds = xr.open_dataset(gcd.get("applications_files/inputs/CMIP6_sea_ice_daily_subset.nc"))
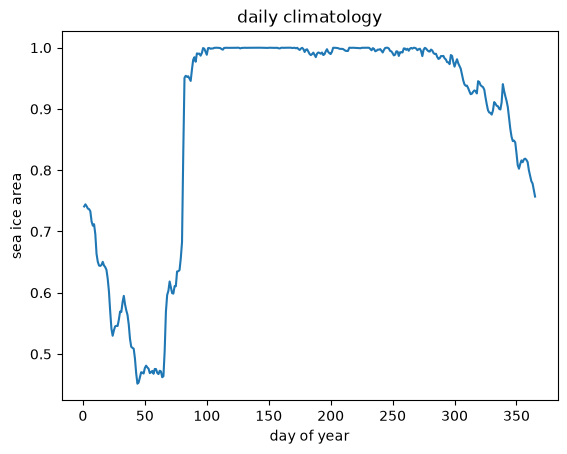
clmDayTLL = ds.aice_d.groupby("time.dayofyear").mean("time")
clmDayTLL[:, 10, 10].plot()
plt.title("daily climatology")
plt.xlabel("day of year")
plt.ylabel("sea ice area");
from geocat.comp import climatology_average
import geocat.datafiles as gcd

ds = xr.open_dataset(gcd.get("applications_files/inputs/CMIP6_sea_ice_daily_subset.nc"))

clmDayTLL = climatology_average(ds.aice_d, "day")
clmMon*#
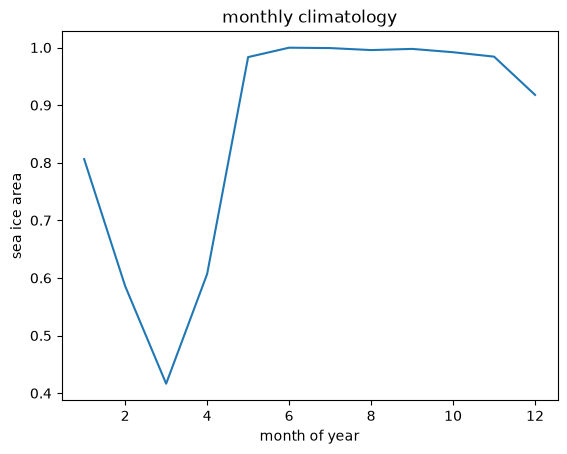
clmMonTLL, clmMonTLLL, clmMonLLT, and clmMonLLLT calculate long-term monthly means (monthly climatology) from monthly data.
Grab and Go#
import xarray as xr
import geocat.datafiles as gcd

ds = xr.open_dataset(
    gcd.get("applications_files/inputs/CMIP6_sea_ice_monthly_subset.nc")
)

clmMonTLL = ds.aice.groupby("time.month").mean("time")

clmMonTLL[:, 10, 10].plot()
plt.title("monthly climatology")
plt.xlabel("month of year")
plt.ylabel("sea ice area");
from geocat.comp import climatology_average
import geocat.datafiles as gcd

ds = xr.open_dataset(
    gcd.get("applications_files/inputs/CMIP6_sea_ice_monthly_subset.nc")
)

clmMonTLL = climatology_average(ds.aice, "month")
month_to_season#
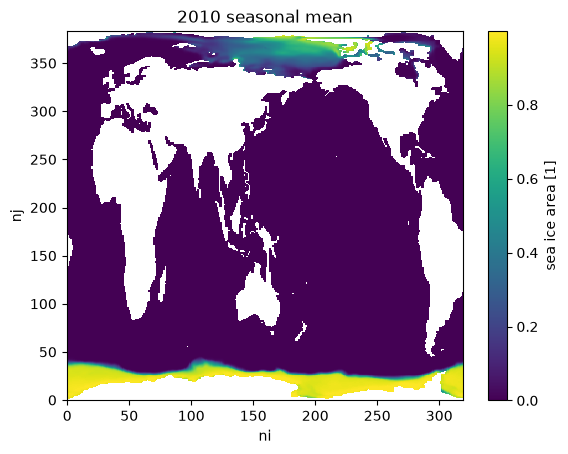
month_to_season computes a user-specified three-month seasonal mean (DJF, JFM, FMA, MAM, AMJ, MJJ, JJA, JAS, ASO, SON, OND, NDJ).
Note
You can do something similar directly with Xarray as shown here in the Xarray documentation. However, it requires more code.
Grab and Go#
import xarray as xr
import geocat.datafiles as gcd
from geocat.comp import month_to_season

ds = xr.open_dataset(
    gcd.get("applications_files/inputs/CMIP6_sea_ice_monthly_subset.nc")
)

mon_to_season = month_to_season(ds.aice, "ASO").assign_attrs(long_name="sea ice area")

mon_to_season[0, :, :].plot()

plt.title("2010 seasonal mean");
rmMonAnnCyc*#
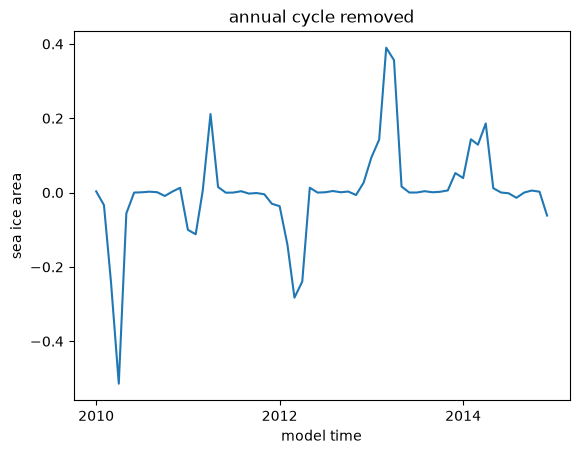
rmMonAnnCycTLL, rmMonAnnCycLLT, and rmMonAnnCycLLLT remove the annual cycle from monthly data.
Grab and Go#
import xarray as xr
import geocat.datafiles as gcd

ds = xr.open_dataset(
    gcd.get("applications_files/inputs/CMIP6_sea_ice_monthly_subset.nc")
)

MonTLL = ds.aice.groupby("time.month")
clmMonTLL = MonTLL.mean("time")
rmMonAnnCycTLL = MonTLL - clmMonTLL

rmMonAnnCycTLL[:, 10, 10].plot()
plt.title("annual cycle removed")
plt.ylabel("sea ice area");
stdMon*#
stdMonTLL, stdMonTLLL, stdMonLLT, and stdMonLLLT calculate standard deviations of monthly means.
Grab and Go#
import xarray as xr
import geocat.datafiles as gcd

ds = xr.open_dataset(
    gcd.get("applications_files/inputs/CMIP6_sea_ice_monthly_subset.nc")
)

stdMonTLL = ds.aice.groupby("time.month").std(ddof=1)

stdMonTLL[0, :, :].plot();