Access CMIP6 zarr data from AWS using the osdf protocol and compute Equilibrium Climate Sensitivity (ECS)
Section 1: Introduction
Load python packkages
Load catalog url
from matplotlib import pyplot as plt
import xarray as xr
import numpy as np
import dask
from dask.diagnostics import progress
from tqdm.autonotebook import tqdm
import intake
import fsspec
import seaborn as sns
import re
import aiohttp
from dask_jobqueue import PBSCluster
import pandas as pd
from xhistogram.xarray import histogram
/glade/derecho/scratch/harshah/tmp/ipykernel_65276/3451259092.py:6: TqdmWarning: IProgress not found. Please update jupyter and ipywidgets. See https://ipywidgets.readthedocs.io/en/stable/user_install.html
from tqdm.autonotebook import tqdm
# import fsspec.implementations.http as fshttp
from pelicanfs.core import OSDFFileSystem,PelicanMap
lustre_scratch = '/glade/derecho/scratch/harshah'
gdex_url = 'https://data.gdex.ucar.edu/'
cat_url = gdex_url + 'd850001/catalogs/osdf/cmip6-aws/cmip6-osdf-zarr.json'
# cat_url = 'https://cmip6-pds.s3.amazonaws.com/pangeo-cmip6.json'Section 2: Select Dask Cluster
Select the Dask cluster type
The default will be LocalCluster as that can run on any system.
If running on a HPC computer with a PBS Scheduler, set to True. Otherwise, set to False.
USE_PBS_SCHEDULER = TrueIf running on Jupyter server with Dask Gateway configured, set to True. Otherwise, set to False.
USE_DASK_GATEWAY = FalsePython function for a PBS cluster
# Create a PBS cluster object
def get_pbs_cluster():
    """ Create cluster through dask_jobqueue.
    """
    from dask_jobqueue import PBSCluster
    cluster = PBSCluster(
        job_name = 'dask-osdf-24',
        cores = 1,
        memory = '4GiB',
        processes = 1,
        local_directory = lustre_scratch + '/dask/spill',
        log_directory = lustre_scratch + '/dask/logs/',
        resource_spec = 'select=1:ncpus=1:mem=4GB',
        queue = 'casper',
        walltime = '3:00:00',
        #interface = 'ib0'
        interface = 'ext'
    )
    return cluster
Python function for a Gateway Cluster
def get_gateway_cluster():
    """ Create cluster through dask_gateway
    """
    from dask_gateway import Gateway

    gateway = Gateway()
    cluster = gateway.new_cluster()
    cluster.adapt(minimum=2, maximum=4)
    return cluster
def get_local_cluster():
""" Create cluster using the Jupyter server's resources
"""
from distributed import LocalCluster, performance_report
cluster = LocalCluster()
cluster.scale(6)
return clusterPython logic for a Local Cluster
This uses True/False boolean logic based on the variables set in the previous cells
# Obtain dask cluster in one of three ways
if USE_PBS_SCHEDULER:
    cluster = get_pbs_cluster()
elif USE_DASK_GATEWAY:
    cluster = get_gateway_cluster()
else:
    cluster = get_local_cluster()

# Connect to cluster
from distributed import Client
client = Client(cluster)
/glade/u/home/harshah/.conda/envs/osdf/lib/python3.11/site-packages/distributed/node.py:188: UserWarning: Port 8787 is already in use.
Perhaps you already have a cluster running?
Hosting the HTTP server on port 39347 instead
warnings.warn(
# Scale the cluster and display cluster dashboard URL
n_workers =8
cluster.scale(n_workers)
client.wait_for_workers(n_workers = n_workers)
cluster
Loading...
Section 3: Data Loading
Load catalog and select data subset
col = intake.open_esm_datastore(cat_url)
col
Loading...
[eid for eid in col.df['experiment_id'].unique() if 'ssp' in eid]['esm-ssp585-ssp126Lu',
'ssp126-ssp370Lu',
'ssp370-ssp126Lu',
'ssp585',
'ssp245',
'ssp370-lowNTCF',
'ssp370SST-ssp126Lu',
'ssp370SST',
'ssp370pdSST',
'ssp370SST-lowCH4',
'ssp370SST-lowNTCF',
'ssp126',
'ssp119',
'ssp370',
'esm-ssp585',
'ssp245-nat',
'ssp245-GHG',
'ssp460',
'ssp434',
'ssp534-over',
'ssp245-aer',
'ssp245-stratO3',
'ssp245-cov-fossil',
'ssp245-cov-modgreen',
'ssp245-cov-strgreen',
'ssp245-covid',
'ssp585-bgc']query = dict(
experiment_id=['abrupt-4xCO2','piControl'], # pick the `abrupt-4xCO2` and `piControl` forcing experiments
table_id='Amon', # choose to look at atmospheric variables (A) saved at monthly resolution (mon)
variable_id=['tas', 'rsut','rsdt','rlut'], # choose to look at near-surface air temperature (tas) as our variable
member_id = 'r1i1p1f1', # arbitrarily pick one realization for each model (i.e. just one set of initial conditions)
)
col_subset = col.search(require_all_on=["source_id"], **query)
col_subset.df.groupby("source_id")[
["experiment_id", "variable_id", "table_id"]
].nunique()Loading...
def drop_all_bounds(ds):
    """Drop coordinates like 'time_bounds' from datasets,
    which can lead to issues when merging."""
    drop_vars = [vname for vname in ds.coords
                 if (('_bounds') in vname ) or ('_bnds') in vname]
    return ds.drop_vars(drop_vars)

def open_dsets(df):
    """Open datasets from cloud storage and return xarray dataset."""
    dsets = [xr.open_zarr(fsspec.get_mapper(ds_url), consolidated=True)
             .pipe(drop_all_bounds)
             for ds_url in df.zstore]
    try:
        ds = xr.merge(dsets, join='exact')
        return ds
    except ValueError:
        return None

def open_delayed(df):
    """A dask.delayed wrapper around `open_dsets`.
    Allows us to open many datasets in parallel."""
    return dask.delayed(open_dsets)(df)
from collections import defaultdict
dsets = defaultdict(dict)
for group, df in col_subset.df.groupby(by=['source_id', 'experiment_id']):
dsets[group[0]][group[1]] = open_delayed(df)%time open_dsets(df)/glade/u/home/harshah/.conda/envs/osdf/lib/python3.11/site-packages/pyproj/network.py:59: UserWarning: pyproj unable to set PROJ database path.
_set_context_ca_bundle_path(ca_bundle_path)
CPU times: user 5.69 s, sys: 326 ms, total: 6.01 s
Wall time: 19.5 s
Loading...
dsets_ = dask.compute(dict(dsets))[0]Section 4: Data Analysis
Reduce data via Global Mean
Grab some observations ?
def get_lat_name(ds):
    """Figure out what is the latitude coordinate for each dataset."""
    for lat_name in ['lat', 'latitude']:
        if lat_name in ds.coords:
            return lat_name
    raise RuntimeError("Couldn't find a latitude coordinate")

def global_mean(ds):
    """Return global mean of a whole dataset."""
    lat = ds[get_lat_name(ds)]
    weight = np.cos(np.deg2rad(lat))
    weight /= weight.mean()
    other_dims = set(ds.dims) - {'time'}
    return (ds * weight).mean(other_dims)
expts = ['piControl', 'abrupt-4xCO2']
expt_da = xr.DataArray(expts, dims='experiment_id',
coords={'experiment_id': expts})
dsets_aligned = {}
for k, v in tqdm(dsets_.items()):
expt_dsets = v.values()
if any([d is None for d in expt_dsets]):
print(f"Missing experiment for {k}")
continue
for ds in expt_dsets:
ds.coords['year'] = ds.time.dt.year - ds.time.dt.year[0]
# workaround for
# https://github.com/pydata/xarray/issues/2237#issuecomment-620961663
dsets_ann_mean = [v[expt].pipe(global_mean).swap_dims({'time': 'year'}).drop_vars('time').coarsen(year=12).mean()
for expt in expts]
# align everything with the 4xCO2 experiment
dsets_aligned[k] = xr.concat(dsets_ann_mean, join='right',dim=expt_da) 2%|▏ | 1/41 [00:01<00:47, 1.18s/it]Missing experiment for ACCESS-ESM1-5
22%|██▏ | 9/41 [00:04<00:10, 3.02it/s]Missing experiment for CAS-ESM2-0
39%|███▉ | 16/41 [00:07<00:12, 2.08it/s]Missing experiment for EC-Earth3-Veg
46%|████▋ | 19/41 [00:08<00:10, 2.16it/s]Missing experiment for FIO-ESM-2-0
Missing experiment for GFDL-CM4
78%|███████▊ | 32/41 [00:14<00:04, 1.98it/s]Missing experiment for MPI-ESM-1-2-HAM
100%|██████████| 41/41 [00:20<00:00, 1.96it/s]
%%time
dsets_aligned_ = dask.compute(dsets_aligned)[0]
CPU times: user 19.5 s, sys: 1.16 s, total: 20.6 s
Wall time: 11min 32s
source_ids = list(dsets_aligned_.keys())
source_da = xr.DataArray(source_ids, dims='source_id',coords={'source_id': source_ids})

big_ds = xr.concat([ds.reset_coords(drop=True) for ds in dsets_aligned_.values()],
                   dim=source_da)
big_ds
/glade/derecho/scratch/harshah/tmp/ipykernel_65276/4208675474.py:4: FutureWarning: In a future version of xarray the default value for join will change from join='outer' to join='exact'. This change will result in the following ValueError: cannot be aligned with join='exact' because index/labels/sizes are not equal along these coordinates (dimensions): 'year' ('year',) The recommendation is to set join explicitly for this case.
big_ds = xr.concat([ds.reset_coords(drop=True) for ds in dsets_aligned_.values()],
Loading...
Calculated Derived Variables
big_ds['imbalance'] = big_ds['rsdt'] - big_ds['rsut'] - big_ds['rlut']

ds_mean = big_ds[['tas', 'imbalance']].sel(experiment_id='piControl').mean(dim='year')
ds_anom = big_ds[['tas', 'imbalance']] - ds_mean

# add some metadata
ds_anom.tas.attrs['long_name'] = 'Global Mean Surface Temp Anom'
ds_anom.tas.attrs['units'] = 'K'
ds_anom.imbalance.attrs['long_name'] = 'Global Mean Radiative Imbalance'
ds_anom.imbalance.attrs['units'] = 'W m$^{-2}$'

ds_anom
Loading...
# limit to the gregory 150-year period
first_150_years = slice(0, 149)
ds_anom.tas.sel(year=first_150_years).plot.line(col='source_id', x='year', col_wrap=5)
<xarray.plot.facetgrid.FacetGrid at 0x14c66105fc90>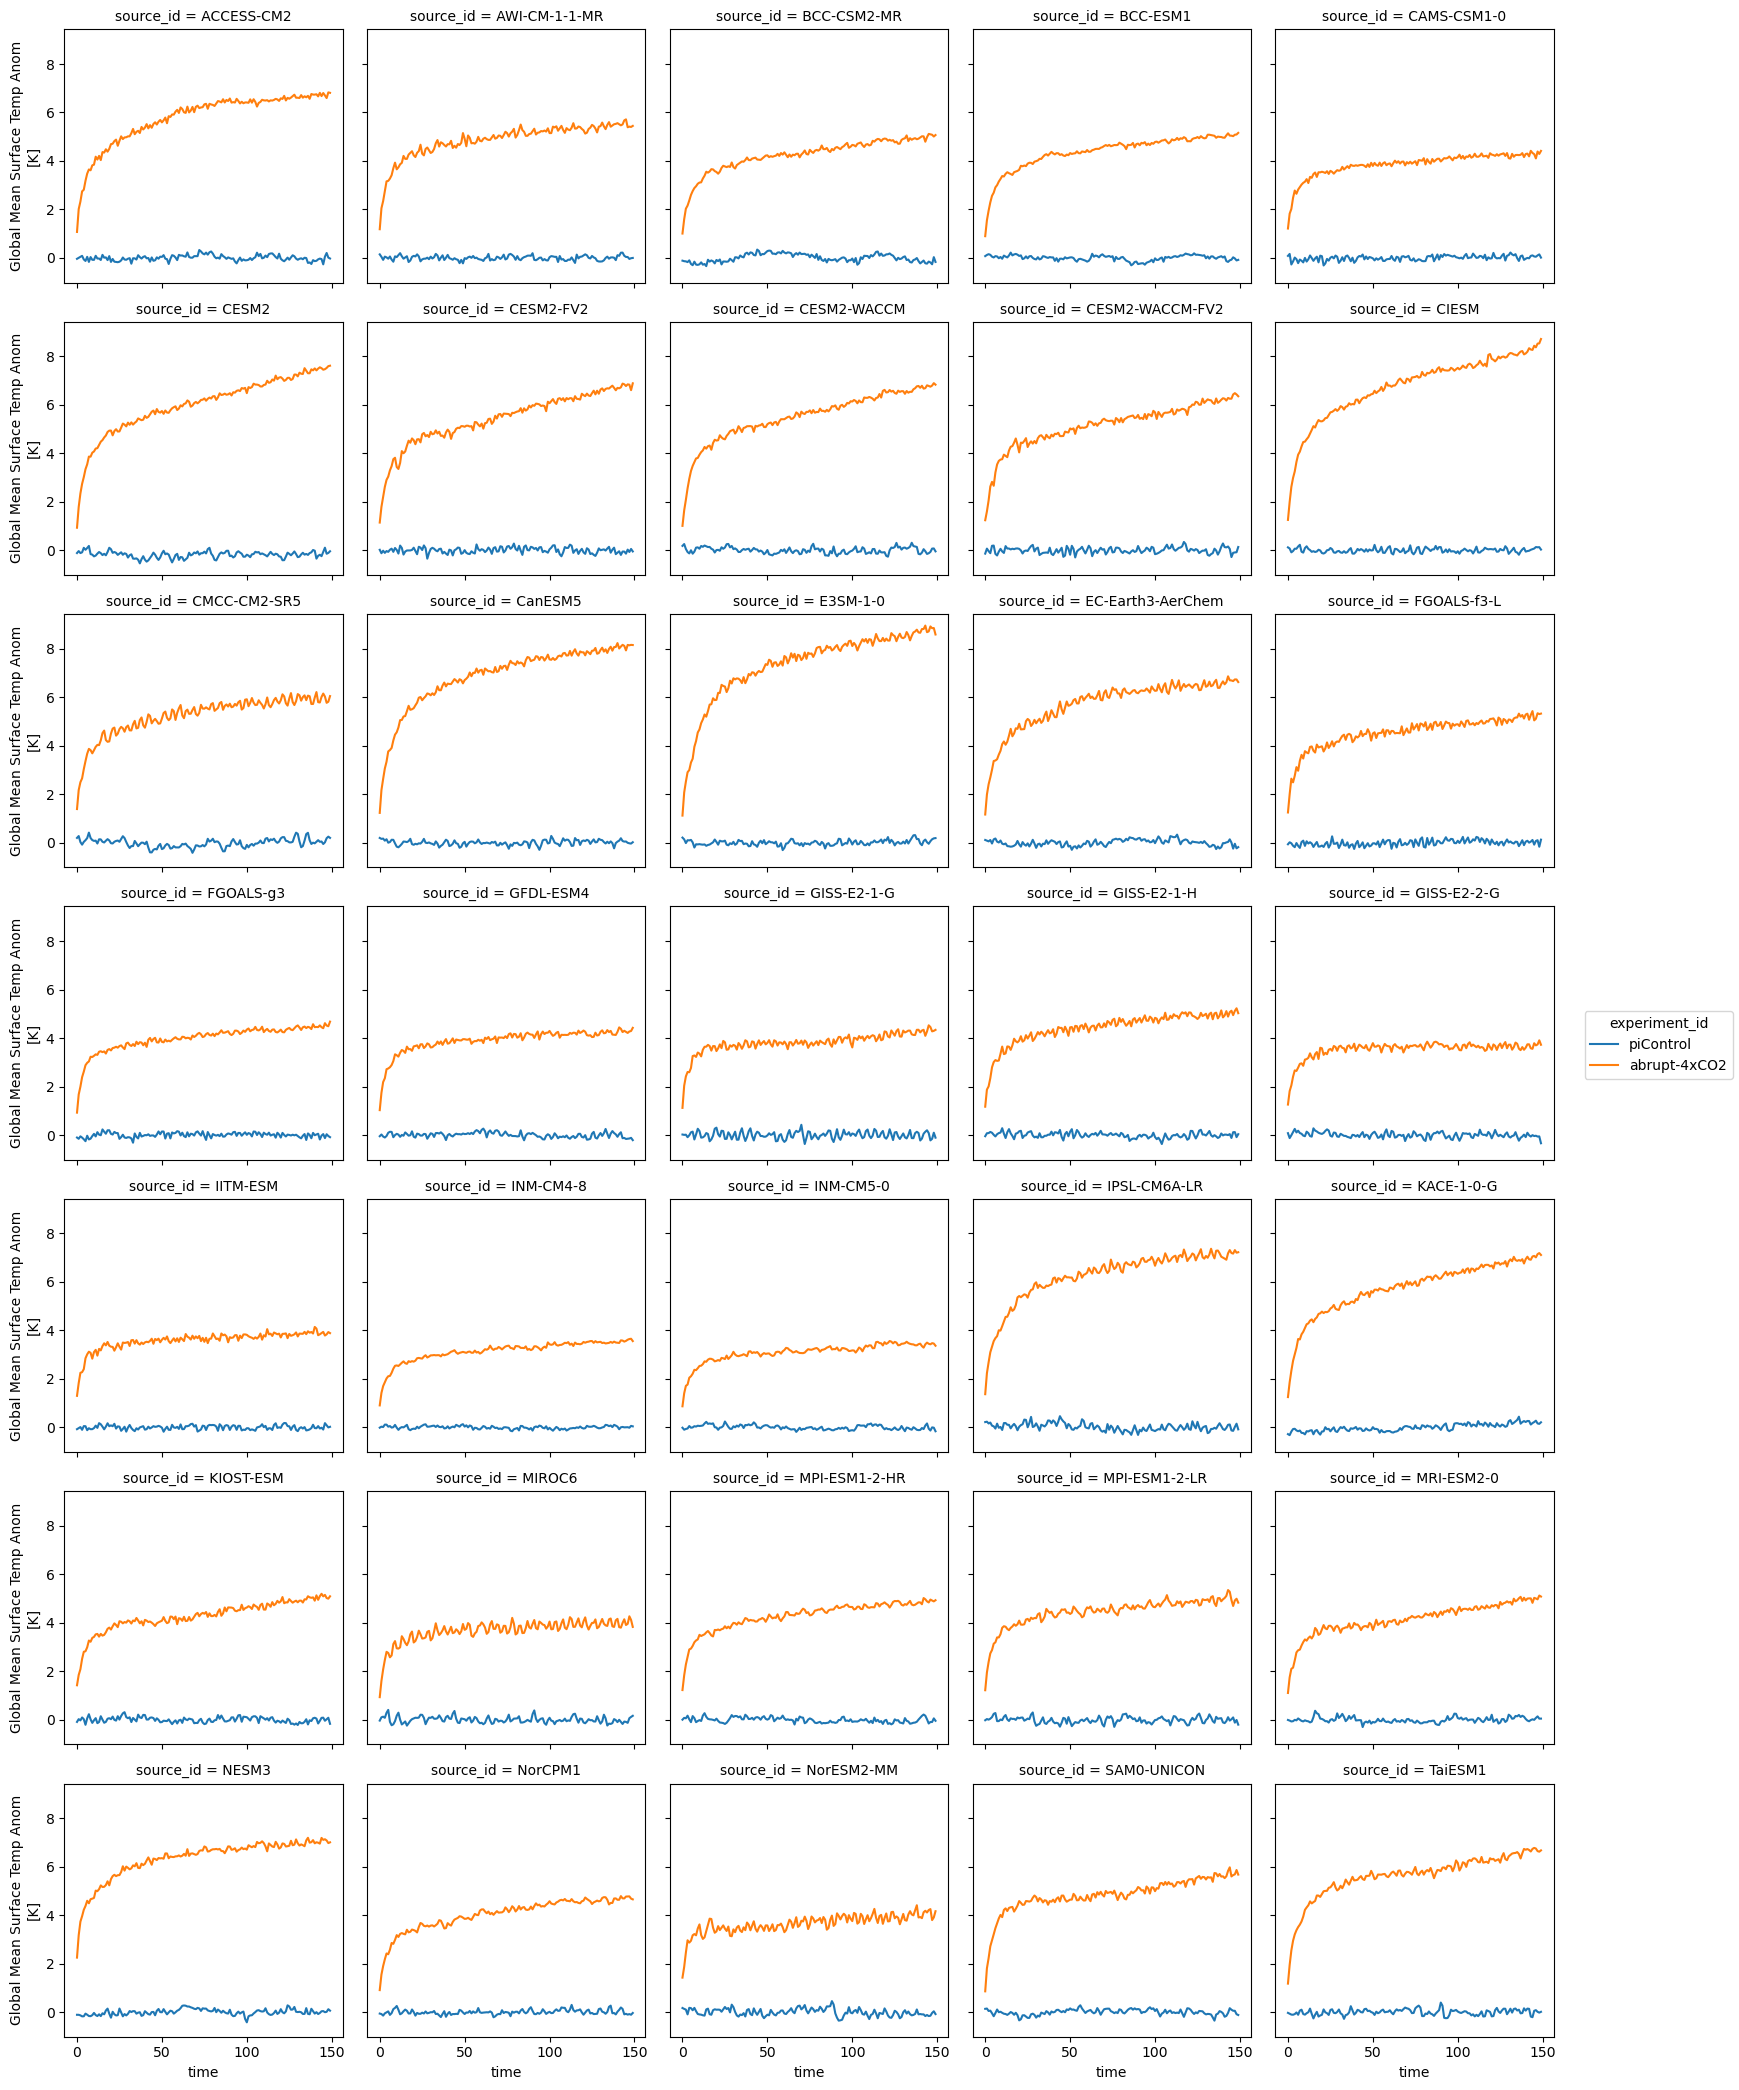
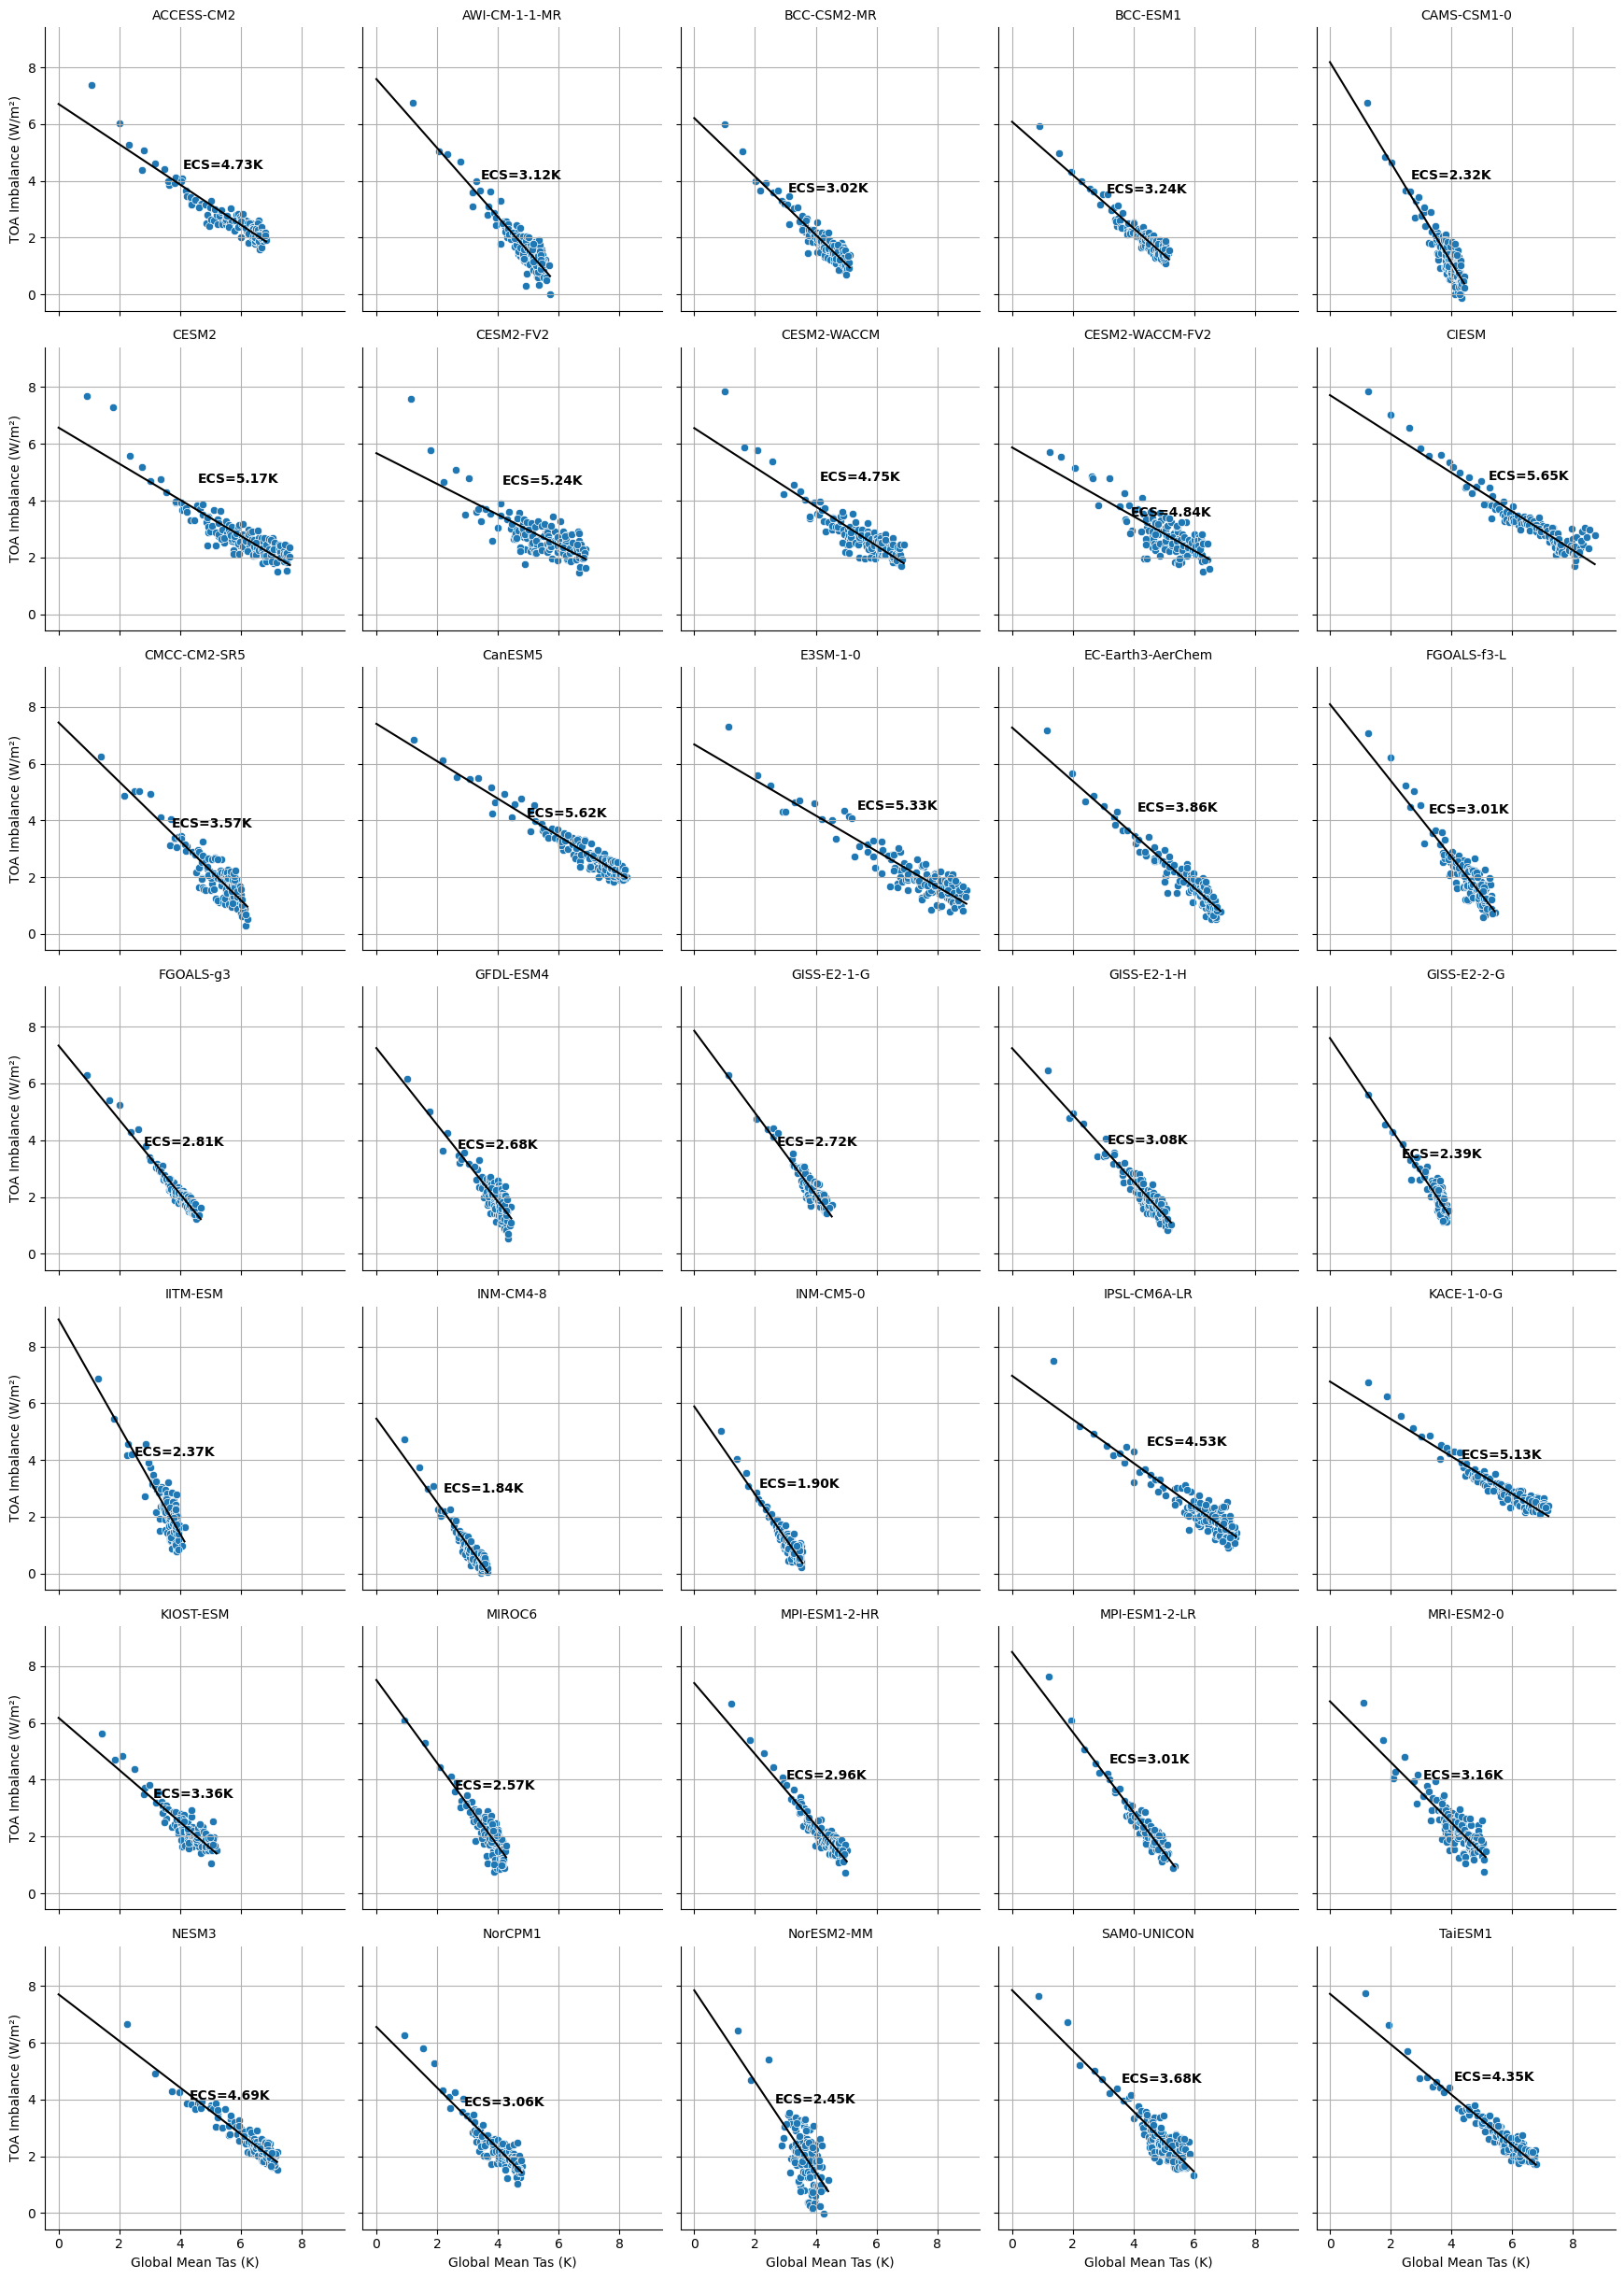
Calculate ECS
ds_abrupt = ds_anom.sel(year=first_150_years, experiment_id='abrupt-4xCO2').reset_coords(drop=True)def calc_ecs(ds):
tas_1d = ds.tas.squeeze()
imbalance_1d = ds.imbalance.squeeze()
# Align and drop NaNs
tas_1d, imbalance_1d = xr.align(tas_1d.dropna('year'), imbalance_1d.dropna('year'), join='inner')
a, b = np.polyfit(tas_1d.values, imbalance_1d.values, 1)
ecs = -0.5 * (b / a)
return xr.DataArray(ecs, attrs={'units': 'K'})ds_abrupt['ecs'] = ds_abrupt.groupby('source_id').apply(calc_ecs)
ds_abruptLoading...
%%time
# Convert to DataFrame
df = ds_abrupt.to_dataframe().reset_index()

# Drop NaNs
df = df.dropna(subset=['tas', 'imbalance'])

# Set up FacetGrid
g = sns.FacetGrid(df, col="source_id", col_wrap=5, height=3.5)
g.map_dataframe(sns.scatterplot, x="tas", y="imbalance")

# Add Gregory fit line and ECS text
def plot_ecs(data, color, **kwargs):
    x = data['tas'].values
    y = data['imbalance'].values
    mask = ~np.isnan(x) & ~np.isnan(y)
    x, y = x[mask], y[mask]

    if len(x) < 2:
        return  # skip underpopulated panels

    a, b = np.polyfit(x, y, 1)
    ecs = -0.5 * b / a

    x_line = np.array([0, x.max()])
    y_line = np.polyval([a, b], x_line)

    plt.plot(x_line, y_line, 'k')
    plt.text(0.6 * x.max(), 0.6 * y.max(), f'ECS={ecs:2.2f}K', fontsize=10, weight='bold')
    plt.grid(True)

g.map_dataframe(plot_ecs)

# Optional: adjust layout
g.set_titles("{col_name}")
g.set_axis_labels("Global Mean Tas (K)", "TOA Imbalance (W/m²)")
plt.tight_layout()
plt.show()
CPU times: user 6.25 s, sys: 144 ms, total: 6.39 s
Wall time: 6.34 s
# fg = ds_abrupt.plot.scatter(x='tas', y='imbalance', col='source_id', col_wrap=5)

# def calc_and_plot_ecs(x, y, **kwargs):
#     x = x[~np.isnan(x)]
#     y = y[~np.isnan(y)]
#     a, b = np.polyfit(x, y, 1)
#     ecs = -0.5 * b/a
#     plt.autoscale(False)
#     plt.plot([0, 10], np.polyval([a, b], [0, 10]), 'k')
#     plt.text(4, 6, f'ECS = {ecs:3.2f}', fontdict={'weight': 'bold', 'size': 12})
#     plt.grid()

# fg.map(calc_and_plot_ecs, 'tas', 'imbalance')
cluster.close()