Visualization#
Example Datasets: Zhu, F. & Zhu, J. Long simulations of the Miocene Climatic Optimum, DOI: 10.5065/3QFN-GN70 (2025). https://rda.ucar.edu/datasets/d010026/.
[1]:
%load_ext autoreload
%autoreload 2

import os
import numpy as np
os.chdir('/glade/u/home/fengzhu/Github/x4c/docsrc/notebooks')
import x4c
print(x4c.__version__)
2025.6.22
Loading a netCDF file as an xarray.Dataset#
The x4c.load_dataset() function is an enhanced version of xarray.load_dataset() for CESM output. The users may specify the component (comp) and grid (grid) information while loading the file.
[ ]:
dirpath = '/glade/campaign/cesm/community/palwg/MCO_LongSims/b.e13.B1850C5.ne16_g16.icesm131_d18O_fixer.Miocene.3xCO2.005'
fname = 'b.e13.B1850C5.ne16_g16.icesm131_d18O_fixer.Miocene.3xCO2.005.cam.h0.TS.895101-900012.nc'
ds = x4c.load_dataset(
    os.path.join(dirpath, 'atm/proc/tseries/month_1', fname),
    comp='atm',
    grid='ne16np4',
)
ds
<xarray.Dataset> Size: 34MB
Dimensions:       (lev: 30, ilev: 31, ncol: 13826, time: 600, nbnd: 2)
Coordinates:
  * lev           (lev) float64 240B 3.643 7.595 14.36 ... 957.5 976.3 992.6
  * ilev          (ilev) float64 248B 2.255 5.032 10.16 ... 967.5 985.1 1e+03
  * time          (time) object 5kB 8951-02-01 00:00:00 ... 9001-01-01 00:00:00
Dimensions without coordinates: ncol, nbnd
Data variables: (12/31)
    hyam          (lev) float64 240B 0.003643 0.007595 0.01436 ... 0.001989 0.0
    hybm          (lev) float64 240B 0.0 0.0 0.0 0.0 ... 0.9512 0.9743 0.9926
    P0            float64 8B 1e+05
    hyai          (ilev) float64 248B 0.002255 0.005032 0.01016 ... 0.0 0.0
    hybi          (ilev) float64 248B 0.0 0.0 0.0 0.0 ... 0.9636 0.9851 1.0
    lat           (ncol) float64 111kB -35.26 -35.98 -37.07 ... 37.91 36.74
    ...            ...
    n2ovmr        (time) float64 5kB 2.757e-07 2.757e-07 ... 2.757e-07 2.757e-07
    f11vmr        (time) float64 5kB 0.0 0.0 0.0 0.0 0.0 ... 0.0 0.0 0.0 0.0 0.0
    f12vmr        (time) float64 5kB 0.0 0.0 0.0 0.0 0.0 ... 0.0 0.0 0.0 0.0 0.0
    sol_tsi       (time) float64 5kB -1.0 -1.0 -1.0 -1.0 ... -1.0 -1.0 -1.0 -1.0
    nsteph        (time) int32 2kB 156805488 156806832 ... 157678512 157680000
    TS            (time, ncol) float32 33MB 303.9 303.3 302.5 ... 292.6 293.3
Attributes: (12/18)
    np:               4
    ne:               16
    Conventions:      CF-1.0
    source:           CAM
    case:             b.e13.B1850C5.ne16_g16.icesm131_d18O_fixer.Miocene.3xCO...
    title:            UNSET
    ...               ...
    path:             /glade/campaign/cesm/community/palwg/MCO_LongSims/b.e13...
    comp:             atm
    grid:             ne16np4
    gw:               <xarray.DataArray 'area' (ncol: 13826)> Size: 111kB\nar...
    lat:              <xarray.DataArray 'lat' (ncol: 13826)> Size: 111kB\narr...
    lon:              <xarray.DataArray 'lon' (ncol: 13826)> Size: 111kB\narr...
xarray.Dataset
- lev: 30
- ilev: 31
- ncol: 13826
- time: 600
- nbnd: 2
- lev(lev)float643.643 7.595 14.36 ... 976.3 992.6
- long_name :
- hybrid level at midpoints (1000*(A+B))
- units :
- hPa
- positive :
- down
- standard_name :
- atmosphere_hybrid_sigma_pressure_coordinate
- formula_terms :
- a: hyam b: hybm p0: P0 ps: PS
array([ 3.643466, 7.59482 , 14.356632, 24.61222 , 38.2683 , 54.59548 , 72.012451, 87.82123 , 103.317127, 121.547241, 142.994039, 168.22508 , 197.908087, 232.828619, 273.910817, 322.241902, 379.100904, 445.992574, 524.687175, 609.778695, 691.38943 , 763.404481, 820.858369, 859.534767, 887.020249, 912.644547, 936.198398, 957.48548 , 976.325407, 992.556095]) - ilev(ilev)float642.255 5.032 10.16 ... 985.1 1e+03
- long_name :
- hybrid level at interfaces (1000*(A+B))
- units :
- hPa
- positive :
- down
- standard_name :
- atmosphere_hybrid_sigma_pressure_coordinate
- formula_terms :
- a: hyai b: hybi p0: P0 ps: PS
array([ 2.25524 , 5.031692, 10.157947, 18.555317, 30.669123, 45.867477, 63.323483, 80.701418, 94.941042, 111.693211, 131.401271, 154.586807, 181.863353, 213.952821, 251.704417, 296.117216, 348.366588, 409.835219, 482.149929, 567.224421, 652.332969, 730.445892, 796.363071, 845.353667, 873.715866, 900.324631, 924.964462, 947.432335, 967.538625, 985.11219 , 1000. ]) - time(time)object8951-02-01 00:00:00 ... 9001-01-...
- long_name :
- time
- bounds :
- time_bnds
array([cftime.DatetimeNoLeap(8951, 2, 1, 0, 0, 0, 0, has_year_zero=True),
       cftime.DatetimeNoLeap(8951, 3, 1, 0, 0, 0, 0, has_year_zero=True),
       cftime.DatetimeNoLeap(8951, 4, 1, 0, 0, 0, 0, has_year_zero=True), ...,
       cftime.DatetimeNoLeap(9000, 11, 1, 0, 0, 0, 0, has_year_zero=True),
       cftime.DatetimeNoLeap(9000, 12, 1, 0, 0, 0, 0, has_year_zero=True),
       cftime.DatetimeNoLeap(9001, 1, 1, 0, 0, 0, 0, has_year_zero=True)],
      shape=(600,), dtype=object)
- hyam(lev)float640.003643 0.007595 ... 0.001989 0.0
- long_name :
- hybrid A coefficient at layer midpoints
array([0.00364347, 0.00759482, 0.01435663, 0.02461222, 0.0382683 , 0.05459548, 0.07201245, 0.08782123, 0.10331713, 0.12154724, 0.14299404, 0.16822508, 0.17823067, 0.17032433, 0.16102291, 0.15008029, 0.13720686, 0.12206194, 0.10424471, 0.08497915, 0.0665017 , 0.05019679, 0.03718866, 0.02843195, 0.02220898, 0.01640738, 0.01107456, 0.00625495, 0.00198941, 0. ]) - hybm(lev)float640.0 0.0 0.0 ... 0.9743 0.9926
- long_name :
- hybrid B coefficient at layer midpoints
array([0. , 0. , 0. , 0. , 0. , 0. , 0. , 0. , 0. , 0. , 0. , 0. , 0.01967741, 0.06250429, 0.11288791, 0.17216162, 0.24189404, 0.32393064, 0.42044246, 0.52479954, 0.62488773, 0.71320769, 0.78366971, 0.83110282, 0.86481127, 0.89623716, 0.92512384, 0.95123053, 0.974336 , 0.9925561 ]) - P0()float641e+05
- long_name :
- reference pressure
- units :
- Pa
array(100000.)
- hyai(ilev)float640.002255 0.005032 ... 0.0 0.0
- long_name :
- hybrid A coefficient at layer interfaces
array([0.00225524, 0.00503169, 0.01015795, 0.01855532, 0.03066912, 0.04586748, 0.06332348, 0.08070142, 0.09494104, 0.11169321, 0.13140127, 0.15458681, 0.18186335, 0.17459799, 0.16605066, 0.15599516, 0.14416541, 0.13024831, 0.11387557, 0.09461386, 0.07534445, 0.05765894, 0.04273464, 0.03164268, 0.02522122, 0.01919674, 0.01361803, 0.00853109, 0.00397882, 0. , 0. ]) - hybi(ilev)float640.0 0.0 0.0 ... 0.9636 0.9851 1.0
- long_name :
- hybrid B coefficient at layer interfaces
array([0. , 0. , 0. , 0. , 0. , 0. , 0. , 0. , 0. , 0. , 0. , 0. , 0. , 0.03935483, 0.08565376, 0.14012206, 0.20420118, 0.27958691, 0.36827436, 0.47261056, 0.57698852, 0.67278695, 0.75362843, 0.81371099, 0.84849465, 0.88112789, 0.91134644, 0.93890125, 0.96355981, 0.98511219, 1. ]) - lat(ncol)float64-35.26 -35.98 ... 37.91 36.74
- long_name :
- latitude
- units :
- degrees_north
array([-35.26438968, -35.98082588, -37.07155175, ..., 37.90897632, 37.90897632, 36.74360278], shape=(13826,)) - area(ncol)float640.0001546 0.000515 ... 0.001289
array([0.00015457, 0.00051501, 0.00051372, ..., 0.00128989, 0.00128989, 0.00128935], shape=(13826,)) - lon(ncol)float64315.0 316.6 319.1 ... 137.5 135.0
- long_name :
- longitude
- units :
- degrees_east
array([315. , 316.55471176, 319.07028824, ..., 132.47470023, 137.52529977, 135. ], shape=(13826,)) - ntrm()int321
- long_name :
- spectral truncation parameter M
array(1, dtype=int32)
- ntrn()int321
- long_name :
- spectral truncation parameter N
array(1, dtype=int32)
- ntrk()int321
- long_name :
- spectral truncation parameter K
array(1, dtype=int32)
- ndbase()int320
- long_name :
- base day
array(0, dtype=int32)
- nsbase()int320
- long_name :
- seconds of base day
array(0, dtype=int32)
- nbdate()int3210101
- long_name :
- base date (YYYYMMDD)
array(10101, dtype=int32)
- nbsec()int320
- long_name :
- seconds of base date
array(0, dtype=int32)
- mdt()int321800
- long_name :
- timestep
- units :
- s
array(1800, dtype=int32)
- date(time)int3289510201 89510301 ... 90010101
- long_name :
- current date (YYYYMMDD)
array([89510201, 89510301, 89510401, 89510501, 89510601, 89510701, 89510801, 89510901, 89511001, 89511101, 89511201, 89520101, 89520201, 89520301, 89520401, 89520501, 89520601, 89520701, 89520801, 89520901, 89521001, 89521101, 89521201, 89530101, 89530201, 89530301, 89530401, 89530501, 89530601, 89530701, 89530801, 89530901, 89531001, 89531101, 89531201, 89540101, 89540201, 89540301, 89540401, 89540501, 89540601, 89540701, 89540801, 89540901, 89541001, 89541101, 89541201, 89550101, 89550201, 89550301, 89550401, 89550501, 89550601, 89550701, 89550801, 89550901, 89551001, 89551101, 89551201, 89560101, 89560201, 89560301, 89560401, 89560501, 89560601, 89560701, 89560801, 89560901, 89561001, 89561101, 89561201, 89570101, 89570201, 89570301, 89570401, 89570501, 89570601, 89570701, 89570801, 89570901, 89571001, 89571101, 89571201, 89580101, 89580201, 89580301, 89580401, 89580501, 89580601, 89580701, 89580801, 89580901, 89581001, 89581101, 89581201, 89590101, 89590201, 89590301, 89590401, 89590501, 89590601, 89590701, 89590801, 89590901, 89591001, 89591101, 89591201, 89600101, 89600201, 89600301, 89600401, 89600501, 89600601, 89600701, 89600801, 89600901, 89601001, 89601101, 89601201, 89610101, ... 89910801, 89910901, 89911001, 89911101, 89911201, 89920101, 89920201, 89920301, 89920401, 89920501, 89920601, 89920701, 89920801, 89920901, 89921001, 89921101, 89921201, 89930101, 89930201, 89930301, 89930401, 89930501, 89930601, 89930701, 89930801, 89930901, 89931001, 89931101, 89931201, 89940101, 89940201, 89940301, 89940401, 89940501, 89940601, 89940701, 89940801, 89940901, 89941001, 89941101, 89941201, 89950101, 89950201, 89950301, 89950401, 89950501, 89950601, 89950701, 89950801, 89950901, 89951001, 89951101, 89951201, 89960101, 89960201, 89960301, 89960401, 89960501, 89960601, 89960701, 89960801, 89960901, 89961001, 89961101, 89961201, 89970101, 89970201, 89970301, 89970401, 89970501, 89970601, 89970701, 89970801, 89970901, 89971001, 89971101, 89971201, 89980101, 89980201, 89980301, 89980401, 89980501, 89980601, 89980701, 89980801, 89980901, 89981001, 89981101, 89981201, 89990101, 89990201, 89990301, 89990401, 89990501, 89990601, 89990701, 89990801, 89990901, 89991001, 89991101, 89991201, 90000101, 90000201, 90000301, 90000401, 90000501, 90000601, 90000701, 90000801, 90000901, 90001001, 90001101, 90001201, 90010101], dtype=int32) - datesec(time)int320 0 0 0 0 0 0 0 ... 0 0 0 0 0 0 0 0
- long_name :
- current seconds of current date
array([0, 0, 0, 0, 0, 0, 0, 0, 0, 0, 0, 0, 0, 0, 0, 0, 0, 0, 0, 0, 0, 0, 0, 0, 0, 0, 0, 0, 0, 0, 0, 0, 0, 0, 0, 0, 0, 0, 0, 0, 0, 0, 0, 0, 0, 0, 0, 0, 0, 0, 0, 0, 0, 0, 0, 0, 0, 0, 0, 0, 0, 0, 0, 0, 0, 0, 0, 0, 0, 0, 0, 0, 0, 0, 0, 0, 0, 0, 0, 0, 0, 0, 0, 0, 0, 0, 0, 0, 0, 0, 0, 0, 0, 0, 0, 0, 0, 0, 0, 0, 0, 0, 0, 0, 0, 0, 0, 0, 0, 0, 0, 0, 0, 0, 0, 0, 0, 0, 0, 0, 0, 0, 0, 0, 0, 0, 0, 0, 0, 0, 0, 0, 0, 0, 0, 0, 0, 0, 0, 0, 0, 0, 0, 0, 0, 0, 0, 0, 0, 0, 0, 0, 0, 0, 0, 0, 0, 0, 0, 0, 0, 0, 0, 0, 0, 0, 0, 0, 0, 0, 0, 0, 0, 0, 0, 0, 0, 0, 0, 0, 0, 0, 0, 0, 0, 0, 0, 0, 0, 0, 0, 0, 0, 0, 0, 0, 0, 0, 0, 0, 0, 0, 0, 0, 0, 0, 0, 0, 0, 0, 0, 0, 0, 0, 0, 0, 0, 0, 0, 0, 0, 0, 0, 0, 0, 0, 0, 0, 0, 0, 0, 0, 0, 0, 0, 0, 0, 0, 0, 0, 0, 0, 0, 0, 0, 0, 0, 0, 0, 0, 0, 0, 0, 0, 0, 0, 0, 0, 0, 0, 0, 0, 0, 0, 0, 0, 0, 0, 0, 0, 0, 0, 0, 0, 0, 0, 0, 0, 0, 0, 0, 0, 0, 0, 0, 0, 0, 0, 0, 0, 0, 0, 0, 0, 0, 0, 0, 0, 0, 0, 0, 0, 0, 0, 0, 0, 0, 0, 0, 0, 0, 0, 0, 0, 0, 0, 0, 0, 0, 0, 0, 0, 0, 0, 0, 0, 0, 0, 0, 0, 0, 0, 0, 0, 0, 0, 0, 0, 0, 0, 0, 0, 0, 0, 0, 0, 0, 0, 0, 0, 0, 0, 0, 0, 0, 0, 0, 0, 0, 0, 0, 0, 0, 0, 0, 0, 0, 0, 0, 0, 0, 0, 0, 0, 0, 0, 0, 0, 0, 0, 0, 0, 0, 0, 0, 0, 0, 0, 0, 0, 0, 0, 0, 0, 0, 0, 0, 0, 0, 0, 0, 0, 0, 0, 0, 0, 0, 0, 0, 0, 0, 0, 0, 0, 0, 0, 0, 0, 0, 0, 0, 0, 0, 0, 0, 0, 0, 0, 0, 0, 0, 0, 0, 0, 0, 0, 0, 0, 0, 0, 0, 0, 0, 0, 0, 0, 0, 0, 0, 0, 0, 0, 0, 0, 0, 0, 0, 0, 0, 0, 0, 0, 0, 0, 0, 0, 0, 0, 0, 0, 0, 0, 0, 0, 0, 0, 0, 0, 0, 0, 0, 0, 0, 0, 0, 0, 0, 0, 0, 0, 0, 0, 0, 0, 0, 0, 0, 0, 0, 0, 0, 0, 0, 0, 0, 0, 0, 0, 0, 0, 0, 0, 0, 0, 0, 0, 0, 0, 0, 0, 0, 0, 0, 0, 0, 0, 0, 0, 0, 0, 0, 0, 0, 0, 0, 0, 0, 0, 0, 0, 0, 0, 0, 0, 0, 0, 0, 0, 0, 0, 0, 0, 0, 0, 0, 0, 0, 0, 0, 0, 0, 0, 0, 0, 0, 0, 0, 0, 0, 0, 0, 0, 0, 0, 0, 0, 0, 0, 0, 0, 0, 0, 0, 0, 0, 0, 0, 0, 0, 0, 0, 0, 0, 0, 0, 0, 0, 0, 0, 0], dtype=int32) - time_bnds(time, nbnd)object8951-01-01 00:00:00 ... 9001-01-...
- long_name :
- time interval endpoints
array([[cftime.DatetimeNoLeap(8951, 1, 1, 0, 0, 0, 0, has_year_zero=True), cftime.DatetimeNoLeap(8951, 2, 1, 0, 0, 0, 0, has_year_zero=True)], [cftime.DatetimeNoLeap(8951, 2, 1, 0, 0, 0, 0, has_year_zero=True), cftime.DatetimeNoLeap(8951, 3, 1, 0, 0, 0, 0, has_year_zero=True)], [cftime.DatetimeNoLeap(8951, 3, 1, 0, 0, 0, 0, has_year_zero=True), cftime.DatetimeNoLeap(8951, 4, 1, 0, 0, 0, 0, has_year_zero=True)], ..., [cftime.DatetimeNoLeap(9000, 10, 1, 0, 0, 0, 0, has_year_zero=True), cftime.DatetimeNoLeap(9000, 11, 1, 0, 0, 0, 0, has_year_zero=True)], [cftime.DatetimeNoLeap(9000, 11, 1, 0, 0, 0, 0, has_year_zero=True), cftime.DatetimeNoLeap(9000, 12, 1, 0, 0, 0, 0, has_year_zero=True)], [cftime.DatetimeNoLeap(9000, 12, 1, 0, 0, 0, 0, has_year_zero=True), cftime.DatetimeNoLeap(9001, 1, 1, 0, 0, 0, 0, has_year_zero=True)]], shape=(600, 2), dtype=object) - date_written(time)|S8b'05/26/24' ... b'05/27/24'
array([b'05/26/24', b'05/26/24', b'05/26/24', b'05/26/24', b'05/26/24', b'05/26/24', b'05/26/24', b'05/26/24', b'05/26/24', b'05/26/24', b'05/26/24', b'05/26/24', b'05/26/24', b'05/26/24', b'05/26/24', b'05/26/24', b'05/26/24', b'05/26/24', b'05/26/24', b'05/26/24', b'05/26/24', b'05/26/24', b'05/26/24', b'05/26/24', b'05/26/24', b'05/26/24', b'05/26/24', b'05/26/24', b'05/26/24', b'05/26/24', b'05/26/24', b'05/26/24', b'05/26/24', b'05/26/24', b'05/26/24', b'05/26/24', b'05/26/24', b'05/26/24', b'05/26/24', b'05/26/24', b'05/26/24', b'05/26/24', b'05/26/24', b'05/26/24', b'05/26/24', b'05/26/24', b'05/26/24', b'05/26/24', b'05/26/24', b'05/26/24', b'05/26/24', b'05/26/24', b'05/26/24', b'05/26/24', b'05/26/24', b'05/26/24', b'05/26/24', b'05/26/24', b'05/26/24', b'05/26/24', b'05/26/24', b'05/26/24', b'05/26/24', b'05/26/24', b'05/26/24', b'05/26/24', b'05/26/24', b'05/26/24', b'05/26/24', b'05/26/24', b'05/26/24', b'05/26/24', b'05/26/24', b'05/26/24', b'05/26/24', b'05/26/24', b'05/26/24', b'05/26/24', b'05/26/24', b'05/26/24', b'05/26/24', b'05/26/24', b'05/26/24', b'05/26/24', b'05/26/24', b'05/26/24', b'05/26/24', b'05/26/24', b'05/26/24', b'05/26/24', b'05/26/24', b'05/26/24', b'05/26/24', b'05/26/24', b'05/26/24', b'05/26/24', b'05/26/24', b'05/26/24', b'05/26/24', b'05/26/24', ... b'05/27/24', b'05/27/24', b'05/27/24', b'05/27/24', b'05/27/24', b'05/27/24', b'05/27/24', b'05/27/24', b'05/27/24', b'05/27/24', b'05/27/24', b'05/27/24', b'05/27/24', b'05/27/24', b'05/27/24', b'05/27/24', b'05/27/24', b'05/27/24', b'05/27/24', b'05/27/24', b'05/27/24', b'05/27/24', b'05/27/24', b'05/27/24', b'05/27/24', b'05/27/24', b'05/27/24', b'05/27/24', b'05/27/24', b'05/27/24', b'05/27/24', b'05/27/24', b'05/27/24', b'05/27/24', b'05/27/24', b'05/27/24', b'05/27/24', b'05/27/24', b'05/27/24', b'05/27/24', b'05/27/24', b'05/27/24', b'05/27/24', b'05/27/24', b'05/27/24', b'05/27/24', b'05/27/24', b'05/27/24', b'05/27/24', b'05/27/24', b'05/27/24', b'05/27/24', b'05/27/24', b'05/27/24', b'05/27/24', b'05/27/24', b'05/27/24', b'05/27/24', b'05/27/24', b'05/27/24', b'05/27/24', b'05/27/24', b'05/27/24', b'05/27/24', b'05/27/24', b'05/27/24', b'05/27/24', b'05/27/24', b'05/27/24', b'05/27/24', b'05/27/24', b'05/27/24', b'05/27/24', b'05/27/24', b'05/27/24', b'05/27/24', b'05/27/24', b'05/27/24', b'05/27/24', b'05/27/24', b'05/27/24', b'05/27/24', b'05/27/24', b'05/27/24', b'05/27/24', b'05/27/24', b'05/27/24', b'05/27/24', b'05/27/24', b'05/27/24', b'05/27/24', b'05/27/24', b'05/27/24', b'05/27/24', b'05/27/24'], dtype='|S8') - time_written(time)|S8b'18:23:37' ... b'09:50:24'
array([b'18:23:37', b'18:25:00', b'18:26:32', b'18:28:01', b'18:29:32', b'18:31:02', b'18:32:32', b'18:34:03', b'18:35:31', b'18:37:03', b'18:38:31', b'18:40:03', b'18:41:35', b'18:42:57', b'18:44:29', b'18:45:58', b'18:47:29', b'18:48:57', b'18:50:29', b'18:52:00', b'18:53:28', b'18:54:59', b'18:56:28', b'18:57:59', b'18:59:31', b'19:00:54', b'19:02:25', b'19:03:54', b'19:05:27', b'19:06:55', b'19:08:27', b'19:09:58', b'19:11:26', b'19:12:58', b'19:14:26', b'19:15:57', b'19:17:28', b'19:18:51', b'19:20:22', b'19:21:50', b'19:23:22', b'19:24:50', b'19:26:21', b'19:27:53', b'19:29:21', b'19:30:52', b'19:32:20', b'19:33:53', b'19:35:24', b'19:36:47', b'19:38:20', b'19:39:48', b'19:41:20', b'19:42:48', b'19:44:19', b'19:45:50', b'19:47:19', b'19:48:50', b'19:50:19', b'19:51:50', b'19:53:22', b'19:54:45', b'19:56:16', b'19:57:44', b'19:59:15', b'20:00:44', b'20:02:15', b'20:03:46', b'20:05:15', b'20:06:47', b'20:08:15', b'20:09:47', b'20:11:18', b'20:12:40', b'20:14:12', b'20:15:40', b'20:17:12', b'20:18:40', b'20:20:12', b'20:21:43', b'20:23:12', b'20:24:43', b'20:26:12', b'20:27:43', b'20:29:14', b'20:30:37', b'20:32:08', b'20:33:36', b'20:35:08', b'20:36:37', b'20:38:08', b'20:39:39', b'20:41:08', b'20:42:40', b'20:44:09', b'20:45:40', b'20:47:11', b'20:48:34', b'20:50:06', b'20:51:34', ... b'07:28:35', b'07:30:07', b'07:31:38', b'07:33:10', b'07:34:39', b'07:36:11', b'07:37:42', b'07:39:11', b'07:40:45', b'07:42:16', b'07:43:48', b'07:45:19', b'07:46:43', b'07:48:15', b'07:49:44', b'07:51:16', b'07:52:45', b'07:54:17', b'07:55:48', b'07:57:17', b'07:58:49', b'08:00:18', b'08:01:50', b'08:03:22', b'08:04:45', b'08:06:17', b'08:07:48', b'08:09:21', b'08:10:49', b'08:12:21', b'08:13:53', b'08:15:22', b'08:16:54', b'08:18:23', b'08:19:55', b'08:21:27', b'08:22:50', b'08:24:22', b'08:25:52', b'08:27:24', b'08:28:53', b'08:30:25', b'08:31:57', b'08:33:26', b'08:34:58', b'08:36:26', b'08:37:58', b'08:39:30', b'08:40:53', b'08:42:26', b'08:43:55', b'08:45:27', b'08:46:56', b'08:48:28', b'08:50:00', b'08:51:29', b'08:53:02', b'08:54:31', b'08:56:02', b'08:57:35', b'08:58:58', b'09:00:30', b'09:01:59', b'09:03:31', b'09:05:00', b'09:06:32', b'09:08:03', b'09:09:32', b'09:11:04', b'09:12:36', b'09:14:09', b'09:15:41', b'09:17:05', b'09:18:37', b'09:20:06', b'09:21:38', b'09:23:09', b'09:24:41', b'09:26:14', b'09:27:44', b'09:29:16', b'09:30:46', b'09:32:18', b'09:33:50', b'09:35:14', b'09:36:46', b'09:38:15', b'09:39:48', b'09:41:17', b'09:42:49', b'09:44:21', b'09:45:51', b'09:47:23', b'09:48:52', b'09:50:24'], dtype='|S8') - ndcur(time)int323266781 3266809 ... 3284969 3285000
- long_name :
- current day (from base day)
array([3266781, 3266809, 3266840, 3266870, 3266901, 3266931, 3266962, 3266993, 3267023, 3267054, 3267084, 3267115, 3267146, 3267174, 3267205, 3267235, 3267266, 3267296, 3267327, 3267358, 3267388, 3267419, 3267449, 3267480, 3267511, 3267539, 3267570, 3267600, 3267631, 3267661, 3267692, 3267723, 3267753, 3267784, 3267814, 3267845, 3267876, 3267904, 3267935, 3267965, 3267996, 3268026, 3268057, 3268088, 3268118, 3268149, 3268179, 3268210, 3268241, 3268269, 3268300, 3268330, 3268361, 3268391, 3268422, 3268453, 3268483, 3268514, 3268544, 3268575, 3268606, 3268634, 3268665, 3268695, 3268726, 3268756, 3268787, 3268818, 3268848, 3268879, 3268909, 3268940, 3268971, 3268999, 3269030, 3269060, 3269091, 3269121, 3269152, 3269183, 3269213, 3269244, 3269274, 3269305, 3269336, 3269364, 3269395, 3269425, 3269456, 3269486, 3269517, 3269548, 3269578, 3269609, 3269639, 3269670, 3269701, 3269729, 3269760, 3269790, 3269821, 3269851, 3269882, 3269913, 3269943, 3269974, 3270004, 3270035, 3270066, 3270094, 3270125, 3270155, 3270186, 3270216, 3270247, 3270278, 3270308, 3270339, 3270369, 3270400, 3270431, 3270459, 3270490, 3270520, 3270551, 3270581, 3270612, 3270643, 3270673, 3270704, 3270734, 3270765, 3270796, 3270824, 3270855, 3270885, 3270916, 3270946, 3270977, 3271008, ... 3280832, 3280863, 3280893, 3280924, 3280954, 3280985, 3281016, 3281044, 3281075, 3281105, 3281136, 3281166, 3281197, 3281228, 3281258, 3281289, 3281319, 3281350, 3281381, 3281409, 3281440, 3281470, 3281501, 3281531, 3281562, 3281593, 3281623, 3281654, 3281684, 3281715, 3281746, 3281774, 3281805, 3281835, 3281866, 3281896, 3281927, 3281958, 3281988, 3282019, 3282049, 3282080, 3282111, 3282139, 3282170, 3282200, 3282231, 3282261, 3282292, 3282323, 3282353, 3282384, 3282414, 3282445, 3282476, 3282504, 3282535, 3282565, 3282596, 3282626, 3282657, 3282688, 3282718, 3282749, 3282779, 3282810, 3282841, 3282869, 3282900, 3282930, 3282961, 3282991, 3283022, 3283053, 3283083, 3283114, 3283144, 3283175, 3283206, 3283234, 3283265, 3283295, 3283326, 3283356, 3283387, 3283418, 3283448, 3283479, 3283509, 3283540, 3283571, 3283599, 3283630, 3283660, 3283691, 3283721, 3283752, 3283783, 3283813, 3283844, 3283874, 3283905, 3283936, 3283964, 3283995, 3284025, 3284056, 3284086, 3284117, 3284148, 3284178, 3284209, 3284239, 3284270, 3284301, 3284329, 3284360, 3284390, 3284421, 3284451, 3284482, 3284513, 3284543, 3284574, 3284604, 3284635, 3284666, 3284694, 3284725, 3284755, 3284786, 3284816, 3284847, 3284878, 3284908, 3284939, 3284969, 3285000], dtype=int32) - nscur(time)int320 0 0 0 0 0 0 0 ... 0 0 0 0 0 0 0 0
- long_name :
- current seconds of current day
array([0, 0, 0, 0, 0, 0, 0, 0, 0, 0, 0, 0, 0, 0, 0, 0, 0, 0, 0, 0, 0, 0, 0, 0, 0, 0, 0, 0, 0, 0, 0, 0, 0, 0, 0, 0, 0, 0, 0, 0, 0, 0, 0, 0, 0, 0, 0, 0, 0, 0, 0, 0, 0, 0, 0, 0, 0, 0, 0, 0, 0, 0, 0, 0, 0, 0, 0, 0, 0, 0, 0, 0, 0, 0, 0, 0, 0, 0, 0, 0, 0, 0, 0, 0, 0, 0, 0, 0, 0, 0, 0, 0, 0, 0, 0, 0, 0, 0, 0, 0, 0, 0, 0, 0, 0, 0, 0, 0, 0, 0, 0, 0, 0, 0, 0, 0, 0, 0, 0, 0, 0, 0, 0, 0, 0, 0, 0, 0, 0, 0, 0, 0, 0, 0, 0, 0, 0, 0, 0, 0, 0, 0, 0, 0, 0, 0, 0, 0, 0, 0, 0, 0, 0, 0, 0, 0, 0, 0, 0, 0, 0, 0, 0, 0, 0, 0, 0, 0, 0, 0, 0, 0, 0, 0, 0, 0, 0, 0, 0, 0, 0, 0, 0, 0, 0, 0, 0, 0, 0, 0, 0, 0, 0, 0, 0, 0, 0, 0, 0, 0, 0, 0, 0, 0, 0, 0, 0, 0, 0, 0, 0, 0, 0, 0, 0, 0, 0, 0, 0, 0, 0, 0, 0, 0, 0, 0, 0, 0, 0, 0, 0, 0, 0, 0, 0, 0, 0, 0, 0, 0, 0, 0, 0, 0, 0, 0, 0, 0, 0, 0, 0, 0, 0, 0, 0, 0, 0, 0, 0, 0, 0, 0, 0, 0, 0, 0, 0, 0, 0, 0, 0, 0, 0, 0, 0, 0, 0, 0, 0, 0, 0, 0, 0, 0, 0, 0, 0, 0, 0, 0, 0, 0, 0, 0, 0, 0, 0, 0, 0, 0, 0, 0, 0, 0, 0, 0, 0, 0, 0, 0, 0, 0, 0, 0, 0, 0, 0, 0, 0, 0, 0, 0, 0, 0, 0, 0, 0, 0, 0, 0, 0, 0, 0, 0, 0, 0, 0, 0, 0, 0, 0, 0, 0, 0, 0, 0, 0, 0, 0, 0, 0, 0, 0, 0, 0, 0, 0, 0, 0, 0, 0, 0, 0, 0, 0, 0, 0, 0, 0, 0, 0, 0, 0, 0, 0, 0, 0, 0, 0, 0, 0, 0, 0, 0, 0, 0, 0, 0, 0, 0, 0, 0, 0, 0, 0, 0, 0, 0, 0, 0, 0, 0, 0, 0, 0, 0, 0, 0, 0, 0, 0, 0, 0, 0, 0, 0, 0, 0, 0, 0, 0, 0, 0, 0, 0, 0, 0, 0, 0, 0, 0, 0, 0, 0, 0, 0, 0, 0, 0, 0, 0, 0, 0, 0, 0, 0, 0, 0, 0, 0, 0, 0, 0, 0, 0, 0, 0, 0, 0, 0, 0, 0, 0, 0, 0, 0, 0, 0, 0, 0, 0, 0, 0, 0, 0, 0, 0, 0, 0, 0, 0, 0, 0, 0, 0, 0, 0, 0, 0, 0, 0, 0, 0, 0, 0, 0, 0, 0, 0, 0, 0, 0, 0, 0, 0, 0, 0, 0, 0, 0, 0, 0, 0, 0, 0, 0, 0, 0, 0, 0, 0, 0, 0, 0, 0, 0, 0, 0, 0, 0, 0, 0, 0, 0, 0, 0, 0, 0, 0, 0, 0, 0, 0, 0, 0, 0, 0, 0, 0, 0, 0, 0, 0, 0, 0, 0, 0, 0, 0, 0, 0, 0, 0, 0, 0, 0, 0, 0, 0, 0, 0, 0, 0, 0, 0, 0, 0, 0, 0, 0, 0, 0, 0, 0, 0, 0, 0, 0, 0, 0, 0, 0, 0, 0, 0, 0, 0, 0, 0, 0], dtype=int32) - co2vmr(time)float640.0008541 0.0008541 ... 0.0008541
- long_name :
- co2 volume mixing ratio
array([0.0008541, 0.0008541, 0.0008541, 0.0008541, 0.0008541, 0.0008541, 0.0008541, 0.0008541, 0.0008541, 0.0008541, 0.0008541, 0.0008541, 0.0008541, 0.0008541, 0.0008541, 0.0008541, 0.0008541, 0.0008541, 0.0008541, 0.0008541, 0.0008541, 0.0008541, 0.0008541, 0.0008541, 0.0008541, 0.0008541, 0.0008541, 0.0008541, 0.0008541, 0.0008541, 0.0008541, 0.0008541, 0.0008541, 0.0008541, 0.0008541, 0.0008541, 0.0008541, 0.0008541, 0.0008541, 0.0008541, 0.0008541, 0.0008541, 0.0008541, 0.0008541, 0.0008541, 0.0008541, 0.0008541, 0.0008541, 0.0008541, 0.0008541, 0.0008541, 0.0008541, 0.0008541, 0.0008541, 0.0008541, 0.0008541, 0.0008541, 0.0008541, 0.0008541, 0.0008541, 0.0008541, 0.0008541, 0.0008541, 0.0008541, 0.0008541, 0.0008541, 0.0008541, 0.0008541, 0.0008541, 0.0008541, 0.0008541, 0.0008541, 0.0008541, 0.0008541, 0.0008541, 0.0008541, 0.0008541, 0.0008541, 0.0008541, 0.0008541, 0.0008541, 0.0008541, 0.0008541, 0.0008541, 0.0008541, 0.0008541, 0.0008541, 0.0008541, 0.0008541, 0.0008541, 0.0008541, 0.0008541, 0.0008541, 0.0008541, 0.0008541, 0.0008541, 0.0008541, 0.0008541, 0.0008541, 0.0008541, 0.0008541, 0.0008541, 0.0008541, 0.0008541, 0.0008541, 0.0008541, 0.0008541, 0.0008541, 0.0008541, 0.0008541, 0.0008541, 0.0008541, 0.0008541, 0.0008541, 0.0008541, 0.0008541, 0.0008541, 0.0008541, 0.0008541, 0.0008541, ... 0.0008541, 0.0008541, 0.0008541, 0.0008541, 0.0008541, 0.0008541, 0.0008541, 0.0008541, 0.0008541, 0.0008541, 0.0008541, 0.0008541, 0.0008541, 0.0008541, 0.0008541, 0.0008541, 0.0008541, 0.0008541, 0.0008541, 0.0008541, 0.0008541, 0.0008541, 0.0008541, 0.0008541, 0.0008541, 0.0008541, 0.0008541, 0.0008541, 0.0008541, 0.0008541, 0.0008541, 0.0008541, 0.0008541, 0.0008541, 0.0008541, 0.0008541, 0.0008541, 0.0008541, 0.0008541, 0.0008541, 0.0008541, 0.0008541, 0.0008541, 0.0008541, 0.0008541, 0.0008541, 0.0008541, 0.0008541, 0.0008541, 0.0008541, 0.0008541, 0.0008541, 0.0008541, 0.0008541, 0.0008541, 0.0008541, 0.0008541, 0.0008541, 0.0008541, 0.0008541, 0.0008541, 0.0008541, 0.0008541, 0.0008541, 0.0008541, 0.0008541, 0.0008541, 0.0008541, 0.0008541, 0.0008541, 0.0008541, 0.0008541, 0.0008541, 0.0008541, 0.0008541, 0.0008541, 0.0008541, 0.0008541, 0.0008541, 0.0008541, 0.0008541, 0.0008541, 0.0008541, 0.0008541, 0.0008541, 0.0008541, 0.0008541, 0.0008541, 0.0008541, 0.0008541, 0.0008541, 0.0008541, 0.0008541, 0.0008541, 0.0008541, 0.0008541, 0.0008541, 0.0008541, 0.0008541, 0.0008541, 0.0008541, 0.0008541, 0.0008541, 0.0008541, 0.0008541, 0.0008541, 0.0008541, 0.0008541, 0.0008541, 0.0008541, 0.0008541, 0.0008541, 0.0008541, 0.0008541, 0.0008541, 0.0008541, 0.0008541, 0.0008541, 0.0008541, 0.0008541]) - ch4vmr(time)float647.916e-07 7.916e-07 ... 7.916e-07
- long_name :
- ch4 volume mixing ratio
array([7.916e-07, 7.916e-07, 7.916e-07, 7.916e-07, 7.916e-07, 7.916e-07, 7.916e-07, 7.916e-07, 7.916e-07, 7.916e-07, 7.916e-07, 7.916e-07, 7.916e-07, 7.916e-07, 7.916e-07, 7.916e-07, 7.916e-07, 7.916e-07, 7.916e-07, 7.916e-07, 7.916e-07, 7.916e-07, 7.916e-07, 7.916e-07, 7.916e-07, 7.916e-07, 7.916e-07, 7.916e-07, 7.916e-07, 7.916e-07, 7.916e-07, 7.916e-07, 7.916e-07, 7.916e-07, 7.916e-07, 7.916e-07, 7.916e-07, 7.916e-07, 7.916e-07, 7.916e-07, 7.916e-07, 7.916e-07, 7.916e-07, 7.916e-07, 7.916e-07, 7.916e-07, 7.916e-07, 7.916e-07, 7.916e-07, 7.916e-07, 7.916e-07, 7.916e-07, 7.916e-07, 7.916e-07, 7.916e-07, 7.916e-07, 7.916e-07, 7.916e-07, 7.916e-07, 7.916e-07, 7.916e-07, 7.916e-07, 7.916e-07, 7.916e-07, 7.916e-07, 7.916e-07, 7.916e-07, 7.916e-07, 7.916e-07, 7.916e-07, 7.916e-07, 7.916e-07, 7.916e-07, 7.916e-07, 7.916e-07, 7.916e-07, 7.916e-07, 7.916e-07, 7.916e-07, 7.916e-07, 7.916e-07, 7.916e-07, 7.916e-07, 7.916e-07, 7.916e-07, 7.916e-07, 7.916e-07, 7.916e-07, 7.916e-07, 7.916e-07, 7.916e-07, 7.916e-07, 7.916e-07, 7.916e-07, 7.916e-07, 7.916e-07, 7.916e-07, 7.916e-07, 7.916e-07, 7.916e-07, 7.916e-07, 7.916e-07, 7.916e-07, 7.916e-07, 7.916e-07, 7.916e-07, 7.916e-07, 7.916e-07, 7.916e-07, 7.916e-07, 7.916e-07, 7.916e-07, 7.916e-07, 7.916e-07, 7.916e-07, 7.916e-07, 7.916e-07, 7.916e-07, 7.916e-07, 7.916e-07, ... 7.916e-07, 7.916e-07, 7.916e-07, 7.916e-07, 7.916e-07, 7.916e-07, 7.916e-07, 7.916e-07, 7.916e-07, 7.916e-07, 7.916e-07, 7.916e-07, 7.916e-07, 7.916e-07, 7.916e-07, 7.916e-07, 7.916e-07, 7.916e-07, 7.916e-07, 7.916e-07, 7.916e-07, 7.916e-07, 7.916e-07, 7.916e-07, 7.916e-07, 7.916e-07, 7.916e-07, 7.916e-07, 7.916e-07, 7.916e-07, 7.916e-07, 7.916e-07, 7.916e-07, 7.916e-07, 7.916e-07, 7.916e-07, 7.916e-07, 7.916e-07, 7.916e-07, 7.916e-07, 7.916e-07, 7.916e-07, 7.916e-07, 7.916e-07, 7.916e-07, 7.916e-07, 7.916e-07, 7.916e-07, 7.916e-07, 7.916e-07, 7.916e-07, 7.916e-07, 7.916e-07, 7.916e-07, 7.916e-07, 7.916e-07, 7.916e-07, 7.916e-07, 7.916e-07, 7.916e-07, 7.916e-07, 7.916e-07, 7.916e-07, 7.916e-07, 7.916e-07, 7.916e-07, 7.916e-07, 7.916e-07, 7.916e-07, 7.916e-07, 7.916e-07, 7.916e-07, 7.916e-07, 7.916e-07, 7.916e-07, 7.916e-07, 7.916e-07, 7.916e-07, 7.916e-07, 7.916e-07, 7.916e-07, 7.916e-07, 7.916e-07, 7.916e-07, 7.916e-07, 7.916e-07, 7.916e-07, 7.916e-07, 7.916e-07, 7.916e-07, 7.916e-07, 7.916e-07, 7.916e-07, 7.916e-07, 7.916e-07, 7.916e-07, 7.916e-07, 7.916e-07, 7.916e-07, 7.916e-07, 7.916e-07, 7.916e-07, 7.916e-07, 7.916e-07, 7.916e-07, 7.916e-07, 7.916e-07, 7.916e-07, 7.916e-07, 7.916e-07, 7.916e-07, 7.916e-07, 7.916e-07, 7.916e-07, 7.916e-07, 7.916e-07, 7.916e-07, 7.916e-07, 7.916e-07, 7.916e-07]) - n2ovmr(time)float642.757e-07 2.757e-07 ... 2.757e-07
- long_name :
- n2o volume mixing ratio
array([2.7568e-07, 2.7568e-07, 2.7568e-07, 2.7568e-07, 2.7568e-07, 2.7568e-07, 2.7568e-07, 2.7568e-07, 2.7568e-07, 2.7568e-07, 2.7568e-07, 2.7568e-07, 2.7568e-07, 2.7568e-07, 2.7568e-07, 2.7568e-07, 2.7568e-07, 2.7568e-07, 2.7568e-07, 2.7568e-07, 2.7568e-07, 2.7568e-07, 2.7568e-07, 2.7568e-07, 2.7568e-07, 2.7568e-07, 2.7568e-07, 2.7568e-07, 2.7568e-07, 2.7568e-07, 2.7568e-07, 2.7568e-07, 2.7568e-07, 2.7568e-07, 2.7568e-07, 2.7568e-07, 2.7568e-07, 2.7568e-07, 2.7568e-07, 2.7568e-07, 2.7568e-07, 2.7568e-07, 2.7568e-07, 2.7568e-07, 2.7568e-07, 2.7568e-07, 2.7568e-07, 2.7568e-07, 2.7568e-07, 2.7568e-07, 2.7568e-07, 2.7568e-07, 2.7568e-07, 2.7568e-07, 2.7568e-07, 2.7568e-07, 2.7568e-07, 2.7568e-07, 2.7568e-07, 2.7568e-07, 2.7568e-07, 2.7568e-07, 2.7568e-07, 2.7568e-07, 2.7568e-07, 2.7568e-07, 2.7568e-07, 2.7568e-07, 2.7568e-07, 2.7568e-07, 2.7568e-07, 2.7568e-07, 2.7568e-07, 2.7568e-07, 2.7568e-07, 2.7568e-07, 2.7568e-07, 2.7568e-07, 2.7568e-07, 2.7568e-07, 2.7568e-07, 2.7568e-07, 2.7568e-07, 2.7568e-07, 2.7568e-07, 2.7568e-07, 2.7568e-07, 2.7568e-07, 2.7568e-07, 2.7568e-07, 2.7568e-07, 2.7568e-07, 2.7568e-07, 2.7568e-07, 2.7568e-07, 2.7568e-07, 2.7568e-07, 2.7568e-07, 2.7568e-07, 2.7568e-07, ... 2.7568e-07, 2.7568e-07, 2.7568e-07, 2.7568e-07, 2.7568e-07, 2.7568e-07, 2.7568e-07, 2.7568e-07, 2.7568e-07, 2.7568e-07, 2.7568e-07, 2.7568e-07, 2.7568e-07, 2.7568e-07, 2.7568e-07, 2.7568e-07, 2.7568e-07, 2.7568e-07, 2.7568e-07, 2.7568e-07, 2.7568e-07, 2.7568e-07, 2.7568e-07, 2.7568e-07, 2.7568e-07, 2.7568e-07, 2.7568e-07, 2.7568e-07, 2.7568e-07, 2.7568e-07, 2.7568e-07, 2.7568e-07, 2.7568e-07, 2.7568e-07, 2.7568e-07, 2.7568e-07, 2.7568e-07, 2.7568e-07, 2.7568e-07, 2.7568e-07, 2.7568e-07, 2.7568e-07, 2.7568e-07, 2.7568e-07, 2.7568e-07, 2.7568e-07, 2.7568e-07, 2.7568e-07, 2.7568e-07, 2.7568e-07, 2.7568e-07, 2.7568e-07, 2.7568e-07, 2.7568e-07, 2.7568e-07, 2.7568e-07, 2.7568e-07, 2.7568e-07, 2.7568e-07, 2.7568e-07, 2.7568e-07, 2.7568e-07, 2.7568e-07, 2.7568e-07, 2.7568e-07, 2.7568e-07, 2.7568e-07, 2.7568e-07, 2.7568e-07, 2.7568e-07, 2.7568e-07, 2.7568e-07, 2.7568e-07, 2.7568e-07, 2.7568e-07, 2.7568e-07, 2.7568e-07, 2.7568e-07, 2.7568e-07, 2.7568e-07, 2.7568e-07, 2.7568e-07, 2.7568e-07, 2.7568e-07, 2.7568e-07, 2.7568e-07, 2.7568e-07, 2.7568e-07, 2.7568e-07, 2.7568e-07, 2.7568e-07, 2.7568e-07, 2.7568e-07, 2.7568e-07, 2.7568e-07, 2.7568e-07, 2.7568e-07, 2.7568e-07, 2.7568e-07, 2.7568e-07]) - f11vmr(time)float640.0 0.0 0.0 0.0 ... 0.0 0.0 0.0 0.0
- long_name :
- f11 volume mixing ratio
array([0., 0., 0., 0., 0., 0., 0., 0., 0., 0., 0., 0., 0., 0., 0., 0., 0., 0., 0., 0., 0., 0., 0., 0., 0., 0., 0., 0., 0., 0., 0., 0., 0., 0., 0., 0., 0., 0., 0., 0., 0., 0., 0., 0., 0., 0., 0., 0., 0., 0., 0., 0., 0., 0., 0., 0., 0., 0., 0., 0., 0., 0., 0., 0., 0., 0., 0., 0., 0., 0., 0., 0., 0., 0., 0., 0., 0., 0., 0., 0., 0., 0., 0., 0., 0., 0., 0., 0., 0., 0., 0., 0., 0., 0., 0., 0., 0., 0., 0., 0., 0., 0., 0., 0., 0., 0., 0., 0., 0., 0., 0., 0., 0., 0., 0., 0., 0., 0., 0., 0., 0., 0., 0., 0., 0., 0., 0., 0., 0., 0., 0., 0., 0., 0., 0., 0., 0., 0., 0., 0., 0., 0., 0., 0., 0., 0., 0., 0., 0., 0., 0., 0., 0., 0., 0., 0., 0., 0., 0., 0., 0., 0., 0., 0., 0., 0., 0., 0., 0., 0., 0., 0., 0., 0., 0., 0., 0., 0., 0., 0., 0., 0., 0., 0., 0., 0., 0., 0., 0., 0., 0., 0., 0., 0., 0., 0., 0., 0., 0., 0., 0., 0., 0., 0., 0., 0., 0., 0., 0., 0., 0., 0., 0., 0., 0., 0., 0., 0., 0., 0., 0., 0., 0., 0., 0., 0., 0., 0., 0., 0., 0., 0., 0., 0., 0., 0., 0., 0., 0., 0., 0., 0., 0., 0., 0., 0., 0., 0., 0., 0., 0., 0., 0., 0., 0., 0., 0., 0., 0., 0., 0., 0., 0., 0., 0., 0., 0., 0., 0., 0., 0., 0., 0., 0., 0., 0., 0., 0., 0., 0., 0., 0., 0., 0., 0., 0., 0., 0., 0., 0., 0., 0., 0., 0., 0., 0., 0., 0., 0., 0., 0., 0., 0., 0., 0., 0., 0., 0., 0., 0., 0., 0., 0., 0., 0., 0., 0., 0., 0., 0., 0., 0., 0., 0., 0., 0., 0., 0., 0., 0., 0., 0., 0., 0., 0., 0., 0., 0., 0., 0., 0., 0., 0., 0., 0., 0., 0., 0., 0., 0., 0., 0., 0., 0., 0., 0., 0., 0., 0., 0., 0., 0., 0., 0., 0., 0., 0., 0., 0., 0., 0., 0., 0., 0., 0., 0., 0., 0., 0., 0., 0., 0., 0., 0., 0., 0., 0., 0., 0., 0., 0., 0., 0., 0., 0., 0., 0., 0., 0., 0., 0., 0., 0., 0., 0., 0., 0., 0., 0., 0., 0., 0., 0., 0., 0., 0., 0., 0., 0., 0., 0., 0., 0., 0., 0., 0., 0., 0., 0., 0., 0., 0., 0., 0., 0., 0., 0., 0., 0., 0., 0., 0., 0., 0., 0., 0., 0., 0., 0., 0., 0., 0., 0., 0., 0., 0., 0., 0., 0., 0., 0., 0., 0., 0., 0., 0., 0., 0., 0., 0., 0., 0., 0., 0., 0., 0., 0., 0., 0., 0., 0., 0., 0., 0., 0., 0., 0., 0., 0., 0., 0., 0., 0., 0., 0., 0., 0., 0., 0., 0., 0., 0., 0., 0., 0., 0., 0., 0., 0., 0., 0., 0., 0., 0., 0., 0., 0., 0., 0., 0., 0., 0., 0., 0., 0., 0., 0., 0., 0., 0., 0., 0., 0., 0., 0., 0., 0., 0., 0., 0., 0., 0., 0., 0., 0., 0., 0., 0., 0., 0., 0., 0., 0., 0., 0., 0., 0., 0., 0., 0., 0., 0., 0., 0., 0., 0., 0., 0., 0., 0., 0., 0., 0., 0., 0., 0., 0., 0., 0., 0., 0., 0., 0., 0., 0., 0., 0., 0., 0., 0., 0., 0., 0., 0., 0., 0., 0., 0., 0., 0.]) - f12vmr(time)float640.0 0.0 0.0 0.0 ... 0.0 0.0 0.0 0.0
- long_name :
- f12 volume mixing ratio
array([0., 0., 0., 0., 0., 0., 0., 0., 0., 0., 0., 0., 0., 0., 0., 0., 0., 0., 0., 0., 0., 0., 0., 0., 0., 0., 0., 0., 0., 0., 0., 0., 0., 0., 0., 0., 0., 0., 0., 0., 0., 0., 0., 0., 0., 0., 0., 0., 0., 0., 0., 0., 0., 0., 0., 0., 0., 0., 0., 0., 0., 0., 0., 0., 0., 0., 0., 0., 0., 0., 0., 0., 0., 0., 0., 0., 0., 0., 0., 0., 0., 0., 0., 0., 0., 0., 0., 0., 0., 0., 0., 0., 0., 0., 0., 0., 0., 0., 0., 0., 0., 0., 0., 0., 0., 0., 0., 0., 0., 0., 0., 0., 0., 0., 0., 0., 0., 0., 0., 0., 0., 0., 0., 0., 0., 0., 0., 0., 0., 0., 0., 0., 0., 0., 0., 0., 0., 0., 0., 0., 0., 0., 0., 0., 0., 0., 0., 0., 0., 0., 0., 0., 0., 0., 0., 0., 0., 0., 0., 0., 0., 0., 0., 0., 0., 0., 0., 0., 0., 0., 0., 0., 0., 0., 0., 0., 0., 0., 0., 0., 0., 0., 0., 0., 0., 0., 0., 0., 0., 0., 0., 0., 0., 0., 0., 0., 0., 0., 0., 0., 0., 0., 0., 0., 0., 0., 0., 0., 0., 0., 0., 0., 0., 0., 0., 0., 0., 0., 0., 0., 0., 0., 0., 0., 0., 0., 0., 0., 0., 0., 0., 0., 0., 0., 0., 0., 0., 0., 0., 0., 0., 0., 0., 0., 0., 0., 0., 0., 0., 0., 0., 0., 0., 0., 0., 0., 0., 0., 0., 0., 0., 0., 0., 0., 0., 0., 0., 0., 0., 0., 0., 0., 0., 0., 0., 0., 0., 0., 0., 0., 0., 0., 0., 0., 0., 0., 0., 0., 0., 0., 0., 0., 0., 0., 0., 0., 0., 0., 0., 0., 0., 0., 0., 0., 0., 0., 0., 0., 0., 0., 0., 0., 0., 0., 0., 0., 0., 0., 0., 0., 0., 0., 0., 0., 0., 0., 0., 0., 0., 0., 0., 0., 0., 0., 0., 0., 0., 0., 0., 0., 0., 0., 0., 0., 0., 0., 0., 0., 0., 0., 0., 0., 0., 0., 0., 0., 0., 0., 0., 0., 0., 0., 0., 0., 0., 0., 0., 0., 0., 0., 0., 0., 0., 0., 0., 0., 0., 0., 0., 0., 0., 0., 0., 0., 0., 0., 0., 0., 0., 0., 0., 0., 0., 0., 0., 0., 0., 0., 0., 0., 0., 0., 0., 0., 0., 0., 0., 0., 0., 0., 0., 0., 0., 0., 0., 0., 0., 0., 0., 0., 0., 0., 0., 0., 0., 0., 0., 0., 0., 0., 0., 0., 0., 0., 0., 0., 0., 0., 0., 0., 0., 0., 0., 0., 0., 0., 0., 0., 0., 0., 0., 0., 0., 0., 0., 0., 0., 0., 0., 0., 0., 0., 0., 0., 0., 0., 0., 0., 0., 0., 0., 0., 0., 0., 0., 0., 0., 0., 0., 0., 0., 0., 0., 0., 0., 0., 0., 0., 0., 0., 0., 0., 0., 0., 0., 0., 0., 0., 0., 0., 0., 0., 0., 0., 0., 0., 0., 0., 0., 0., 0., 0., 0., 0., 0., 0., 0., 0., 0., 0., 0., 0., 0., 0., 0., 0., 0., 0., 0., 0., 0., 0., 0., 0., 0., 0., 0., 0., 0., 0., 0., 0., 0., 0., 0., 0., 0., 0., 0., 0., 0., 0., 0., 0., 0., 0., 0., 0., 0., 0., 0., 0., 0., 0., 0., 0., 0., 0., 0., 0., 0., 0., 0., 0., 0., 0., 0., 0., 0., 0., 0., 0., 0., 0., 0., 0., 0., 0., 0., 0., 0., 0., 0., 0., 0., 0., 0., 0., 0., 0.]) - sol_tsi(time)float64-1.0 -1.0 -1.0 ... -1.0 -1.0 -1.0
- long_name :
- total solar irradiance
- units :
- W/m2
array([-1., -1., -1., -1., -1., -1., -1., -1., -1., -1., -1., -1., -1., -1., -1., -1., -1., -1., -1., -1., -1., -1., -1., -1., -1., -1., -1., -1., -1., -1., -1., -1., -1., -1., -1., -1., -1., -1., -1., -1., -1., -1., -1., -1., -1., -1., -1., -1., -1., -1., -1., -1., -1., -1., -1., -1., -1., -1., -1., -1., -1., -1., -1., -1., -1., -1., -1., -1., -1., -1., -1., -1., -1., -1., -1., -1., -1., -1., -1., -1., -1., -1., -1., -1., -1., -1., -1., -1., -1., -1., -1., -1., -1., -1., -1., -1., -1., -1., -1., -1., -1., -1., -1., -1., -1., -1., -1., -1., -1., -1., -1., -1., -1., -1., -1., -1., -1., -1., -1., -1., -1., -1., -1., -1., -1., -1., -1., -1., -1., -1., -1., -1., -1., -1., -1., -1., -1., -1., -1., -1., -1., -1., -1., -1., -1., -1., -1., -1., -1., -1., -1., -1., -1., -1., -1., -1., -1., -1., -1., -1., -1., -1., -1., -1., -1., -1., -1., -1., -1., -1., -1., -1., -1., -1., -1., -1., -1., -1., -1., -1., -1., -1., -1., -1., -1., -1., -1., -1., -1., -1., -1., -1., -1., -1., -1., -1., -1., -1., -1., -1., -1., -1., -1., -1., -1., -1., -1., -1., -1., -1., -1., -1., -1., -1., -1., -1., -1., -1., -1., -1., -1., -1., -1., -1., -1., -1., -1., -1., -1., -1., -1., -1., -1., -1., -1., -1., -1., -1., -1., -1., -1., -1., -1., -1., -1., -1., -1., -1., -1., -1., -1., -1., -1., -1., -1., -1., -1., -1., -1., -1., ... -1., -1., -1., -1., -1., -1., -1., -1., -1., -1., -1., -1., -1., -1., -1., -1., -1., -1., -1., -1., -1., -1., -1., -1., -1., -1., -1., -1., -1., -1., -1., -1., -1., -1., -1., -1., -1., -1., -1., -1., -1., -1., -1., -1., -1., -1., -1., -1., -1., -1., -1., -1., -1., -1., -1., -1., -1., -1., -1., -1., -1., -1., -1., -1., -1., -1., -1., -1., -1., -1., -1., -1., -1., -1., -1., -1., -1., -1., -1., -1., -1., -1., -1., -1., -1., -1., -1., -1., -1., -1., -1., -1., -1., -1., -1., -1., -1., -1., -1., -1., -1., -1., -1., -1., -1., -1., -1., -1., -1., -1., -1., -1., -1., -1., -1., -1., -1., -1., -1., -1., -1., -1., -1., -1., -1., -1., -1., -1., -1., -1., -1., -1., -1., -1., -1., -1., -1., -1., -1., -1., -1., -1., -1., -1., -1., -1., -1., -1., -1., -1., -1., -1., -1., -1., -1., -1., -1., -1., -1., -1., -1., -1., -1., -1., -1., -1., -1., -1., -1., -1., -1., -1., -1., -1., -1., -1., -1., -1., -1., -1., -1., -1., -1., -1., -1., -1., -1., -1., -1., -1., -1., -1., -1., -1., -1., -1., -1., -1., -1., -1., -1., -1., -1., -1., -1., -1., -1., -1., -1., -1., -1., -1., -1., -1., -1., -1., -1., -1., -1., -1., -1., -1., -1., -1., -1., -1., -1., -1., -1., -1., -1., -1., -1., -1., -1., -1., -1., -1., -1., -1., -1., -1., -1., -1., -1., -1., -1., -1., -1.]) - nsteph(time)int32156805488 156806832 ... 157680000
- long_name :
- current timestep
array([156805488, 156806832, 156808320, 156809760, 156811248, 156812688, 156814176, 156815664, 156817104, 156818592, 156820032, 156821520, 156823008, 156824352, 156825840, 156827280, 156828768, 156830208, 156831696, 156833184, 156834624, 156836112, 156837552, 156839040, 156840528, 156841872, 156843360, 156844800, 156846288, 156847728, 156849216, 156850704, 156852144, 156853632, 156855072, 156856560, 156858048, 156859392, 156860880, 156862320, 156863808, 156865248, 156866736, 156868224, 156869664, 156871152, 156872592, 156874080, 156875568, 156876912, 156878400, 156879840, 156881328, 156882768, 156884256, 156885744, 156887184, 156888672, 156890112, 156891600, 156893088, 156894432, 156895920, 156897360, 156898848, 156900288, 156901776, 156903264, 156904704, 156906192, 156907632, 156909120, 156910608, 156911952, 156913440, 156914880, 156916368, 156917808, 156919296, 156920784, 156922224, 156923712, 156925152, 156926640, 156928128, 156929472, 156930960, 156932400, 156933888, 156935328, 156936816, 156938304, 156939744, 156941232, 156942672, 156944160, 156945648, 156946992, 156948480, 156949920, 156951408, 156952848, 156954336, 156955824, 156957264, 156958752, 156960192, 156961680, 156963168, 156964512, 156966000, 156967440, 156968928, 156970368, 156971856, 156973344, 156974784, 156976272, 156977712, 156979200, ... 157514976, 157516464, 157517904, 157519392, 157520832, 157522320, 157523808, 157525152, 157526640, 157528080, 157529568, 157531008, 157532496, 157533984, 157535424, 157536912, 157538352, 157539840, 157541328, 157542672, 157544160, 157545600, 157547088, 157548528, 157550016, 157551504, 157552944, 157554432, 157555872, 157557360, 157558848, 157560192, 157561680, 157563120, 157564608, 157566048, 157567536, 157569024, 157570464, 157571952, 157573392, 157574880, 157576368, 157577712, 157579200, 157580640, 157582128, 157583568, 157585056, 157586544, 157587984, 157589472, 157590912, 157592400, 157593888, 157595232, 157596720, 157598160, 157599648, 157601088, 157602576, 157604064, 157605504, 157606992, 157608432, 157609920, 157611408, 157612752, 157614240, 157615680, 157617168, 157618608, 157620096, 157621584, 157623024, 157624512, 157625952, 157627440, 157628928, 157630272, 157631760, 157633200, 157634688, 157636128, 157637616, 157639104, 157640544, 157642032, 157643472, 157644960, 157646448, 157647792, 157649280, 157650720, 157652208, 157653648, 157655136, 157656624, 157658064, 157659552, 157660992, 157662480, 157663968, 157665312, 157666800, 157668240, 157669728, 157671168, 157672656, 157674144, 157675584, 157677072, 157678512, 157680000], dtype=int32) - TS(time, ncol)float32303.9 303.3 302.5 ... 292.6 293.3
- units :
- K
- long_name :
- Surface temperature (radiative)
- cell_methods :
- time: mean
array([[303.87384, 303.30386, 302.49002, ..., 293.76035, 291.0333 ,
        291.91165],
       [304.57132, 304.219  , 303.71158, ..., 292.73807, 290.36758,
        291.43896],
       [304.5752 , 304.2225 , 303.69778, ..., 292.7631 , 291.61636,
        292.54977],
       ...,
       [298.30557, 297.24545, 295.97394, ..., 302.33307, 301.01004,
        301.58942],
       [300.32935, 299.35425, 298.1272 , ..., 298.4472 , 295.93607,
        296.67627],
       [302.33698, 301.58383, 300.57407, ..., 294.71838, 292.59775,
        293.28656]], shape=(600, 13826), dtype=float32)
- levPandasIndex
PandasIndex(Index([ 3.64346569404006, 7.594819646328688, 14.356632251292467, 24.612220004200935, 38.26829977333546, 54.59547974169254, 72.01245054602623, 87.82123029232025, 103.31712663173676, 121.54724076390266, 142.99403876066208, 168.22507977485657, 197.9080867022276, 232.82861895859241, 273.9108167588711, 322.2419023513794, 379.10090386867523, 445.992574095726, 524.6871747076511, 609.7786948084831, 691.3894303143024, 763.404481112957, 820.8583686500788, 859.5347665250301, 887.0202489197254, 912.644546944648, 936.1983984708786, 957.485479535535, 976.325407391414, 992.556095123291], dtype='float64', name='lev')) - ilevPandasIndex
PandasIndex(Index([ 2.255239523947239, 5.031691864132881, 10.15794742852449, 18.55531707406044, 30.66912293434143, 45.86747661232948, 63.3234828710556, 80.70141822099686, 94.94104236364365, 111.69321089982991, 131.4012706279755, 154.5868068933487, 181.8633526563644, 213.95282074809072, 251.70441716909409, 296.11721634864807, 348.3665883541107, 409.8352193832398, 482.14992880821234, 567.22442060709, 652.3329690098763, 730.4458916187286, 796.3630706071854, 845.3536666929722, 873.7158663570881, 900.3246314823627, 924.9644624069333, 947.4323345348239, 967.5386245362461, 985.112190246582, 1000.0], dtype='float64', name='ilev')) - timePandasIndex
PandasIndex(CFTimeIndex([8951-02-01 00:00:00, 8951-03-01 00:00:00, 8951-04-01 00:00:00,
             8951-05-01 00:00:00, 8951-06-01 00:00:00, 8951-07-01 00:00:00,
             8951-08-01 00:00:00, 8951-09-01 00:00:00, 8951-10-01 00:00:00,
             8951-11-01 00:00:00,
             ...
             9000-04-01 00:00:00, 9000-05-01 00:00:00, 9000-06-01 00:00:00,
             9000-07-01 00:00:00, 9000-08-01 00:00:00, 9000-09-01 00:00:00,
             9000-10-01 00:00:00, 9000-11-01 00:00:00, 9000-12-01 00:00:00,
             9001-01-01 00:00:00],
            dtype='object', length=600, calendar='noleap', freq='MS'))
- np :
- 4
- ne :
- 16
- Conventions :
- CF-1.0
- source :
- CAM
- case :
- b.e13.B1850C5.ne16_g16.icesm131_d18O_fixer.Miocene.3xCO2.005.offset.d18O.branch
- title :
- UNSET
- logname :
- fengzhu
- host :
- derecho5
- Version :
- $Name$
- revision_Id :
- $Id$
- initial_file :
- /glade/campaign/cesm/cesmdata/inputdata/atm/cam/inic/homme/cami-mam3_0000-01-ne16np4_L30_c090306.nc
- topography_file :
- /glade/work/fengzhu/Projects/Miocene-on-Derecho/04.atm-bc-setup/cami_bnd_topo_ne16_Miocene_c231124.nc
- path :
- /glade/campaign/cesm/community/palwg/MCO_LongSims/b.e13.B1850C5.ne16_g16.icesm131_d18O_fixer.Miocene.3xCO2.005/atm/proc/tseries/month_1/b.e13.B1850C5.ne16_g16.icesm131_d18O_fixer.Miocene.3xCO2.005.cam.h0.TS.895101-900012.nc
- comp :
- atm
- grid :
- ne16np4
- gw :
- <xarray.DataArray 'area' (ncol: 13826)> Size: 111kB array([0.00015457, 0.00051501, 0.00051372, ..., 0.00128989, 0.00128989, 0.00128935], shape=(13826,)) Dimensions without coordinates: ncol
- lat :
- <xarray.DataArray 'lat' (ncol: 13826)> Size: 111kB array([-35.26438968, -35.98082588, -37.07155175, ..., 37.90897632, 37.90897632, 36.74360278], shape=(13826,)) Dimensions without coordinates: ncol Attributes: long_name: latitude units: degrees_north
- lon :
- <xarray.DataArray 'lon' (ncol: 13826)> Size: 111kB array([315. , 316.55471176, 319.07028824, ..., 132.47470023, 137.52529977, 135. ], shape=(13826,)) Dimensions without coordinates: ncol Attributes: long_name: longitude units: degrees_east
Publication-ready Visualization#
With x4c, publication-ready figures can be generated with a simple call of plot() for various types of data.
[31]:
da_clim = da.x.regrid().mean('time')
da_clim
[31]:
<xarray.DataArray 'TS' (lat: 180, lon: 360)> Size: 259kB
array([[255.93816, 255.93839, 255.93898, ..., 255.93898, 255.93839,
        255.93816],
       [255.59033, 255.59033, 255.59033, ..., 255.59033, 255.59033,
        255.59033],
       [255.55145, 255.55174, 255.55206, ..., 255.55206, 255.55174,
        255.55145],
       ...,
       [279.70557, 279.7059 , 279.70642, ..., 279.70642, 279.7059 ,
        279.70557],
       [279.76398, 279.76398, 279.76398, ..., 279.76398, 279.76398,
        279.76398],
       [279.80237, 279.80237, 279.8024 , ..., 279.8024 , 279.80237,
        279.80237]], shape=(180, 360), dtype=float32)
Coordinates:
  * lat      (lat) float64 1kB -89.5 -88.5 -87.5 -86.5 ... 86.5 87.5 88.5 89.5
  * lon      (lon) float64 3kB 0.5 1.5 2.5 3.5 4.5 ... 356.5 357.5 358.5 359.5
Attributes:
    units:         K
    long_name:     Surface temperature (radiative)
    cell_methods:  time: mean
    path:          /glade/campaign/cesm/community/palwg/MCO_LongSims/b.e13.B1...
    gw:            <xarray.DataArray 'area' (ncol: 13826)> Size: 111kB\narray...
    comp:          atm
    grid:          ne16np4
xarray.DataArray
'TS'
- lat: 180
- lon: 360
- 255.9 255.9 255.9 255.9 255.9 255.9 ... 279.8 279.8 279.8 279.8 279.8
array([[255.93816, 255.93839, 255.93898, ..., 255.93898, 255.93839, 255.93816], [255.59033, 255.59033, 255.59033, ..., 255.59033, 255.59033, 255.59033], [255.55145, 255.55174, 255.55206, ..., 255.55206, 255.55174, 255.55145], ..., [279.70557, 279.7059 , 279.70642, ..., 279.70642, 279.7059 , 279.70557], [279.76398, 279.76398, 279.76398, ..., 279.76398, 279.76398, 279.76398], [279.80237, 279.80237, 279.8024 , ..., 279.8024 , 279.80237, 279.80237]], shape=(180, 360), dtype=float32) - lat(lat)float64-89.5 -88.5 -87.5 ... 88.5 89.5
array([-89.5, -88.5, -87.5, -86.5, -85.5, -84.5, -83.5, -82.5, -81.5, -80.5, -79.5, -78.5, -77.5, -76.5, -75.5, -74.5, -73.5, -72.5, -71.5, -70.5, -69.5, -68.5, -67.5, -66.5, -65.5, -64.5, -63.5, -62.5, -61.5, -60.5, -59.5, -58.5, -57.5, -56.5, -55.5, -54.5, -53.5, -52.5, -51.5, -50.5, -49.5, -48.5, -47.5, -46.5, -45.5, -44.5, -43.5, -42.5, -41.5, -40.5, -39.5, -38.5, -37.5, -36.5, -35.5, -34.5, -33.5, -32.5, -31.5, -30.5, -29.5, -28.5, -27.5, -26.5, -25.5, -24.5, -23.5, -22.5, -21.5, -20.5, -19.5, -18.5, -17.5, -16.5, -15.5, -14.5, -13.5, -12.5, -11.5, -10.5, -9.5, -8.5, -7.5, -6.5, -5.5, -4.5, -3.5, -2.5, -1.5, -0.5, 0.5, 1.5, 2.5, 3.5, 4.5, 5.5, 6.5, 7.5, 8.5, 9.5, 10.5, 11.5, 12.5, 13.5, 14.5, 15.5, 16.5, 17.5, 18.5, 19.5, 20.5, 21.5, 22.5, 23.5, 24.5, 25.5, 26.5, 27.5, 28.5, 29.5, 30.5, 31.5, 32.5, 33.5, 34.5, 35.5, 36.5, 37.5, 38.5, 39.5, 40.5, 41.5, 42.5, 43.5, 44.5, 45.5, 46.5, 47.5, 48.5, 49.5, 50.5, 51.5, 52.5, 53.5, 54.5, 55.5, 56.5, 57.5, 58.5, 59.5, 60.5, 61.5, 62.5, 63.5, 64.5, 65.5, 66.5, 67.5, 68.5, 69.5, 70.5, 71.5, 72.5, 73.5, 74.5, 75.5, 76.5, 77.5, 78.5, 79.5, 80.5, 81.5, 82.5, 83.5, 84.5, 85.5, 86.5, 87.5, 88.5, 89.5]) - lon(lon)float640.5 1.5 2.5 ... 357.5 358.5 359.5
array([ 0.5, 1.5, 2.5, ..., 357.5, 358.5, 359.5], shape=(360,))
- latPandasIndex
PandasIndex(Index([-89.5, -88.5, -87.5, -86.5, -85.5, -84.5, -83.5, -82.5, -81.5, -80.5, ... 80.5, 81.5, 82.5, 83.5, 84.5, 85.5, 86.5, 87.5, 88.5, 89.5], dtype='float64', name='lat', length=180)) - lonPandasIndex
PandasIndex(Index([  0.5,   1.5,   2.5,   3.5,   4.5,   5.5,   6.5,   7.5,   8.5,   9.5,
       ...
       350.5, 351.5, 352.5, 353.5, 354.5, 355.5, 356.5, 357.5, 358.5, 359.5],
      dtype='float64', name='lon', length=360))
- units :
- K
- long_name :
- Surface temperature (radiative)
- cell_methods :
- time: mean
- path :
- /glade/campaign/cesm/community/palwg/MCO_LongSims/b.e13.B1850C5.ne16_g16.icesm131_d18O_fixer.Miocene.3xCO2.005/atm/proc/tseries/month_1/b.e13.B1850C5.ne16_g16.icesm131_d18O_fixer.Miocene.3xCO2.005.cam.h0.TS.895101-900012.nc
- gw :
- <xarray.DataArray 'area' (ncol: 13826)> Size: 111kB array([0.00015457, 0.00051501, 0.00051372, ..., 0.00128989, 0.00128989, 0.00128935], shape=(13826,)) Dimensions without coordinates: ncol
- comp :
- atm
- grid :
- ne16np4
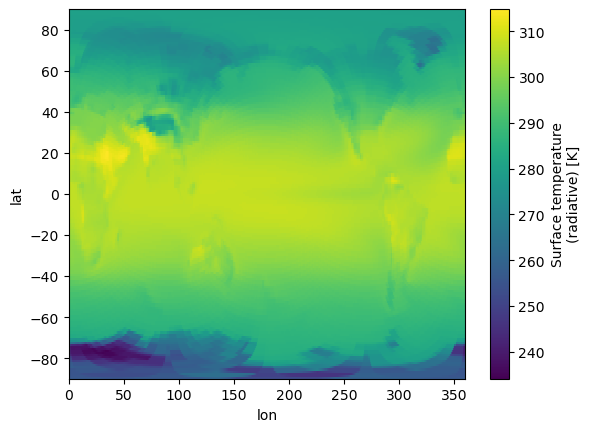
Xarray provides a barebone plotting feature:
[32]:
da_clim.plot()
[32]:
<matplotlib.collections.QuadMesh at 0x1553865202d0>
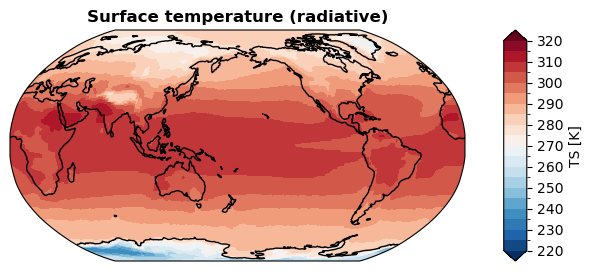
In constrast, x4c generates publication-ready plots:
[38]:
fig, ax = da_clim.x.plot(
    levels=np.linspace(220, 320, 21),
    cbar_kwargs={'ticks': np.linspace(220, 320, 11)},
)
[ ]: