Mira Berdahl (Feb 13 2023 at 23:37): Mira Berdahl (Feb 13 2023 at 23:37):
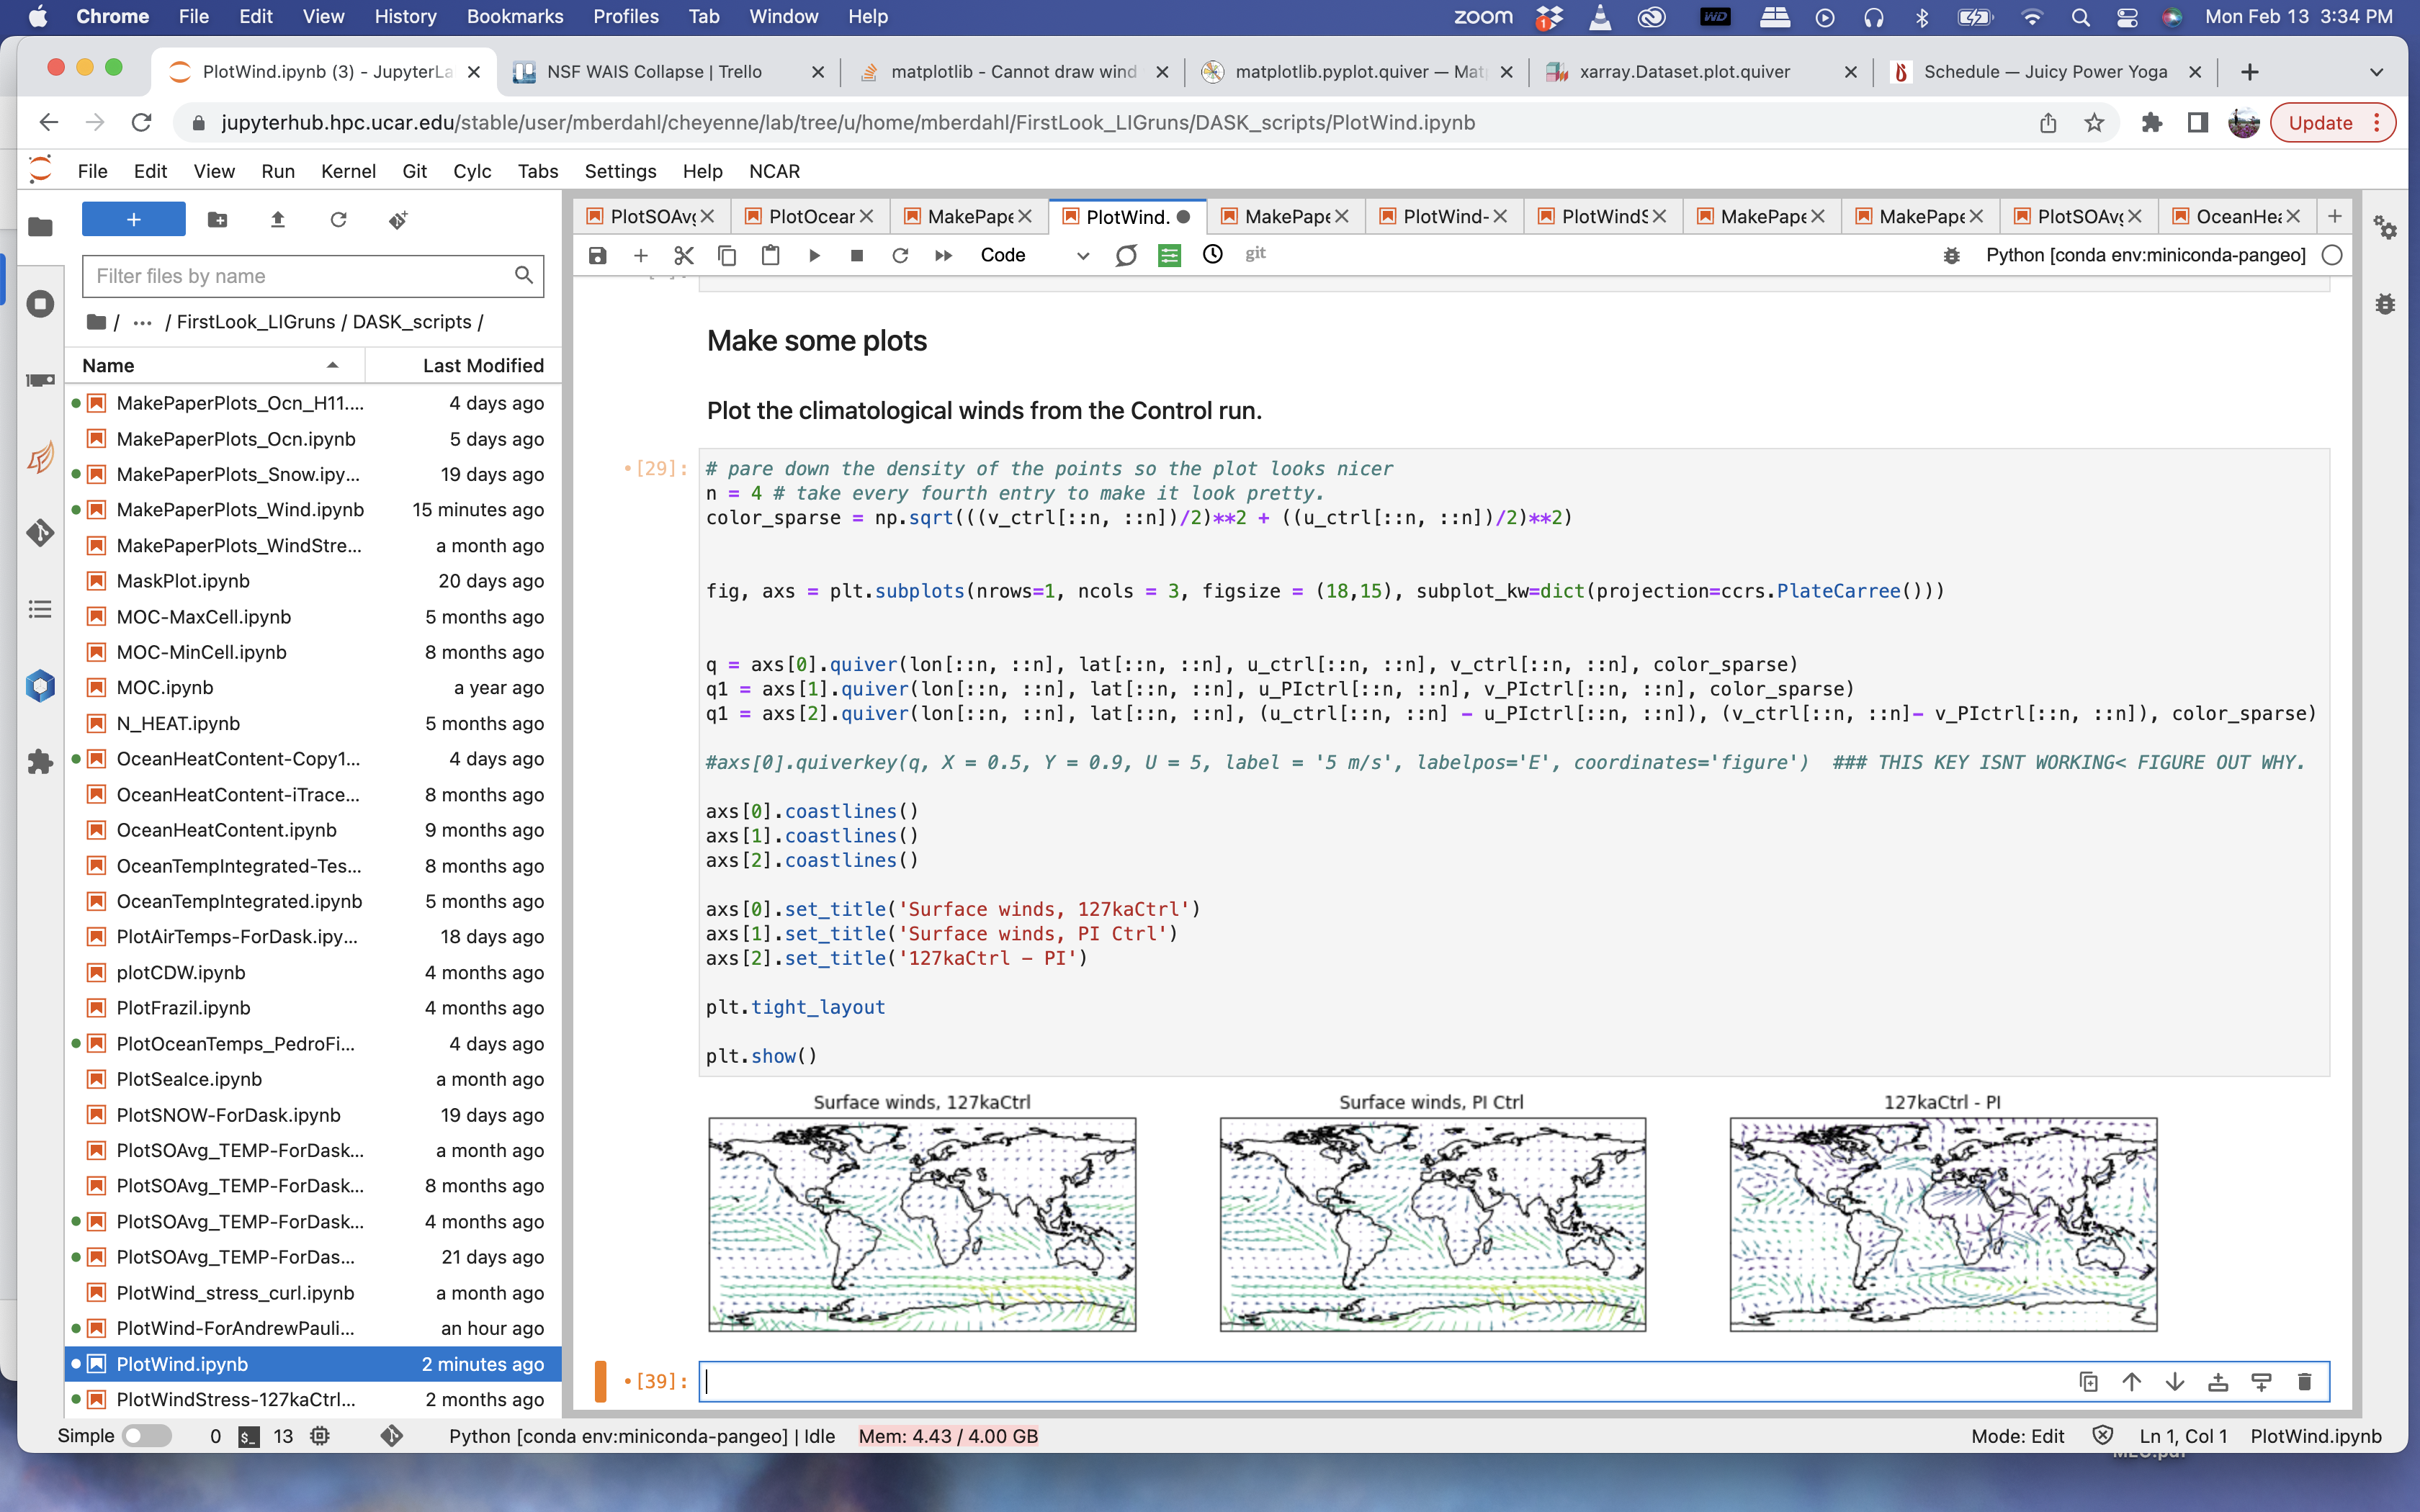
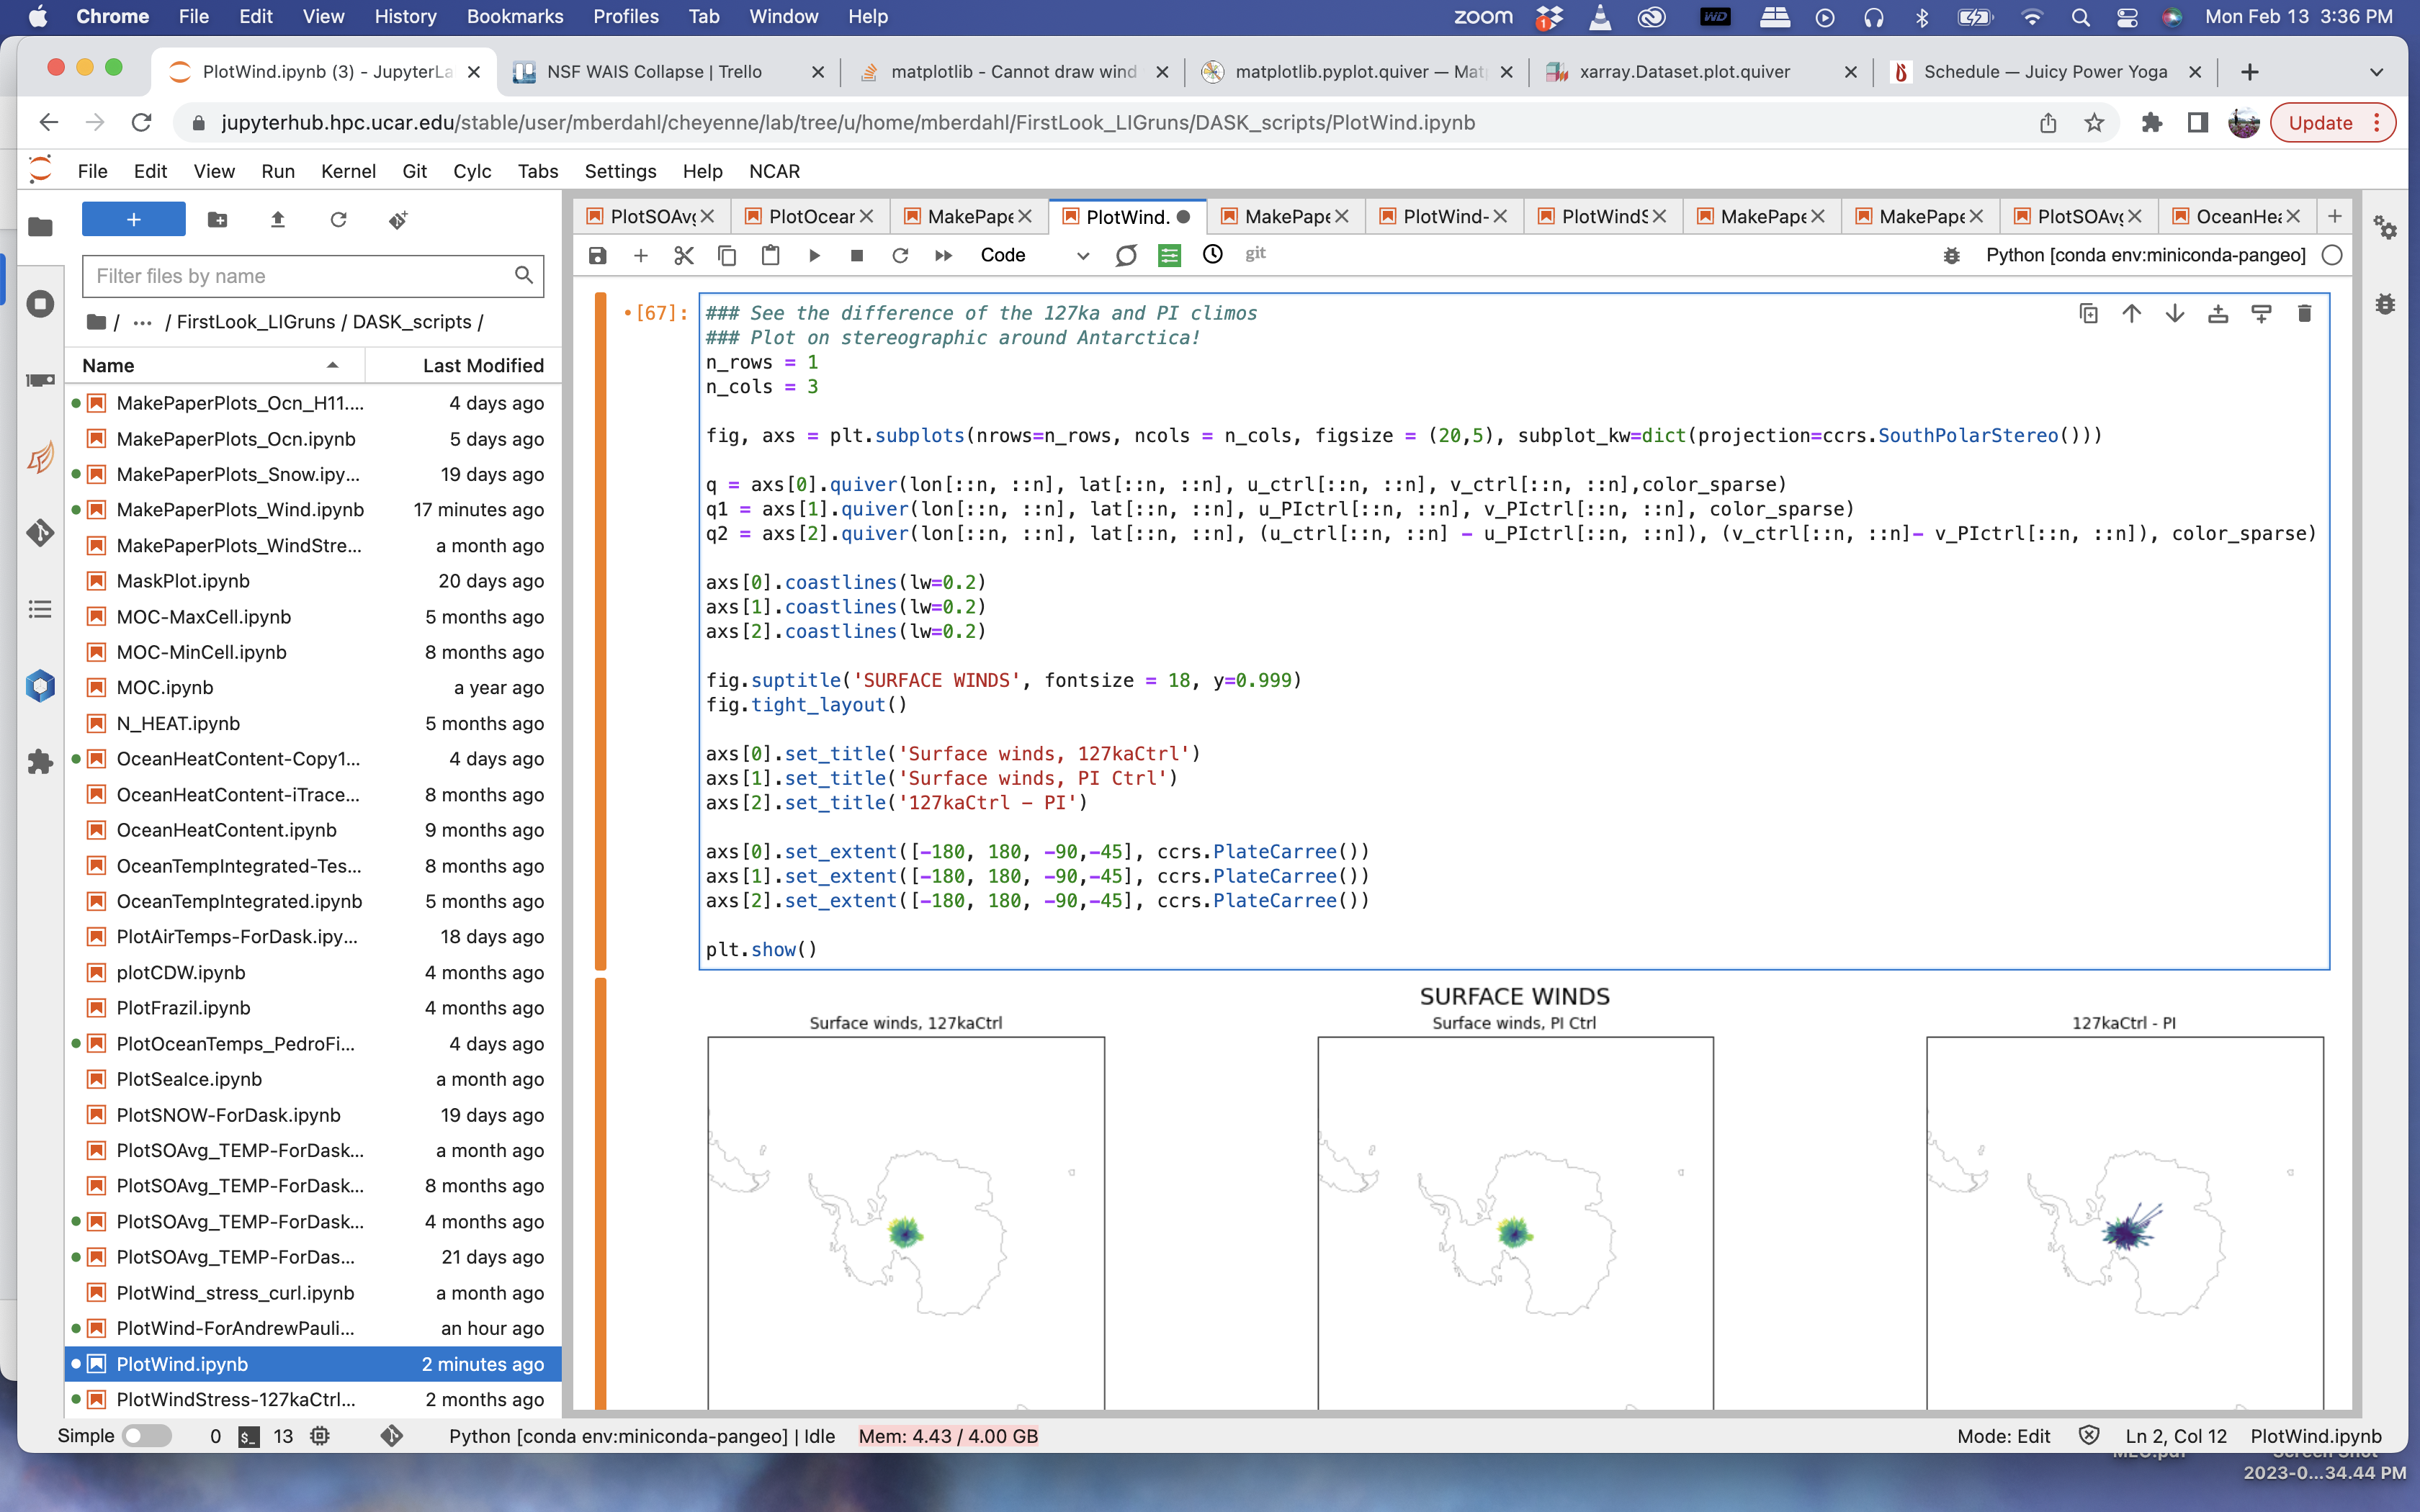
I'm having weird results when trying to plot wind barbs using quiver in xarray. When I use the platecarree projection there is no problem, but when I just switch to polarstereo (or anything other than platecarree), it is wrong (all the arrows originate at the pole)
Attached is a screenshot showing the successful plot in PlateCarree, and another screenshot s Screen-Shot-2023-02-13-at-3.34.44-PM.png howing the unsuccessful result with SouthPolarStereo. Can anyone see what I'm missing? I have changed nothing about lon, lat or the datasets between the two plots. Screen-Shot-2023-02-13-at-3.36.50-PM.png
Notification Bot (Feb 14 2023 at 01:07):Mira Berdahl has marked this topic as resolved.
Notification Bot (Feb 14 2023 at 01:08):Mira Berdahl has marked this topic as unresolved.
Mira Berdahl (Feb 14 2023 at 01:26):Just to say, this has been solved.
A couple things were missing:
the transform argument was the main thing. But also, regrid_shape was helpful with a polar projection. And finally, quiver wants numpy arrays, not xarray DataArrays, so I had to do .data .
Copied a working example below:
n_rows = 1
n_cols = 3

fig, axs = plt.subplots(nrows=n_rows, ncols = n_cols, figsize = (12,4), subplot_kw=dict(projection=ccrs.SouthPolarStereo()))
color_sparse = np.sqrt(((v_ctrl)/2)**2 + ((u_ctrl)/2)**2)

axs[0].coastlines(lw=0.2)
axs[1].coastlines(lw=0.2)
axs[2].coastlines(lw=0.2)

q = axs[0].quiver(lon, lat, u_ctrl.data, v_ctrl.data, color_sparse.data, transform=ccrs.PlateCarree(), regrid_shape=150, scale = 100)
q1 = axs[1].quiver(lon, lat, u_PIctrl.data, v_PIctrl.data, color_sparse.data, transform=ccrs.PlateCarree(), regrid_shape=150, scale = 100)
q2 = axs[2].quiver(lon, lat, (u_ctrl - u_PIctrl).data, (v_ctrl-v_PIctrl).data, color_sparse.data, transform=ccrs.PlateCarree(), regrid_shape=150, scale = 100)

fig.suptitle('SURFACE WINDS', fontsize = 18, y=0.999)
fig.tight_layout()

axs[0].set_title('Surface winds, 127kaCtrl')
axs[1].set_title('Surface winds, PI Ctrl')
axs[2].set_title('127kaCtrl - PI')

axs[0].set_extent([-180, 180, -90,-45], ccrs.PlateCarree())
axs[1].set_extent([-180, 180, -90,-45], ccrs.PlateCarree())
axs[2].set_extent([-180, 180, -90,-45], ccrs.PlateCarree())

plt.show()
Mira Berdahl has marked this topic as resolved.
Deepak Cherian (Feb 14 2023 at 02:39):And finally, quiver wants numpy arrays, not xarray DataArrays,
There is Dataset.plot.quiver
Last updated: May 16 2025 at 17:14 UTC