Muntaha Pasha (Nov 19 2020 at 18:43): Muntaha Pasha (Nov 19 2020 at 18:43):
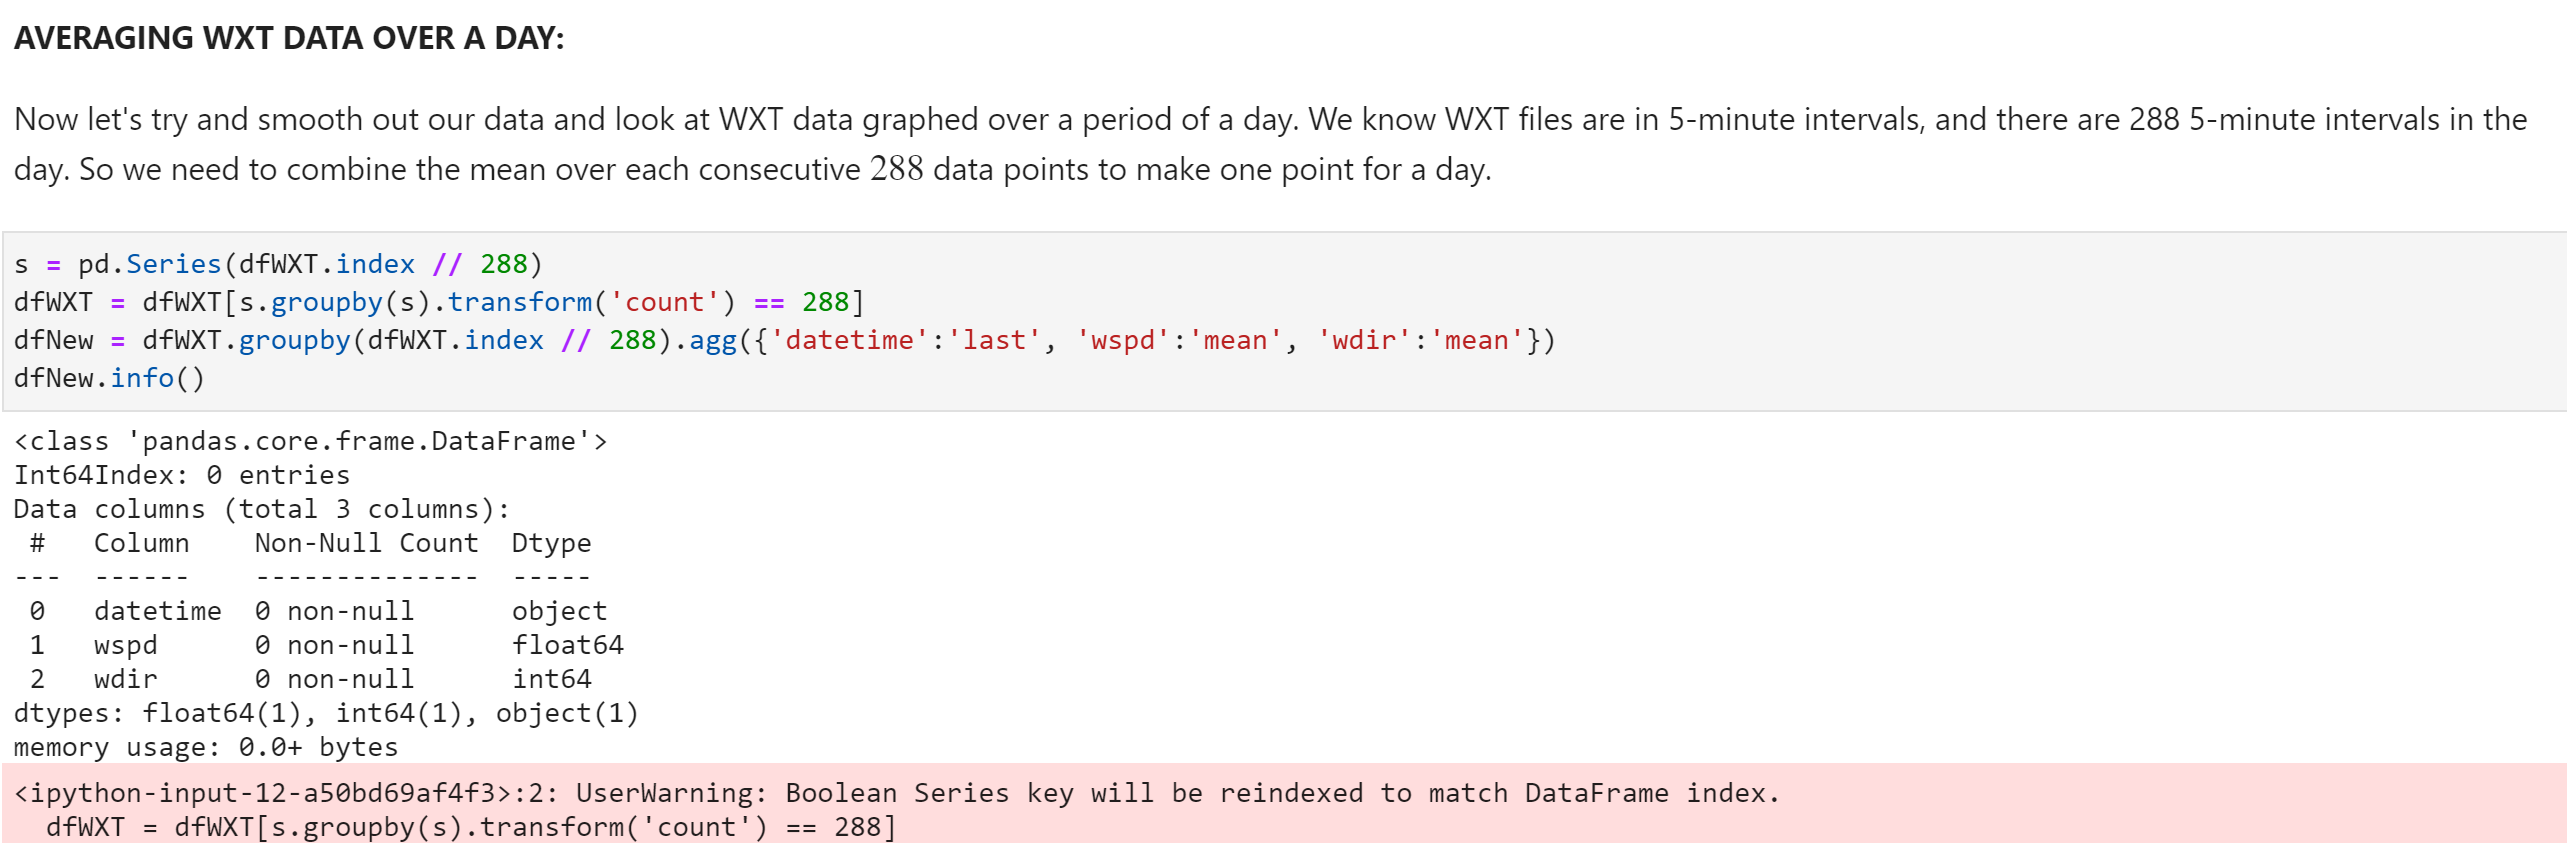
Hello all! I had a question in regards to averaging data from a dataframe. Right now, I am trying to plot a running mean of Anemometer wind speed data from the WXT. There are a total of 281391 entries in my WXT dataframe. These points are 5 minutes apart. Because I want to graph the data day by day, I need to take the average wind speed for every 288th data points. (Since there are 288 5-minute intervals in one day). So I want to average every 288 points. However, I am running into some errors with the way I'm doing it now. I've attached the image below of the error I'm getting using a method I found online. I am not sure what I should be doing instead or if there's an easier way to do this? Capture.PNG
Anderson Banihirwe (Nov 19 2020 at 18:47):@Muntaha Pasha, it sounds like the rolling window operation with a window size of 288 is what you want... https://pandas.pydata.org/pandas-docs/stable/reference/api/pandas.DataFrame.rolling.html
Anderson Banihirwe (Nov 19 2020 at 18:48):Is my interpretation correct?
Muntaha Pasha (Nov 19 2020 at 18:50):I believe so, yes. I haven't seen this documentation before, do you by any chance know how I'd set it up in my case?
Anderson Banihirwe (Nov 19 2020 at 18:53):What do you get when run dfWXT.index.dtype?
Muntaha Pasha (Nov 19 2020 at 18:54):I get dtype('int64')
Anderson Banihirwe (Nov 19 2020 at 18:55):I'd recommend setting your pandas.DataFrame indexes to consist of datetime objects... What is the data type of the datetime column?
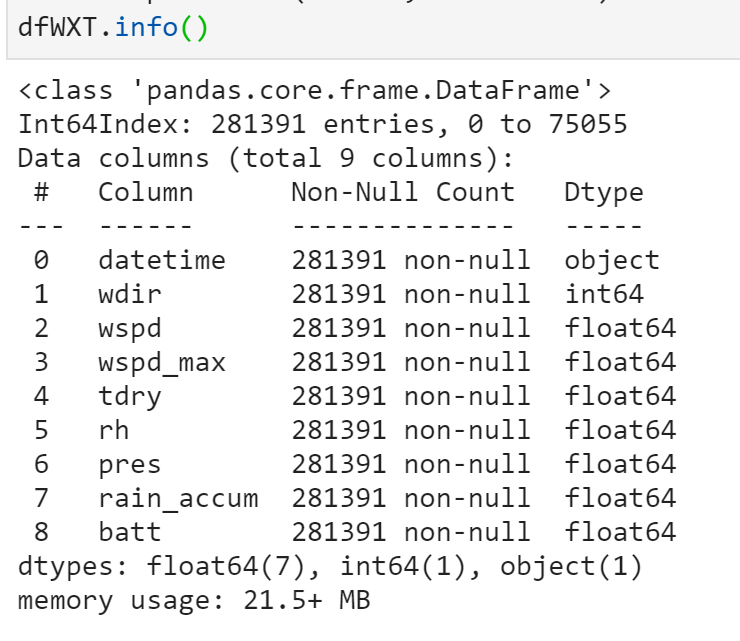
Muntaha Pasha (Nov 19 2020 at 18:57):Capture.PNG
This is what I have for the types. It looks like datetime is an object
Anderson Banihirwe (Nov 19 2020 at 18:59):Try the following:
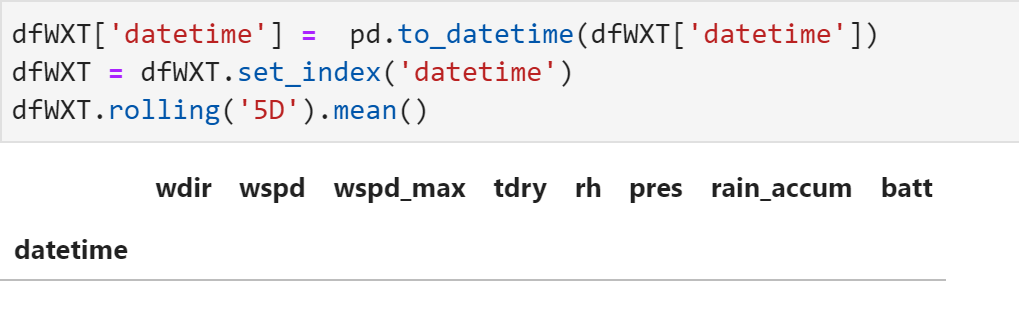
dfWXT['datetime'] =  pd.to_datetime(dfWXT['datetime'])
dfWXT = dfWXT.set_index('datetime')
dfWXT.rolling('5D').mean()
Muntaha Pasha (Nov 19 2020 at 19:01):Capture.PNG So this is what I got. It just gave me this and no data points.
Anderson Banihirwe (Nov 19 2020 at 19:02):hmmm... :thinking: something went wrong..... What is the output of dfWXT.head()?
Muntaha Pasha (Nov 19 2020 at 19:03):So dfWXT.head() shows the same thing as the image I sent above
Muntaha Pasha (Nov 19 2020 at 19:04):And if I do dfWXT.info() the datetime is no longer a column in my DF
Anderson Banihirwe (Nov 19 2020 at 19:05):It sounds like I broke your code.... Try re-running everything up to the pd.to_datetime(....) invocation...
Anderson Banihirwe (Nov 19 2020 at 19:06):And then let me know what dfWXT.head() gives you
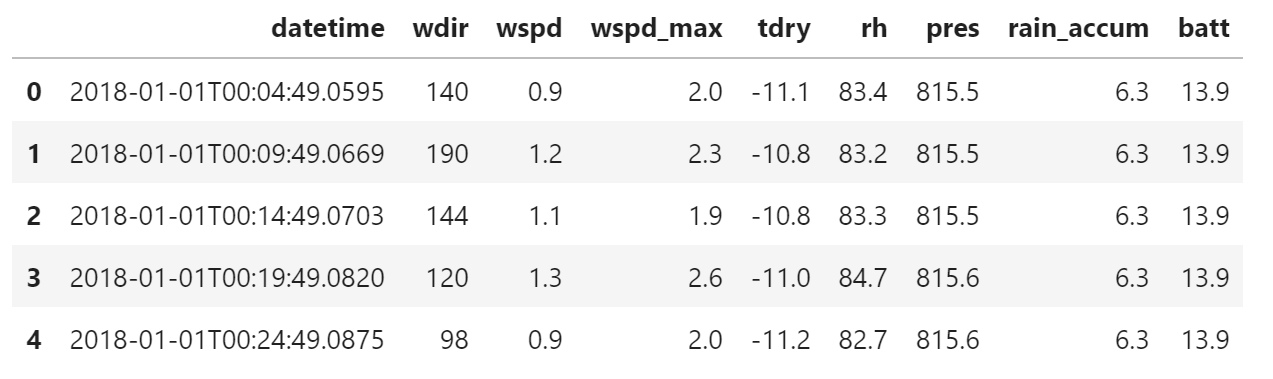
Muntaha Pasha (Nov 19 2020 at 19:07):Capture.PNG
Alright! after re-running, this is the head of my dataframe.
Muntaha Pasha (Nov 19 2020 at 19:08):this doesnt include your commands you sent earlier. I havent run those yet.
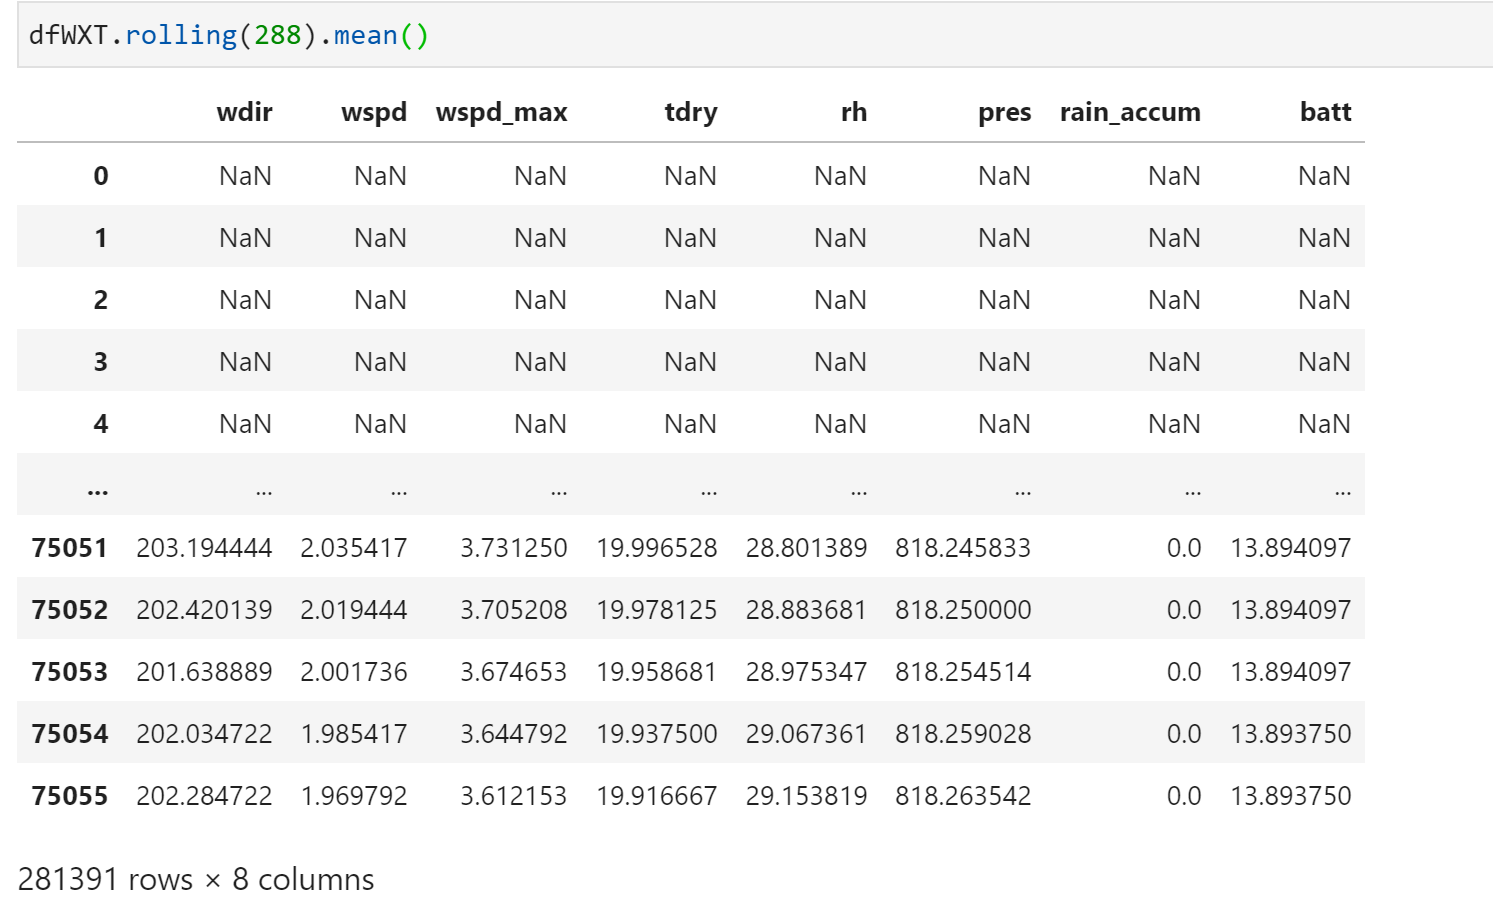
Anderson Banihirwe (Nov 19 2020 at 19:15):does dfWXT.rolling(288).mean() return anything?
Anderson Banihirwe (Nov 19 2020 at 19:17):And if I do dfWXT.info() the datetime is no longer a column in my DF
This is expected because after dfWXT = dfWXT.set_inde('datetime'), datetime is no longer a column but an index...
Muntaha Pasha (Nov 19 2020 at 19:17):Capture.PNG This is the results from rolling
Anderson Banihirwe (Nov 19 2020 at 19:29):Because I want to graph the data day by day, I need to take the average wind speed for every 288th data points. (Since there are 288 5-minute intervals in one day).
Is it the case that you actually want to compute an average for each day, and not a daily running average?
Anderson Banihirwe (Nov 19 2020 at 19:30):I am asking because I just realized that I may have misinterpreted your original question :slight_smile:
Anderson Banihirwe (Nov 19 2020 at 19:31):If you want to compute daily average, you can try this:
dfWXT['datetime'] =  pd.to_datetime(dfWXT['datetime'])
dfWXT.groupby(dfWXT.datetime.dt.date).mean()
Muntaha Pasha (Nov 19 2020 at 19:39):Yes! This is perfect! Sorry for the confusion. This is what I want. The average of wind speed by each day.
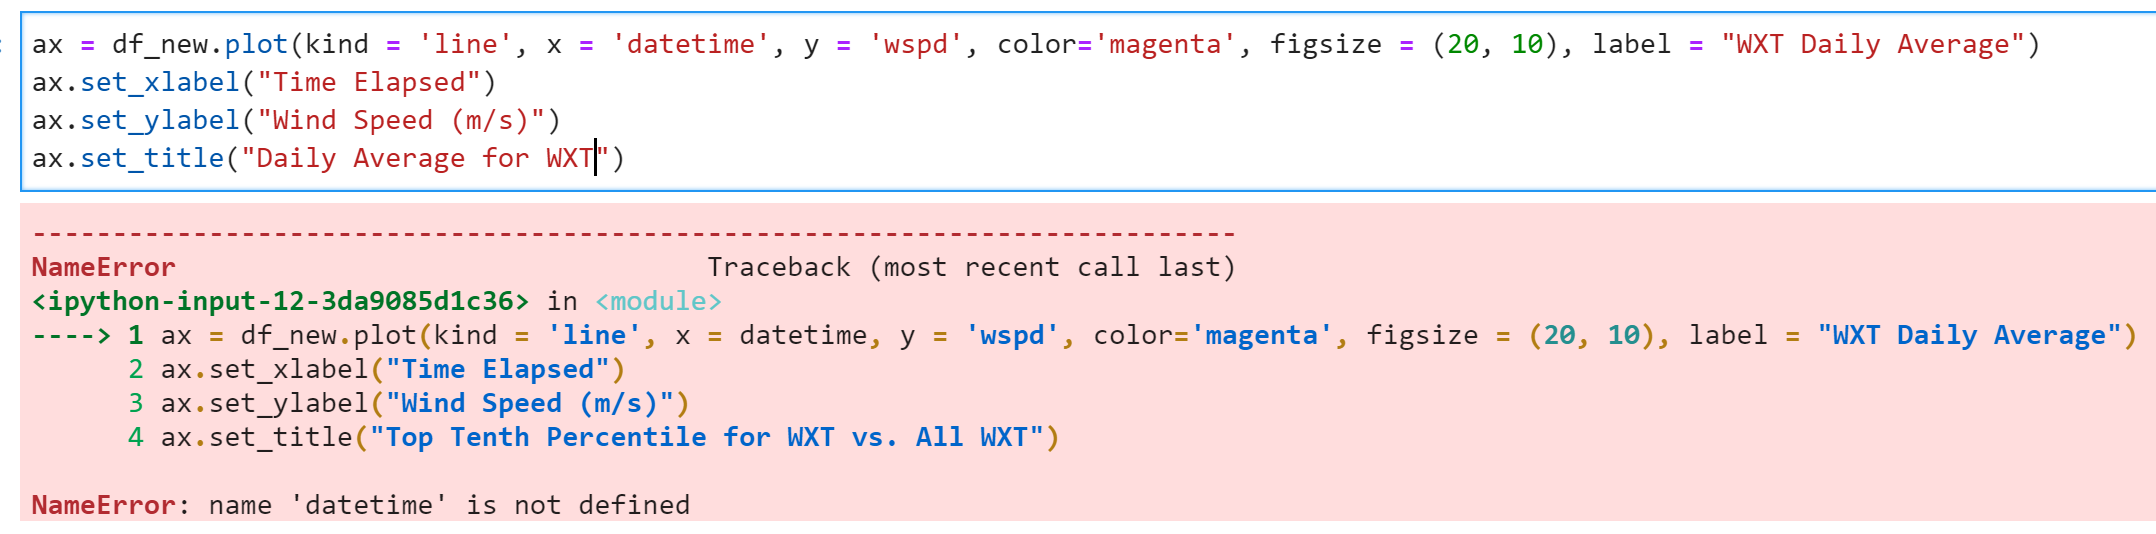
My only question now is when I want to graph it, what should I set "x" as? Since datetime is no longer a column but Capture.PNG an index.
Muntaha Pasha (Nov 19 2020 at 19:41):Ah, nevermind. I will leave x out. It will automatically do it by datetime.
Thank you for your help!!
Anderson Banihirwe (Nov 19 2020 at 19:44):My only question now is when I want to graph it, what should I set "x" as? Since datetime is no longer a column but
You can reset the index to turn datetime into a column again:
df.groupby(df.datetime.dt.date).mean().reset_index()
Anderson Banihirwe (Nov 19 2020 at 19:45):Yes! This is perfect! Sorry for the confusion.
Of course! Glad we got it to work as expected
Last updated: May 16 2025 at 17:14 UTC