Stephen Yeager (Aug 06 2021 at 23:27): Stephen Yeager (Aug 06 2021 at 23:27):
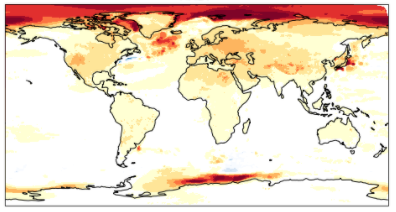
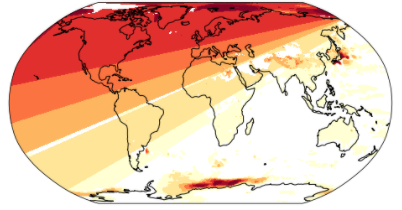
I am using matplotlib to plot CAM ne120 data. This CAM grid is unstructured, so surface temperature (TS) and lat/lon all have dimensions (ncol: 777602). The tricontourf method works fine for cartopy's crs.PlateCaree() projection, but has a problem with crs.Robinson (see below). I don't know if it's a cyclic point issue, but add_cyclic_point from cartopy.util chokes on ne120 data. Any ideas how to fix this?
Screen-Shot-2021-08-06-at-5.24.14-PM.png Screen-Shot-2021-08-06-at-5.24.33-PM.png
Daniel Marsh (Aug 07 2021 at 14:05):Is it an issue with the number of points or in general? I was able to get crs.Robinson to work with the tripcolor method on 48600 points. See last plot here: /glade/u/home/marsh/demo/se_plot.ipynb
It is slow - can't imagine how much slower it will get with 777K points.
Max Grover (Aug 09 2021 at 16:41):@Stephen Yeager could you share the path to that notebook?
Stephen Yeager (Aug 09 2021 at 16:59):@Max Grover Here's a short, simple notebook that illustrates the issue by comparing global contour maps for 3 different CAM grids:
/glade/u/home/yeager/analysis/python/Robinson.ipynb
@Daniel Marsh Thanks for the pointer to your notebook. Mine computes a Triangulation object via the tricontourf method and doesn't take long at all for NE120 (see above notebook). But the result is flawed...
Daniel Marsh (Aug 09 2021 at 17:31):@Stephen Yeager If I understand your code, it's having to calculate a triangulation on each call to tricontourf(), whereas I do it once ahead of calling tripcolor(). So you'd think my code might be faster in the end.
Stephen Yeager (Aug 09 2021 at 17:58):I added a cell to my notebook that uses tripcolor() instead of tricontourf(). It takes much longer (~11 minutes as opposed to ~8s), but it does generate a reasonable-looking Robinson plot.
Last updated: May 16 2025 at 17:14 UTC