David Bailey (Sep 24 2021 at 18:49): David Bailey (Sep 24 2021 at 18:49):
I am just trying to do a contourf NH projection of sea ice concentration. I am just trying to use matplotlib and keep it simple. This is an example for a reporter to see for using the CESM1-LENS data. I am not getting anything on my plot and I am confused about needing meshgrid or not. The code is very straightforward. Anyone have some thoughts on it?
import os
import numpy as np
import xarray as xr
from mpl_toolkits.basemap import Basemap
import matplotlib.pyplot as plt
dset = xr.open_dataset('icefracLE-09-2080.nc')
icefrac = dset['ICEFRAC'][0,:,:]
lat = dset['lat'][:]
lon = dset['lon'][:]
lons, lats = np.meshgrid(lon, lat)
map = Basemap(projection='npstere',lon_0=0,lat_0=90,boundinglat=50,resolution='l')
x,y = map(lons,lats)
cs = map.contourf(x,y,icefrac,30,cmap=plt.cm.jet)
plt.show()
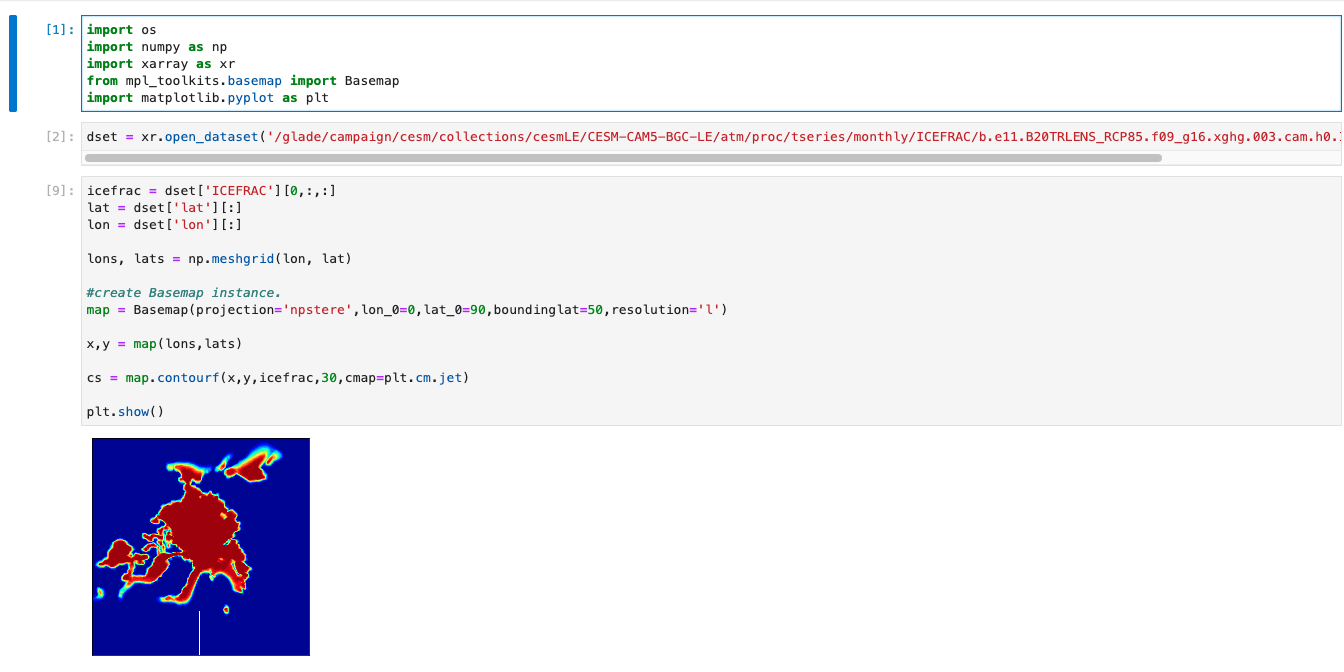
Max Grover (Sep 24 2021 at 19:22):I was able to run this on the JupyterHub running the following
import os
import numpy as np
import xarray as xr
from mpl_toolkits.basemap import Basemap
import matplotlib.pyplot as plt

dset = xr.open_dataset('/glade/campaign/cesm/collections/cesmLE/CESM-CAM5-BGC-LE/atm/proc/tseries/monthly/ICEFRAC/b.e11.B20TRLENS_RCP85.f09_g16.xghg.003.cam.h0.ICEFRAC.200601-208012.nc')

icefrac = dset['ICEFRAC'][0,:,:]
lat = dset['lat'][:]
lon = dset['lon'][:]

lons, lats = np.meshgrid(lon, lat)

#create Basemap instance.
map = Basemap(projection='npstere',lon_0=0,lat_0=90,boundinglat=50,resolution='l')

x,y = map(lons,lats)

cs = map.contourf(x,y,icefrac,30,cmap=plt.cm.jet)

plt.show()
Are you running this from a script? If so, you may want to save out the png (plt.savefig('fig_title.png' screenshot_ice_image.png )
David Bailey (Sep 24 2021 at 19:35):Interesting. I am running this from a script. Here is what I get. icefrac.png Note that when I try to run this with python3 I get the following error. So, I switch to python2.7.9 and it runs, but just not the right thing.
(NPL) [dbailey@cheyenne6 ~/for_kati]> python ice_north.py
Traceback (most recent call last):
File "ice_north.py", line 6, in <module>
from mpl_toolkits.basemap import Basemap
File "/glade/u/apps/ch/opt/python/3.7.9/gnu/9.1.0/pkg-library/20201220/lib/python3.7/site-packages/mpl_toolkits/basemap/__init__.py", line 50, in <module>
from .proj import Proj
File "/glade/u/apps/ch/opt/python/3.7.9/gnu/9.1.0/pkg-library/20201220/lib/python3.7/site-packages/mpl_toolkits/basemap/proj.py", line 6, in <module>
from matplotlib.cbook import dedent
ImportError: cannot import name 'dedent' from 'matplotlib.cbook' (/glade/u/apps/ch/opt/python/3.7.9/gnu/9.1.0/pkg-library/20201220/lib/python3.7/site-packages/matplotlib/cbook/__init__.py)
David Bailey (Sep 24 2021 at 19:36):I am also using the ncar_pylib environment on casper.
Max Grover (Sep 24 2021 at 19:52):@David Bailey could you point me to the path of the data file you are using?
David Bailey (Sep 24 2021 at 19:52):Sure. /glade/u/home/dbailey/for_kati/ice_north.py
Dave
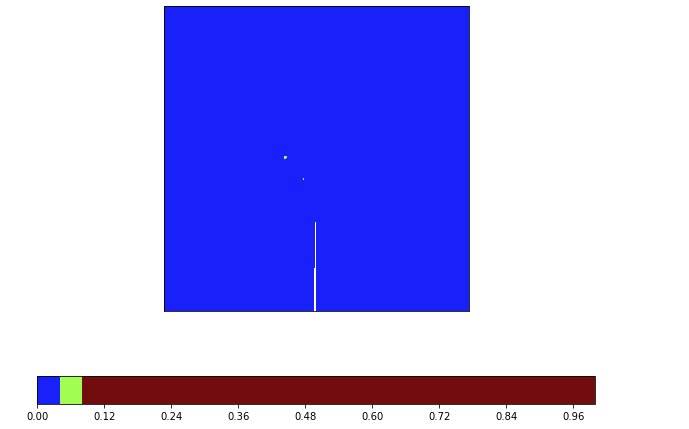
David Bailey (Sep 24 2021 at 19:57):Haha. Nevermind. I was looking at 2080 in the RCP8.5 and there is no ice left in the NH in September.
Max Grover (Sep 24 2021 at 19:59):Yeah - that's what I was about to respond with... there is on small area with ~0.04 (4%), but that's it Screen-Shot-2021-09-24-at-1.59.37-PM.png
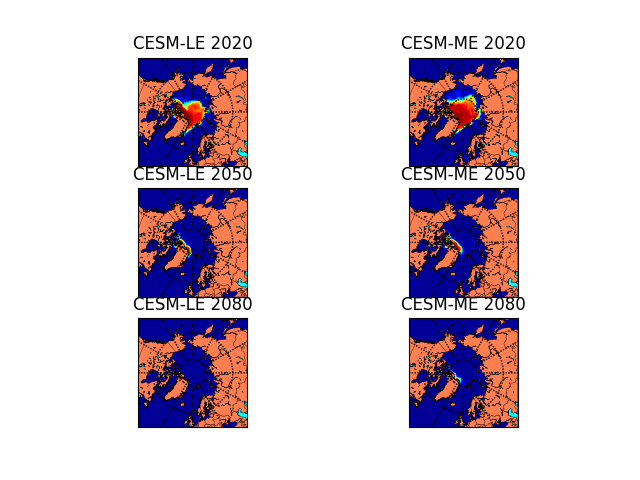
David Bailey (Sep 24 2021 at 20:55):Got it worked out now and getting the plot I was expecting. icefrac.png
Last updated: May 16 2025 at 17:14 UTC