Brendan Myers (Sep 19 2023 at 18:00): Brendan Myers (Sep 19 2023 at 18:00):
Hi everybody,
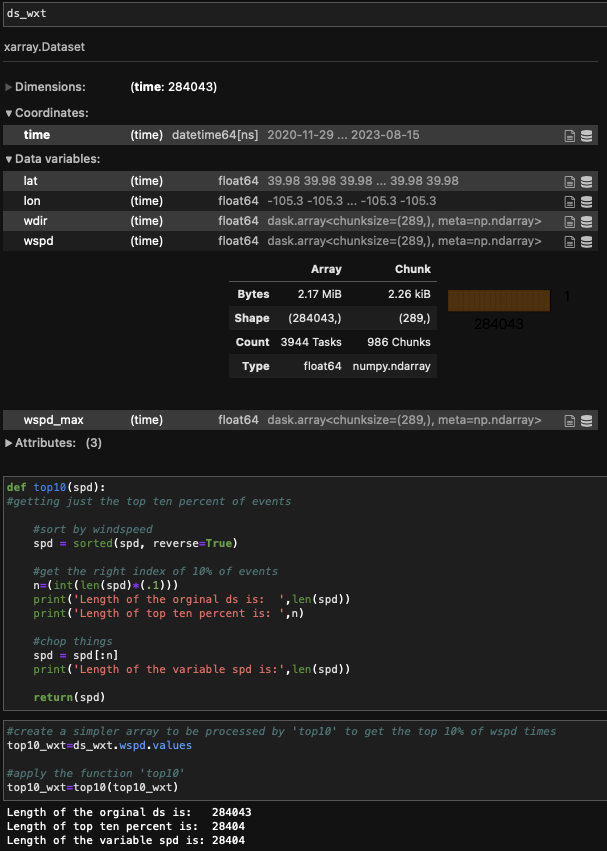
This feels like a very basic thing that I'm trying to do, and I feel good about how I'm trying to do it but for some reason, it's not working out. I'm just trying to take an xarray dataset of anemometer data that has multiple variables, and chop the whole dataset to only be the times where 'wspd' is in it's top 10%. Take a look at the screenshots of code that I've attached and let me know if you see where I'm going wrong, or if there is just a better way to be going about this! Thanks so much!
Screenshot-2023-09-19-at-10.48.11-AM.png
Screenshot-2023-09-19-at-10.48.44-AM.png
Katie Dagon (Sep 19 2023 at 20:19):I'm not sure if this will fix things, but you could consider using .quantile in conjunction with .where to subset the data. I think the top 10% would be something like:
ds_wxt.wspd.where(ds_wxt.wspd > ds_wxt.wspd.quantile(0.9, dim='time'))
Sam Rabin (Sep 20 2023 at 14:58):I'm not 100% sure what the "correct" outcome is or what outputs are showing the "incorrect" behavior, but I do have a question: What is drop=True supposed to be doing in the where() call? I don't see that in the documentation. What happens if you leave it out?
If you're trying to remove the data points that are outside the top 10%, I think you need to do top10_wxt = ds_wxt.sel(time=np.where(ds_wxt.wspd >= min(top10_wxt)[0]))
Anna-Lena Deppenmeier (Sep 20 2023 at 15:21):@Sam Rabin drop=True causes it to drop the timesteps/coordinate points when the condition is not true, so it shortens your array. Otherwise you get the same size array but with nans where the condition is not true.
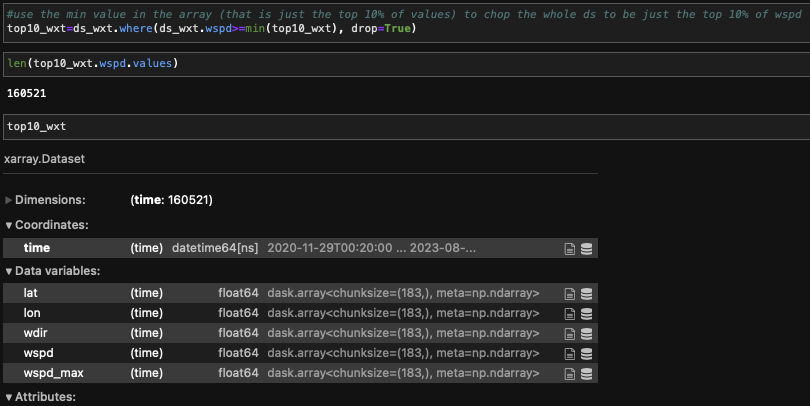
Anna-Lena Deppenmeier (Sep 20 2023 at 15:26):@Brendan Myers do you infer incorrect behaviour from the fact you don't retain 10% of the timesteps? I would have a look at what your minimum value in your inferred top 10% is, I don't know the function top10. Is this function the reason you need to use values instead of an xarray?
Brendan Myers (Sep 20 2023 at 20:39):@Anna-Lena Deppenmeier it seems incorrect to me since the length that the ds in the end is 160521, when I expect it to be 28404 (since that's 10% of the length of the original ds). The function 'top10' is the function that I write in the first screenshot (to get a list of the values of the fastest 10% of times). I'm taking things out of xarray to work with them because the xarray functions don't seem to be working because of something going on since the variables are stored as dask arrays.
Anna-Lena Deppenmeier (Sep 20 2023 at 20:40):yeah that makes sense. have you tied what Katie suggested? I would use something like her syntax indeed
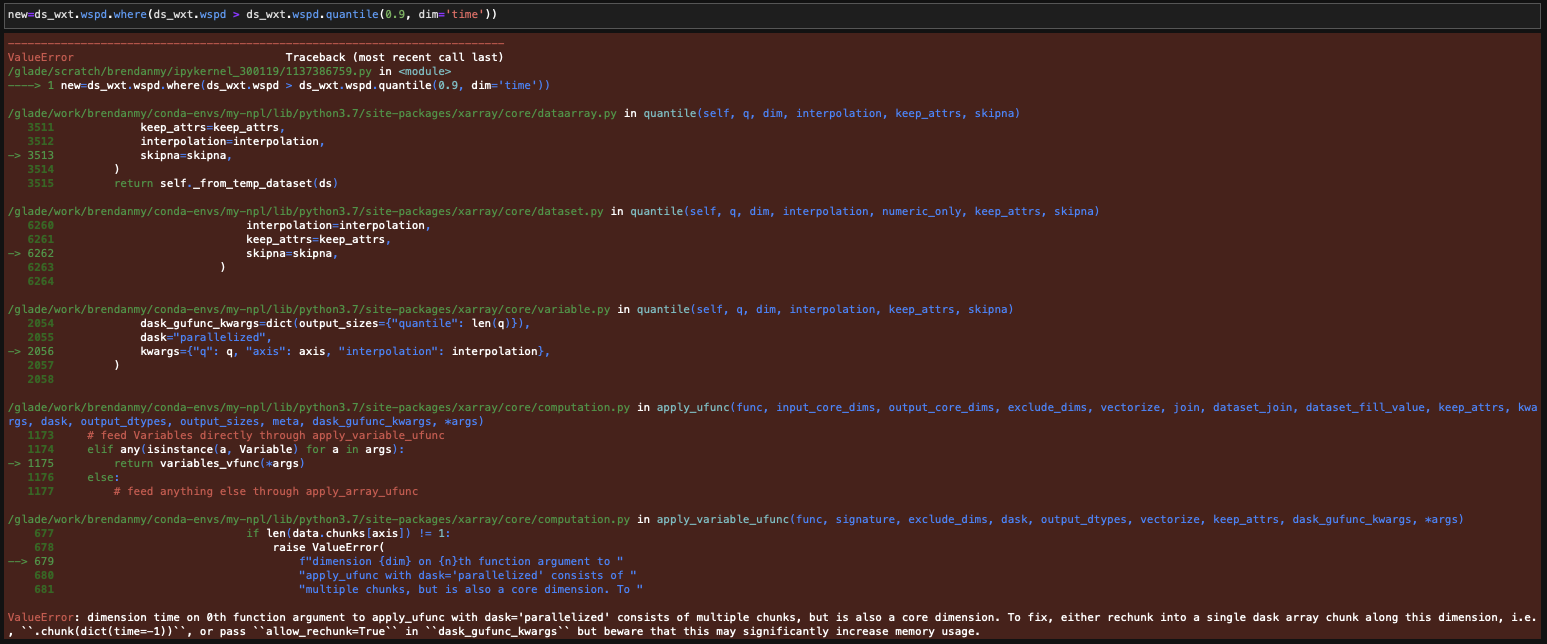
Brendan Myers (Sep 20 2023 at 20:42):@Katie Dagon I was trying to use quantile originally, but switched methods because it gives an error with something related to the dask chunking of the variable... I tried rechecking the variable but I remember it giving me some weird error. I've attached a screenshot of the error I get when I try to implement your line of code.
Screenshot-2023-09-20-at-1.38.50-PM.png
Katie Dagon (Sep 20 2023 at 20:44):Ah yes, you need to rechunk for quantile since you can't have chunking across time. Try this:
ds_wxt.wspd.where(ds_wxt.wspd > ds_wxt.wspd.chunk({'time': -1}).quantile(0.9, dim='time'))
Brendan Myers (Sep 20 2023 at 20:50):@Katie Dagon oh good to know! I'll try it once my Jupyter server starts up!
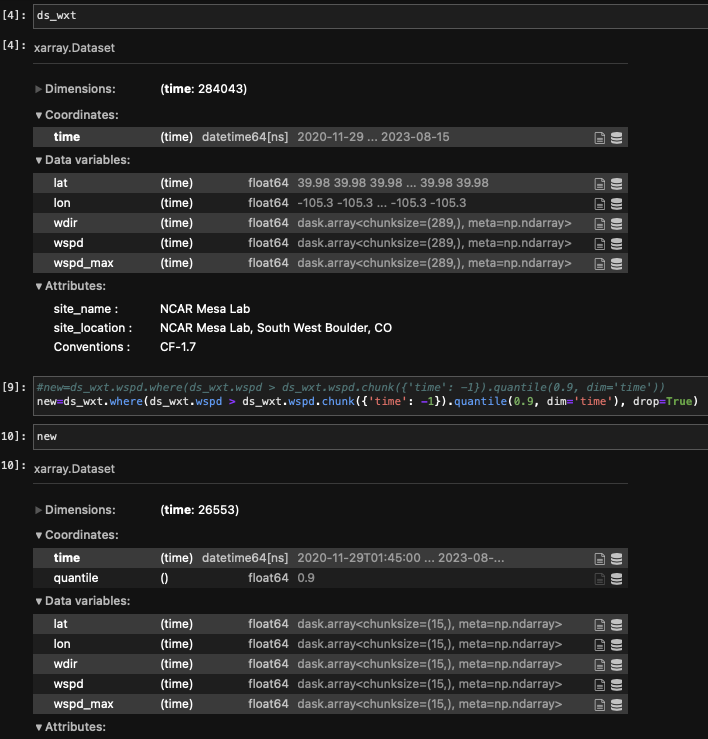
Brendan Myers (Sep 20 2023 at 21:18):@Katie Dagon that seems to have worked better! Thanks so much! The one thing is that it seems that it cut out more than I would've expected (just by a little bit), and if I remember correctly from when I was looking into 'quantile', I feel like I remember there are different options for how it handles duplicate values... do you think maybe that's why it cut out a little extra?
Screenshot-2023-09-20-at-2.13.43-PM.png
Katie Dagon (Sep 20 2023 at 21:31):Glad it 's working! It could be duplicates, NaNs, or perhaps the interpolation that happens when the quantile is between two data points, see xr.quantile. You could print out the quantile threshold (it should be a single number) or plot a histogram of the full dataset to get a better sense. The where statement is also using > instead of >= which might include more points.
Brendan Myers (Sep 20 2023 at 21:38):That all sounds great, thanks for the tips! I'll check things out! I appreciate the help!
Last updated: May 16 2025 at 17:14 UTC