Allison Baker (Apr 30 2021 at 17:21): Allison Baker (Apr 30 2021 at 17:21):
I am reading in a monthly CAM CESM-LENS file that starts Jan 1920, but when I look at the at time attributes in xarray, it looks like the first month is February -- not January. (I also tried a CESM-LENS2 file and found the same thing. I thought the first monthly average in this file was for Jan. I am trying to do annual averages so wanted to use this info (also to weight by days in month). Can someone tell me what I am missing here?
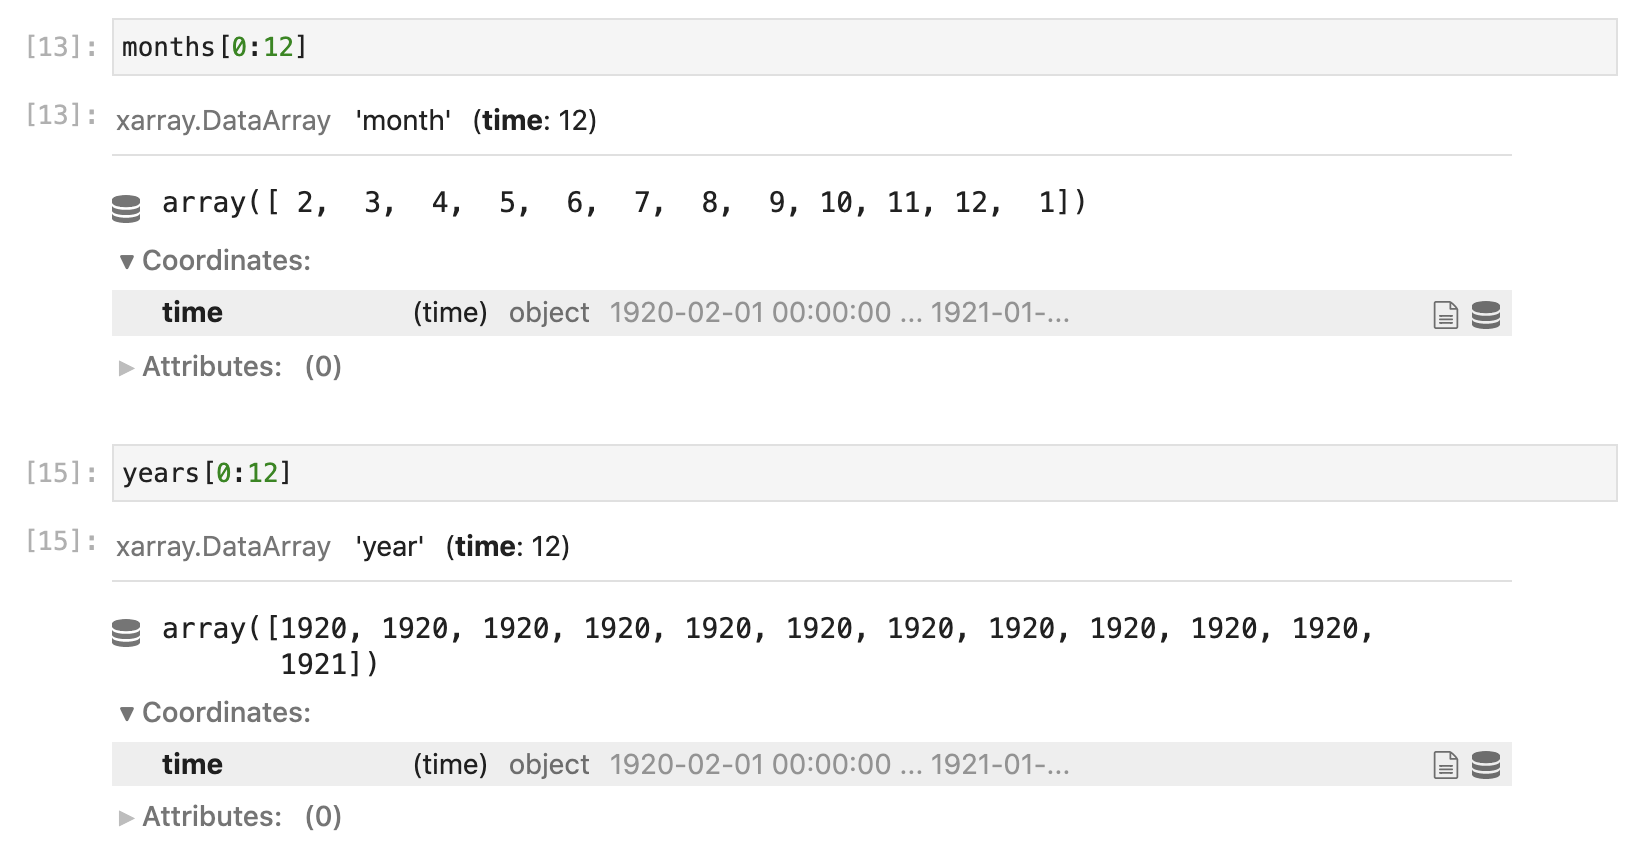
import xarray as xr
filename = '/glade/collections/cdg/data/cesmLE/CESM-CAM5-BGC-LE/atm/proc/tseries/monthly/TS/b.e11.B20TRC5CNBDRD.f09_g16.011.cam.h0.TS.192001-200512.nc'
ds = xr.open_dataset(filename)
ts = ds['TS']
months = ts.time.dt.month
years = ts.time.dt.year
month_length = ts.time.dt.days_in_month
Then I get the following:
months.png
Anderson Banihirwe (Apr 30 2021 at 17:34):@Allison Baker, this is a well known issue when working with CESM data...The issue can be fixed by
n [25]: filename = '/glade/collections/cdg/data/cesmLE/CESM-CAM5-BGC-LE/atm/proc/tseries/monthly/TS/b.e11.B20TRC5CNBDRD.f09_g16.011.cam.h0.TS.192001-200512.nc'

In [26]: ds = xr.open_dataset(filename, decode_times=False)

In [27]: attrs = ds.time.attrs.copy()

In [28]: ds = ds.assign_coords(time= ds.time_bnds.mean('nbnd'))

In [29]: ds.time.attrs = attrs

In [30]: ds = xr.decode_cf(ds)
Anderson Banihirwe (Apr 30 2021 at 17:34):In [31]: ds Out[31]: <xarray.Dataset> Dimensions: (ilev: 31, lat: 192, lev: 30, lon: 288, nbnd: 2, slat: 191, slon: 288, time: 1032) Coordinates: * ilev (ilev) float64 2.255 5.032 10.16 18.56 ... 967.5 985.1 1e+03 * lat (lat) float64 -90.0 -89.06 -88.12 -87.17 ... 88.12 89.06 90.0 * lev (lev) float64 3.643 7.595 14.36 24.61 ... 957.5 976.3 992.6 * lon (lon) float64 0.0 1.25 2.5 3.75 ... 355.0 356.2 357.5 358.8 * slat (slat) float64 -89.53 -88.59 -87.64 ... 87.64 88.59 89.53 * slon (slon) float64 -0.625 0.625 1.875 3.125 ... 355.6 356.9 358.1 * time (time) object 1920-01-16 12:00:00 ... 2005-12-16 12:00:00
Anderson Banihirwe (Apr 30 2021 at 17:34):In [32]: ds.time.dt.month Out[32]: <xarray.DataArray 'month' (time: 1032)> array([ 1, 2, 3, ..., 10, 11, 12]) Coordinates: * time (time) object 1920-01-16 12:00:00 ... 2005-12-16 12:00:00
Deepak Cherian (Apr 30 2021 at 17:35):FAQ time!
Anderson Banihirwe (Apr 30 2021 at 17:37):FAQ time!
Will submit a PR shortly
Allison Baker (Apr 30 2021 at 17:38):Thanks a lot! I have mostly been working with daily data so hadn't seen this...
Max Grover (Apr 30 2021 at 17:38):Thanks a lot! I have mostly been working with daily data so hadn't seen this...
Thanks for asking the question!
Katie Dagon (Apr 30 2021 at 18:09):Yes this is very helpful. I'll add that if you want to do this for land output, there are a couple of small tweaks you have to make based on how things are named. For Line [28] in @Anderson Banihirwe 's code above, I (think) it would be the following:
ds = ds.assign_coords(time=ds.time_bounds.mean('hist_interval'))
Keith Lindsay (Apr 30 2021 at 18:23):I have a function time_set_mid at
https://github.com/klindsay28/CESM2_coup_carb_cycle_JAMES/blob/22aa55e60471078922d96f07033adb326769e47a/src/utils.py#L69-L103
that resets time to the midpoints of time bounds. It works if decode_times was True or False, and works with different components of CESM that have different names for the time bounds variables. I also have a test suite for it at
https://github.com/klindsay28/CESM2_coup_carb_cycle_JAMES/blob/22aa55e60471078922d96f07033adb326769e47a/tests/test_utils.py#L49-L87
Anderson Banihirwe (Apr 30 2021 at 18:26):@Allison Baker, @Katie Dagon's shortcut works
In [11]: ds = xr.open_dataset(filename)

In [12]: ds = ds.assign_coords(time=ds.time_bnds.mean('nbnd'))
You may want to preserve your original attributes because xarray seems to throw those away during the ds = ds.assign_coords(time=ds.time_bnds.mean('nbnd'))
In [13]: ds.time.attrs
Out[13]: {}
Last updated: May 16 2025 at 17:14 UTC