Stephen Yeager (Aug 26 2020 at 19:14): Stephen Yeager (Aug 26 2020 at 19:14):
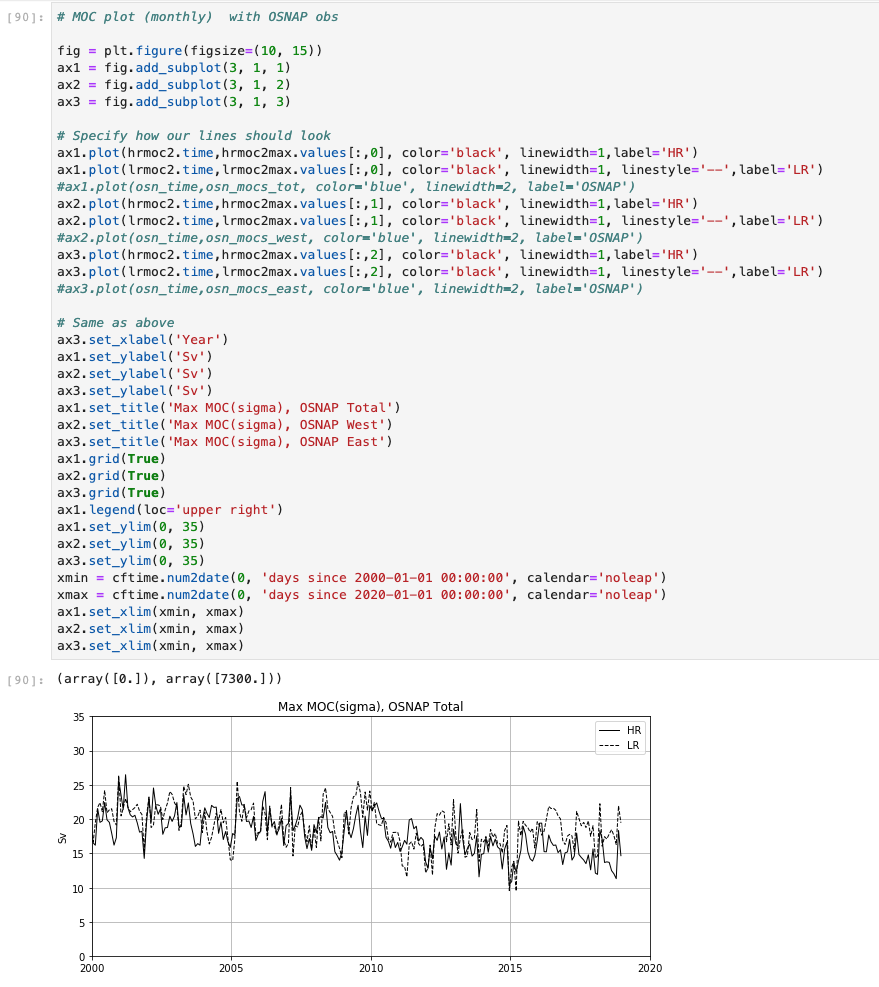
I'm trying to use xarray & matplotlib to generate a timeseries plot of model data (POP) along with observational data (OSNAP). The model data time axis is of type cftime.DatetimeNoLeap and the observational data has time axis of type datetime64. If I just plot model data, everything works and I get a nice plot:
Screen-Shot-2020-08-26-at-1.01.47-PM.png
When I uncomment the additional plot commands to plot OSNAP data, I get an error that says
ValueError: view limit minimum -52881.950000000004 is less than 1 and is an invalid Matplotlib date value. This often happens if you pass a non-datetime value to an axis that has datetime units
What do I do to make the different time axes compatible for plotting together?
Stephen Yeager (Aug 26 2020 at 19:51):I discovered a workaround which is to use cftime to convert the observational time axis to cftime.DatetimeNoLeap as follows:
ds_os1 = xr.open_dataset(f'{dir_osnap}/OSNAP_Transports_201408_201604_2018.nc',decode_times=False)
osn_cftime = cftime.num2date(ds_os1.TIME, ds_os1.TIME.units, calendar='noleap', only_use_cftime_datetimes=True)
I still be interested to hear how others handle such issues.
Deepak Cherian (Aug 26 2020 at 21:34):you can use the use_cftime option in open_dataset to specifically ask for CFTime (use_cftime=True). The default is None which tries numpy.datetime64 and if that fails uses CFtime. I don;t know if plotting two cftime variables with different calendars on the same axis works...
You can convert an existing CFTime thing to a numpy thing using ds.indexes["time"] = ds.indexes["time"].to_datetimeindex()https://xarray.pydata.org/en/stable/weather-climate.html#non-standard-calendars-and-dates-outside-the-timestamp-valid-range
Stephen Yeager (Aug 26 2020 at 22:33):I tried your suggestion #1 (which returned cftime.DatetimeGregorian) which plotted fine together with cftime.DatetimeNoLeap. Thanks.
Last updated: May 16 2025 at 17:14 UTC