Rosimar Rios-Berrios (May 24 2022 at 20:30): Rosimar Rios-Berrios (May 24 2022 at 20:30):
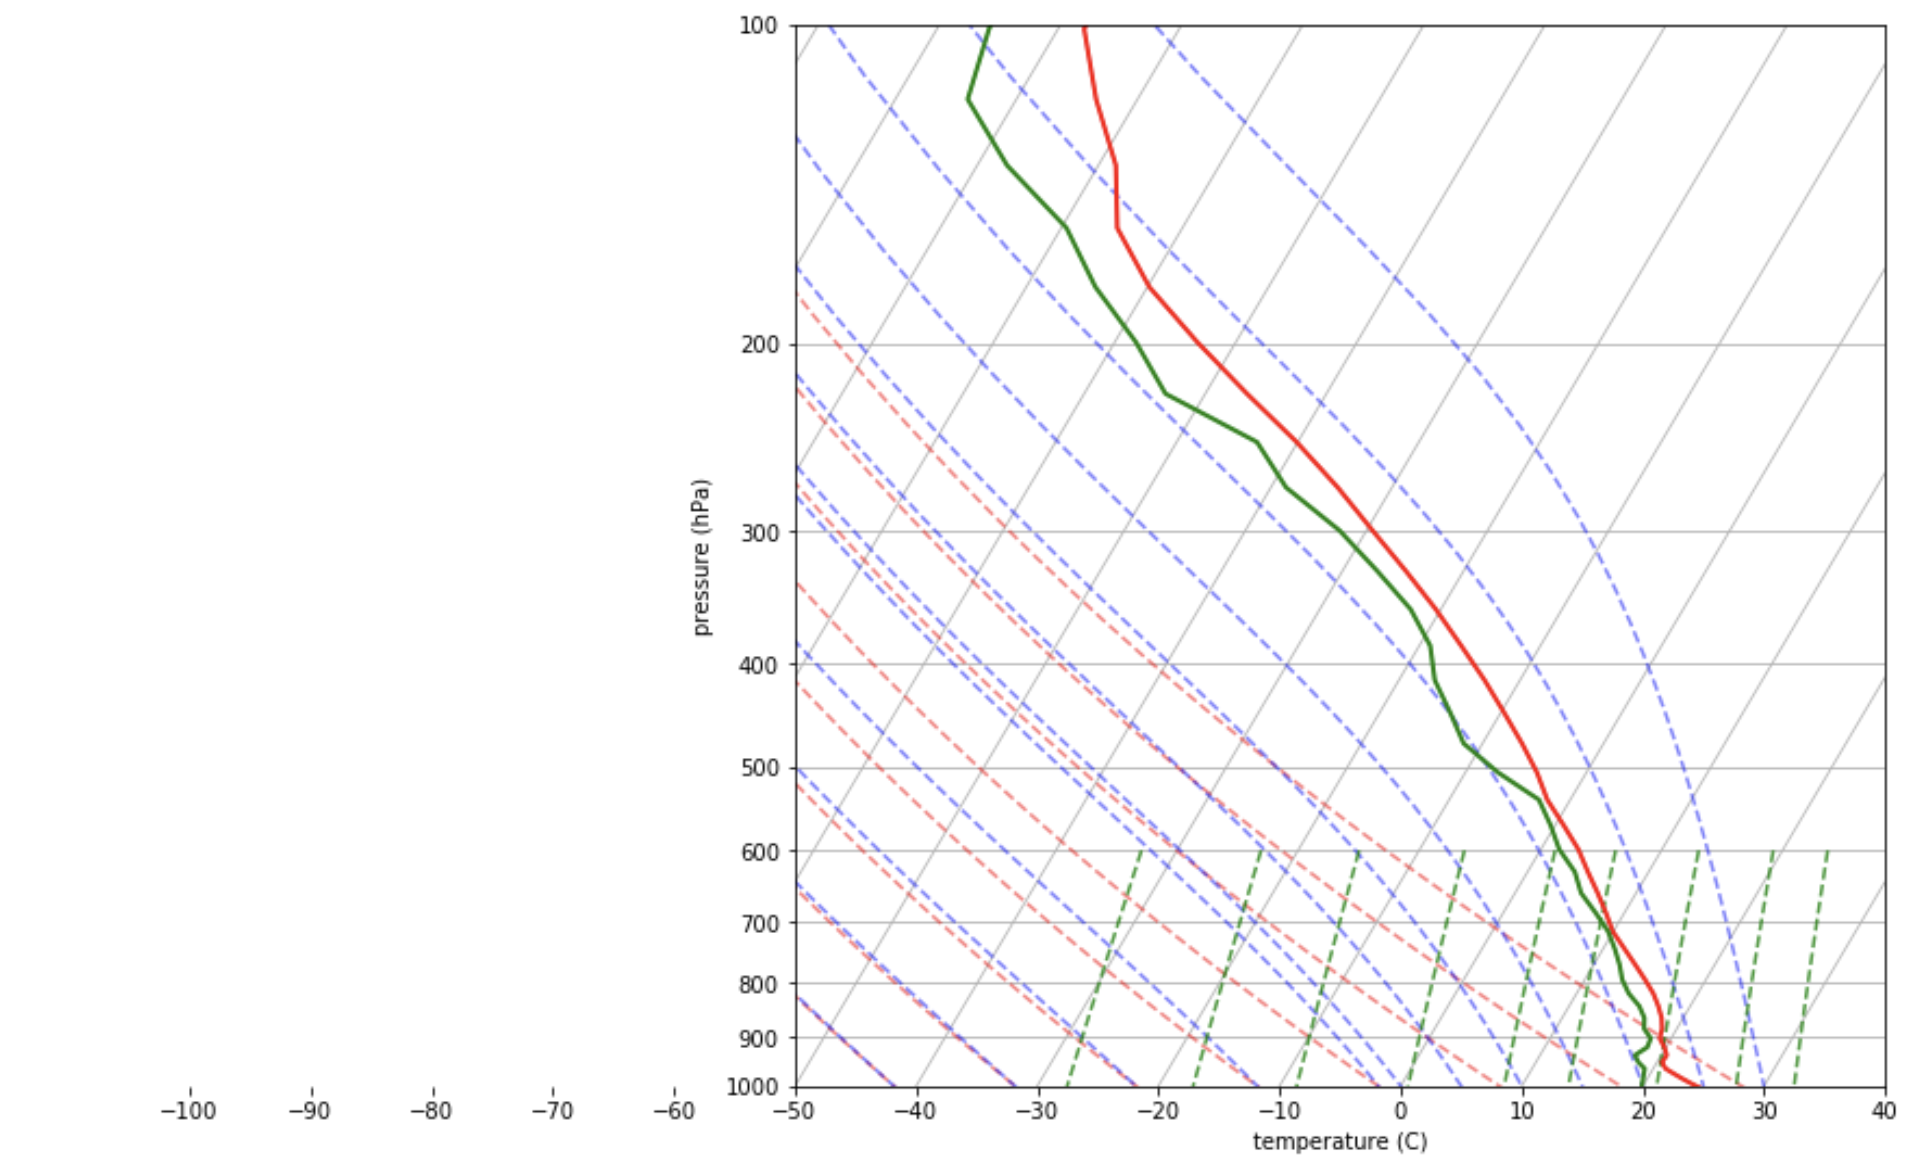
Hi! This question is probably for @Ryan May or anyone in the metPy team. I am using metPy to plot Skew-Ts from MPAS data. So far so good. The only issue I have is that the x axis goes off to some odd values. See figures attached. Does this look familiar? I've played with skew.ax.set_xlim and skew.ax.set_ylim to no avail. Any tips on how to fix this? Screen-Shot-2022-05-24-at-2.28.22-PM.png
Ryan May (May 24 2022 at 20:35):what version of MetPy and Matplotlib are you using? That looks reminiscent of an older bug.
Rosimar Rios-Berrios (May 24 2022 at 20:39):I'm using matplotlib v3.1.0 and metpy 0.10.0.
Rosimar Rios-Berrios (May 24 2022 at 20:40):Dang. My metpy is old...
Ryan May (May 24 2022 at 21:09):Any chance you can update MetPy to something in the 1.0 to 1.1 range? (MetPy >=1.2 needs Matplotlib 3.3)
Rosimar Rios-Berrios (May 24 2022 at 21:10):I'm trying to update with conda, but it only gets me as far as 0.11.1.
Ryan May (May 24 2022 at 21:15):What version of Python are you using?
Rosimar Rios-Berrios (May 24 2022 at 21:19):That was my next guess. I have version 3.7.3. Do you think I should update to 3.8?
Ryan May (May 24 2022 at 21:21):If you're updating Python, I'd go to the most recent you can (3.10 has been out since October). Having said that, MetPy <=1.2 supports Python 3.7. You could try to force it with conda install metpy=1.1. My guess is something in the environment is blocking it, but not sure what.
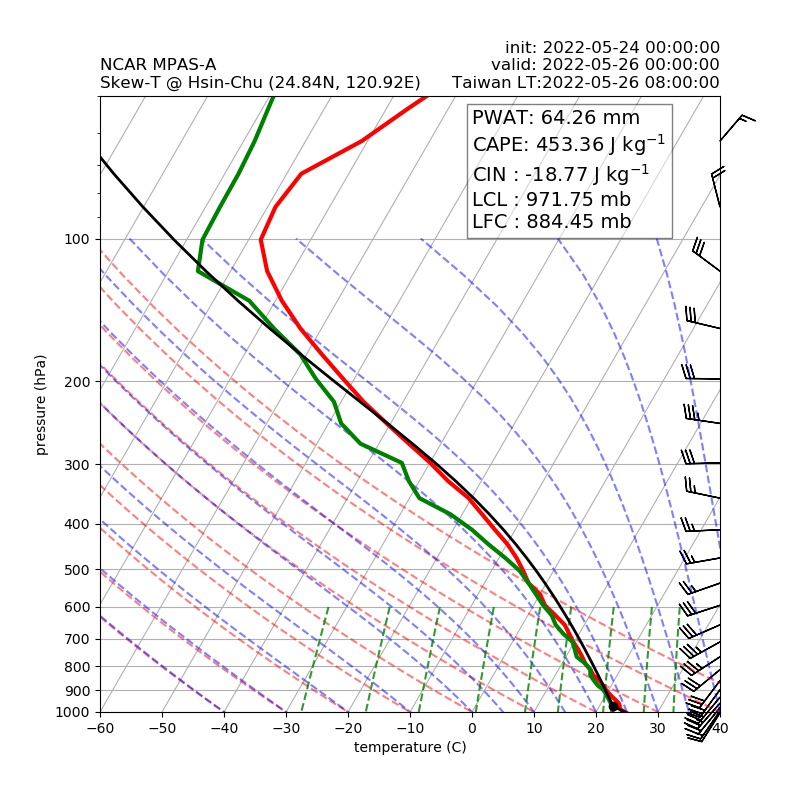
Rosimar Rios-Berrios (May 24 2022 at 22:01):Thank you! I'll look into updating my python (it's about time). At least I'm happy to report that the bug is gone with v0.11. test.jpg
Ryan May (May 24 2022 at 22:06)::tada:
Last updated: May 16 2025 at 17:14 UTC