Keith Lindsay (Aug 31 2020 at 23:43): Keith Lindsay (Aug 31 2020 at 23:43):
Hi,
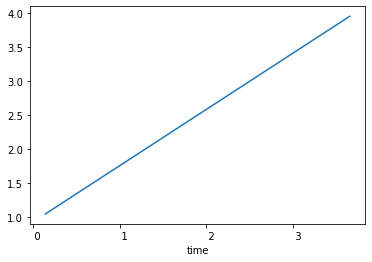
When I run the following code in a notebook, the horizontal time axis in the generated plot runs from 0 to ~4, instead of from 1 to 4 like the time values do. Any idea what's going wrong?
import cftime
import xarray as xr

time_vals = [cftime.DatetimeNoLeap(1+year, 1+month, 15)
             for year in range(3) for month in range(12)]

x_vals = [time_val.year + time_val.dayofyr / 365.0
          for time_val in time_vals]

x_da = xr.DataArray(x_vals, coords=[time_vals], dims=["time"])

x_da.plot();
Keith Lindsay (Sep 02 2020 at 20:55):FYI, I've filed an issue with xarray regarding this at
https://github.com/pydata/xarray/issues/4401
Matt Long (Sep 02 2020 at 20:56):@geocat, this appears to be a bug somewhere in xarray-->nc-time-axis-->matplotlib.
Last updated: May 16 2025 at 17:14 UTC