Falko Judt (May 18 2022 at 17:22): Falko Judt (May 18 2022 at 17:22):
I am using the "MPAS with Datashader and Geoviews" notebook from the @geocat-examples library to plot MPAS data. So far so good as global plots are concerned (it's actually pretty cool). Is there a way to start with a regional subdomain instead of the full globe? I am thinking of something like ax.set_extent([lon1, lon2, lat1, lat2]), which is what I use when plotting maps with cartopy. I know I could zoom in, but I am more interested in something that can be scripted.
Orhan Eroglu (May 18 2022 at 20:01):Hi @Falko Judt ! This is a great question and reminds me of a good potential study for our SIParCS intern who will be implementing some new notebooks for unstructured grid visualizations in the coming weeks. We will get him start to learn Datashader stack first, then this would make a great case.
Philip Chmielowiec (May 29 2022 at 04:43):Falko Judt said:
I am using the "MPAS with Datashader and Geoviews" notebook from the geocat-examples library to plot MPAS data. So far so good as global plots are concerned (it's actually pretty cool). Is there a way to start with a regional subdomain instead of the full globe? I am thinking of something like
ax.set_extent([lon1, lon2, lat1, lat2]), which is what I use when plotting maps with cartopy. I know I could zoom in, but I am more interested in something that can be scripted.
Hi @Falko Judt! The closest alternative that I found to ax.set_extent() is adding a xlim and ylim to our rasterized image options. Since the and coordinates don't directly map to physical lat/lon values, a little bit a manual searching is required to get your bounding box. However, once you have your and bounds ((, ) and (, )) you can do this:
rasterized = hds_rasterize(trimesh, aggregator='mean', precompute=True).opts(xlim=(x_left, x_right), ylim=(y_left, y_right))
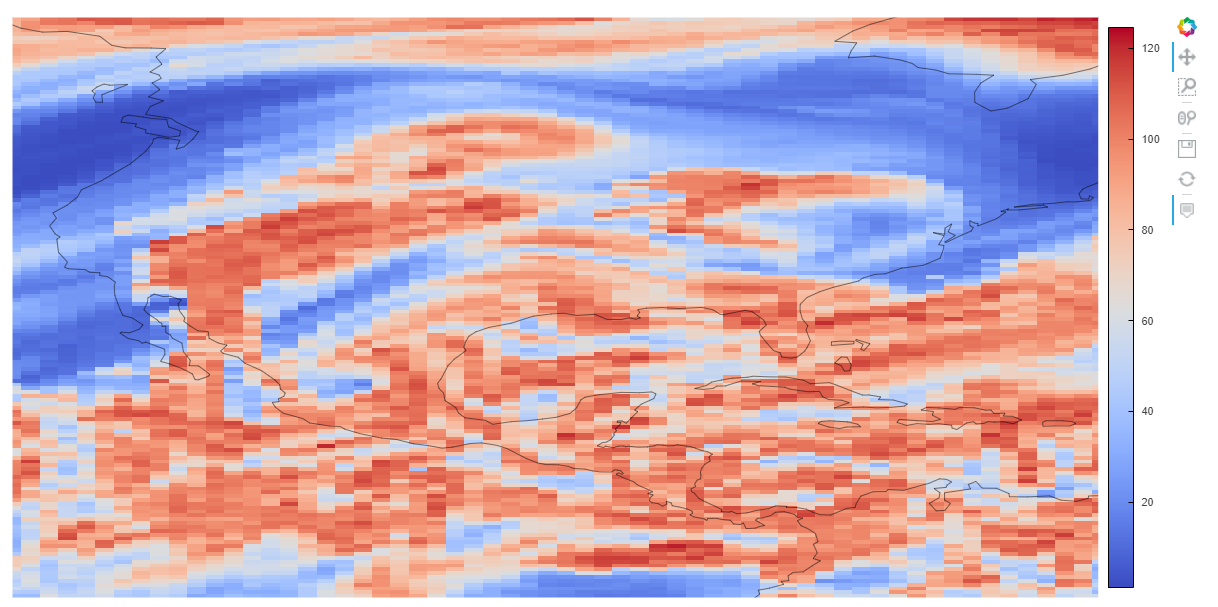
This will crop the global map between the the bounds that you set. It still allows you to scroll and zoom around, but initially restricts our image to that region. One issue that I've noticed is that it introduces some distortion when you zoom out, but I'll see if there's any way to fix that.
For example, I chose this pair to roughly get most of North and Central America: xlim=(-1.1e7, -6e6) and ylim=(0, 6.5e6)
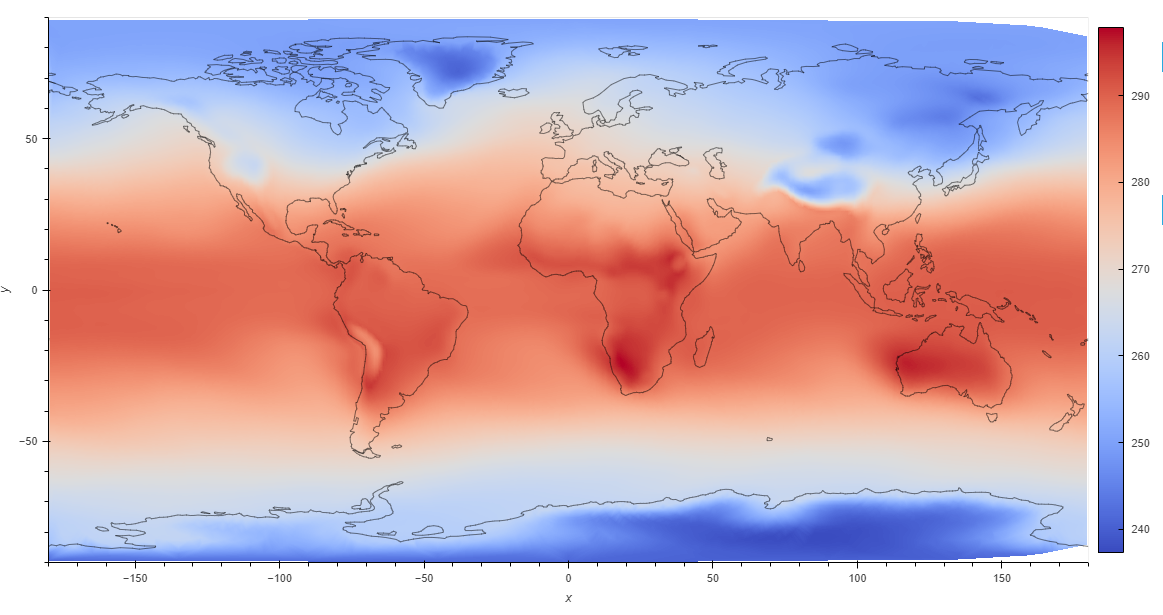
Philip Chmielowiec (Jun 01 2022 at 20:52):Using the PlateCarree projection actually gets rid of the manual selection issue, you can use lat/lon values as your bounding points and it should map 1:1 to the x/y pixels in the image. image.png
Last updated: May 16 2025 at 17:14 UTC