Allison Baker (Jan 22 2024 at 22:17): Allison Baker (Jan 22 2024 at 22:17):
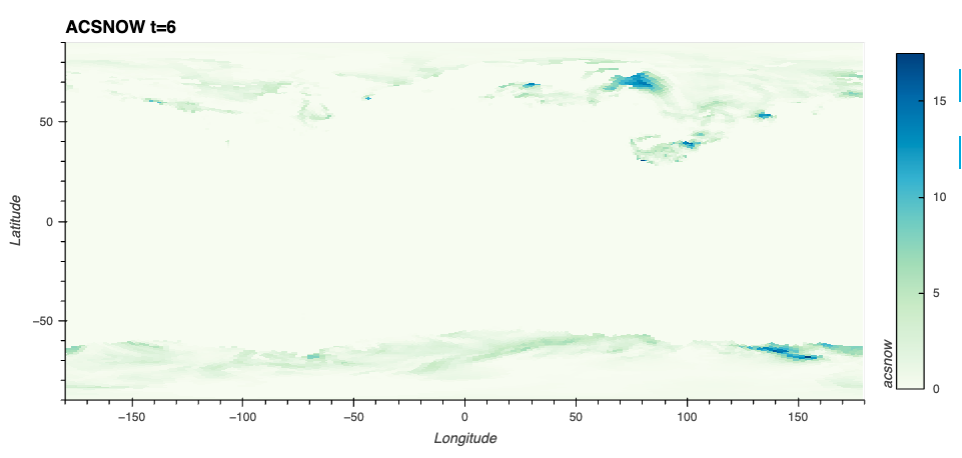
I made my first plot using uxarray and mpas data. It looks great, but now I'm wondering if there is a way to change the name of the label on the colorbar? I'd like it to show the units instead of the variable name. Thanks!
uxds1['acsnow'].sel(Time=6).plot.rasterize( width=900, height=400,title = "ACSNOW t=6", cmap = "GnBu")
Katelyn FitzGerald (Jan 22 2024 at 23:06):I believe you should be able to do something like uxds1["acsnow"].sel(Time=6).plot.rasterize(clabel='my new colorbar label'), but it looks like you might have hit a rough edge here (I'm getting an unexpected error with this - going to log it now).
Philip Chmielowiec (Jan 22 2024 at 23:20):Hi @Allison Baker
This is definitely a bug. See https://github.com/UXARRAY/uxarray/issues/671 for details
We'll have this patched for the next release.
Allison Baker (Jan 22 2024 at 23:34):Thanks for your help.
One more uxarray question for the same data. When I try to use datashade, it seems to ignore the cmap specification, but I don't get an error message. Am I specifying it correctly?
uxds1['acsnow'].sel(Time=6).plot.datashade(agg = "mean", plot_height = 500, plot_width = 1000, cmap = 'GnBu)
Orhan Eroglu (Jan 23 2024 at 00:09):I can confirm specifying a colormap didn't work for me either even though we should have that support. Will look further into this
Katelyn FitzGerald (Jan 23 2024 at 02:10):It looks like there's a typo in the signature that causes keyword args to be ignored. Just put in a quick issue+PR.
Orhan Eroglu (Jan 23 2024 at 02:25):Yes, I can also see that now. I'll put in an issue+PR for this. Thanks a lot for pointing that out!
Orhan Eroglu (Jan 23 2024 at 02:45):Created uxarray PR #675 to fix this. I confirmed locally that the PR changes made the cmap of preference in the function call show up in the plot
Allison Baker (Jan 23 2024 at 16:57):Thank you all! (Sorry about the typo- wasn't in my actual code)
Orhan Eroglu (Jan 23 2024 at 17:50):Hey Allison, the PR has been merged into the UXarray main branch. If you don't want to wait until February's version (we might also consider a sooner incremental January version depending on the amount of work being merged in the meantime), you can install it from the code into your environment and get the function up for you
Last updated: May 16 2025 at 17:14 UTC