Michael Levy (Jul 18 2020 at 15:16): Michael Levy (Jul 18 2020 at 15:16):
Hopefully this topic will eventually be useful for updates on how much of the run is complete and where the output is... but for this first post I'll just complain that every time I submit a job it dies with
-1:MPT: Launch error on r7i0n0.ib0.cheyenne.ucar.edu
-1:dplace failed. Verify that the numatools module is loaded.
-1:MPT ERROR: could not run executable.
-1:     (HPE MPT 2.21  11/28/19 04:22:45)
MPT: Launch error on r7i1n28.ib0.cheyenne.ucar.edu
I have a ticket open with CISL (RC-4009), hopefully it's addressed soon. I've verified that an earlier case with the same .env_mach_specific.sh ran before the maintenance window so I don't think it's anything on my end.
Keith Lindsay (Jul 18 2020 at 18:35):FYI, I also get the error
dplace failed. Verify that the numatools module is loaded.
MPT ERROR: could not run executable.
in a G1850ECO compset with grid=T62_g17 in CESM 2.1.3. So the error is not specific to hi-res or CESM 2.2.
Keith Lindsay (Jul 19 2020 at 11:13):Message from Rory Kelly: We have put a fix in place which corrects the issue, at least in our testing. When you get a chance, please confirm that this has fixed the issue for you -- or more importantly if you are still seeing failures.
Their fix works for my G1850ECO.T62_g17 compset with CESM 2.1.3.
Michael Levy (Jul 20 2020 at 05:00):I just started the three-month job and it got through day one. It looks to be going slower than the trial one-month runs I ran earlier, but we made a few changes while the machine was down: turning off iage and cvmix to match Alper's configuration (both of which should speed things up), but also turning tidal mixing on (will be more expensive) and switching from centered to upwind3 advection for a few tracers (would this affect computational cost?) Anyway, I'm seeing a 10% - 12% increase in runtime through the first couple days; it should still fit in the walltime I specified, but it'll be closer than I would like. I'll bump up to 11 hour requests for future runs.
Michael Levy (Jul 20 2020 at 05:01):Caseroot: /glade/work/mlevy/hi-res_BGC_JRA/cases/g.e22.G1850ECO_JRA_HR.init_from_obs
Run dir: /glade/scratch/mlevy/g.e22.G1850ECO_JRA_HR.init_from_obs/run
Keith Lindsay (Jul 20 2020 at 13:08):upwind3 advection is indeed more expensive than centered advection.
Have you looked at individual timers in ocn.log files? That would inform if the cost increase is in advection or elsewhere (or across the board).
Michael Levy (Jul 20 2020 at 13:17):I think these numbers are from the first day (I searched for Timer in the logs and compared the first set of numbers in my current run to one of my one-month timing runs). There was a 40 second increase for the TOTAL timer; In the old run, ADVECTION_TRACER_CENTERED took 12 seconds compared to 43 for ADVECTION_TRACER, while VMIX_COEFFICIENTS_KPP dropped from 38 seconds to 25. So that's about half of the total increase, and the rest of the increase seems to be spread evenly across the board? The POP <-> MARBL exchanges before interior_tendency_compute() were ~6 seconds slower, MARBL tavg was a couple seconds slower, etc etc
Michael Levy (Jul 20 2020 at 13:29):Still on pace to squeak in just under the 10 hour limit (and I emailed CISL-help last night to see if they could bump my wallclock limit to 11 hours, just in case...) One interesting result is that I'm not seeing nearly the increase from writing the monthly history files in the new run as I am in the old; the last time step in the one-month run was ~90 seconds longer than the previous ones, while the end-of-Jan and end-of-Feb timesteps in my current run blend in to the noise (~8 seconds longer than average, but other timesteps have taken longer). I haven't written any restarts yet, and I suspect glade is less busy in the middle of the night on a weekend immediately following maintenance, but it would be nice if the machine-room maintenance resulted in glade being more stable and faster to access
Michael Levy (Jul 20 2020 at 15:16):The first three months finished, but @Keith Lindsay, @Matt Long, and I talked about changing the initial conditions so that the non-WOA tracers are initialized from Kristen's JRA cycles rather than the fully-coupled control. So I've moved the output from my three months to /glade/scratch/mlevy/archive/g.e22.G1850ECO_JRA_HR.init_from_obs.old; I'll keep that around until space becomes an issue
Michael Levy (Jul 20 2020 at 23:34):Okay, I have two cases built and in the queue:
/glade/work/mlevy/hi-res_BGC_JRA/cases/g.e22.G1850ECO_JRA_HR.init_from_obs/glade/work/mlevy/hi-res_BGC_JRA/cases/g.e22.G1850ECO_JRA_HR.init_from_g.e22b05.G1850ECOIAF_JRA.TL319_g17.cocco.001They differ only in init_ecosys_init_file, hopefully the case names are reasonable and self-explanatory. After the first three months finish for each of them, I'll comment out the changes to init_ecosys namelist variables and get CONTINUE_RUN / RESUBMIT going
Michael Levy (Jul 21 2020 at 13:12):@Keith Lindsay both of the runs died very early on (first time step, I think) with MARBL computing a NaN in O2 at two locations:
The init_from_obs run:
6595: ecosys_driver:ecosys_driver_set_interior: NaN in dtracer_module, (i,j,k)=(
6595:        2150 ,         328 ,           1 )
6595: (lon,lat)=(   104.950000000000      ,  -64.6507447068962      )
...
6595: O2    350.734008088224                            NaN

6596: ecosys_driver:ecosys_driver_set_interior: NaN in dtracer_module, (i,j,k)=(
6596:        2153 ,         329 ,           1 )
...
6596: O2    351.148935722389                            NaN
The init_from_g.... run:
6595: ecosys_driver:ecosys_driver_set_interior: NaN in dtracer_module, (i,j,k)=(
6595:        2150 ,         328 ,           1 )
6595: (lon,lat)=(   104.950000000000      ,  -64.6507447068962      )
...
6595: O2    379.801607541355                            NaN

6596: ecosys_driver:ecosys_driver_set_interior: NaN in dtracer_module, (i,j,k)=(
6596:        2153 ,         329 ,           1 )
6596: (lon,lat)=(   105.250000000000      ,  -64.6078635918506      )
...
6596: O2    379.601718708997                            NaN
Keith Lindsay (Jul 21 2020 at 13:14):I'll investigate asap.
Michael Levy (Jul 21 2020 at 13:14):Thanks!
Keith Lindsay (Jul 23 2020 at 16:26):The current hypothesis is that we're getting a divide by zero when computing o2_production in compute_local_tendencies. It's a pathological condition where photoC>0, but NO3_V and NH4_V are both zero. Usually if photoC>0, then one of NO3_V or NH4_V is positive. The hypothesis is that this is occurring because photoC is really close to zero (e.g., 10^-300), and NO3_V and NH4_V are both rounding down to 0. The o2_production term is only computed if photoC>0. A proposed fix is to change the condition to NO3_V+NH4_V>0. The code for this proposed fix is:
@@ -3452,6 +3452,7 @@ subroutine compute_local_tendencies(km,
     !-----------------------------------------------------------------------
     integer  :: k, auto_ind, zoo_ind, n
     real(r8) :: auto_sum
+    real(r8) :: o2_production_denom
     !-----------------------------------------------------------------------

     associate(                                                            &
@@ -3691,7 +3692,8 @@ subroutine compute_local_tendencies(km,
         o2_production(k) = c0
         do auto_ind = 1, autotroph_cnt
           if (.not. autotroph_settings(auto_ind)%Nfixer) then
-            if (photoC(auto_ind,k) > c0) then
+            o2_production_denom = NO3_V(auto_ind,k) + NH4_V(auto_ind,k)
+            if (o2_production_denom > c0) then
               o2_production(k) = o2_production(k) + photoC(auto_ind,k) &
                                * ((NO3_V(auto_ind,k) / (NO3_V(auto_ind,k) + NH4_V(auto_ind,k))) &
                                  / parm_Red_D_C_O2 &
@@ -3699,7 +3701,8 @@ subroutine compute_local_tendencies(km,
                                  / parm_Remin_D_C_O2)
             end if
           else
-            if (photoC(auto_ind,k) > c0) then
+            o2_production_denom = NO3_V(auto_ind,k) + NH4_V(auto_ind,k) + Nfix(auto_ind,k)
+            if (o2_production_denom > c0) then
               o2_production(k) = o2_production(k) + photoC(auto_ind,k) &
                                * ((NO3_V(auto_ind,k) / (NO3_V(auto_ind,k) + NH4_V(auto_ind,k) + Nfix(auto_ind,k))) &
                                   / parm_Red_D_C_O2 &
I think this should be bit-for-bit up to the point of failure. I have a test run in the queue on cheyenne to test this change. Alas, it has been in the queue for 40+ hours. I've submitted a request to CISL to see if there is something wrong with my job that might be preventing it from running.
A followup patch, with some optimizations to avoid multiple divisions, is below. This probably introduces roundoff differences. Because of this, I'm not using it in my test run, because I want to verify that the problem is fixed before changing answers.
@@ -3452,6 +3452,7 @@ subroutine compute_local_tendencies(km,
     !-----------------------------------------------------------------------
     integer  :: k, auto_ind, zoo_ind, n
     real(r8) :: auto_sum
+    real(r8) :: o2_production_denom, o2_production_denom_r
     !-----------------------------------------------------------------------

     associate(                                                            &
@@ -3691,22 +3692,21 @@ subroutine compute_local_tendencies(km,
         o2_production(k) = c0
         do auto_ind = 1, autotroph_cnt
           if (.not. autotroph_settings(auto_ind)%Nfixer) then
-            if (photoC(auto_ind,k) > c0) then
+            o2_production_denom = NO3_V(auto_ind,k) + NH4_V(auto_ind,k)
+            if (o2_production_denom > c0) then
+              o2_production_denom_r = c1 / o2_production_denom
               o2_production(k) = o2_production(k) + photoC(auto_ind,k) &
-                               * ((NO3_V(auto_ind,k) / (NO3_V(auto_ind,k) + NH4_V(auto_ind,k))) &
-                                 / parm_Red_D_C_O2 &
-                                 + (NH4_V(auto_ind,k) / (NO3_V(auto_ind,k) + NH4_V(auto_ind,k))) &
-                                 / parm_Remin_D_C_O2)
+                               * (NO3_V(auto_ind,k) * o2_production_denom_r / parm_Red_D_C_O2 &
+                                  + NH4_V(auto_ind,k) * o2_production_denom_r / parm_Remin_D_C_O2)
             end if
           else
-            if (photoC(auto_ind,k) > c0) then
+            o2_production_denom = NO3_V(auto_ind,k) + NH4_V(auto_ind,k) + Nfix(auto_ind,k)
+            if (o2_production_denom > c0) then
+              o2_production_denom_r = c1 / o2_production_denom
               o2_production(k) = o2_production(k) + photoC(auto_ind,k) &
-                               * ((NO3_V(auto_ind,k) / (NO3_V(auto_ind,k) + NH4_V(auto_ind,k) + Nfix(auto_ind,k))) &
-                                  / parm_Red_D_C_O2 &
-                                  + (NH4_V(auto_ind,k) / (NO3_V(auto_ind,k) + NH4_V(auto_ind,k) + Nfix(auto_ind,k))) &
-                                  / parm_Remin_D_C_O2 &
-                                  + (Nfix(auto_ind,k)  / (NO3_V(auto_ind,k) + NH4_V(auto_ind,k) + Nfix(auto_ind,k))) &
-                                  / parm_Red_D_C_O2_diaz)
+                               * (NO3_V(auto_ind,k) * o2_production_denom_r / parm_Red_D_C_O2 &
+                                  + NH4_V(auto_ind,k) * o2_production_denom_r / parm_Remin_D_C_O2 &
+                                  + Nfix(auto_ind,k) * o2_production_denom_r / parm_Red_D_C_O2_diaz)
             end if
           end if
         end do
Matt Long (Jul 23 2020 at 16:29):Thanks Keith!! I hope the run goes...
Michael Levy (Jul 23 2020 at 16:36):Thanks, Keith! I'll wait for you to verify this fixed the issue in your job before launching any runs of my own, but I'll start putting together a sandbox so that I can get things going right away if this patch does the trick for you
Michael Levy (Jul 23 2020 at 22:07):@Keith Lindsay do you have a history file from the the timestep before POP aborts? Would it be useful if I tried to pull the columns that result in errors out and create something the stand-alone single column test could use? I think the only two possible hang-ups would be (1) updated my notebook to support the cocco tracers (which should be easy) and (2) updating my notebook to account for tracers that were only written to 150m instead of full depth (not as easy, but doable). Actually, the real challenge will probably be either updating the notebook to account for a year+ of development in the various python packages or figuring out what versions of xarray and numpy I was running back then
Michael Levy (Jul 23 2020 at 22:08):My hope would be that I could
O2 tendency is nan when running on the development branch, and thennan with your proposed fix Keith Lindsay (Jul 23 2020 at 22:19):CISL gave me a reservation and I'm doing multiple test runs right now.
I backed out my fix and confirmed 1, that O2_PRODUCTION is NaN at these points.
photoC_cocco=2.551-307, and photoNH4_cocco=photoNO3_cocco=0.0.
Per wikipedia, the smallest positive non-normalized r8 is 2.23E-308.
This is all consistent with the hypothesis for the cause of the NaN.
The run with my fix goes past the point of failure. I'm now checking to see if results changed.
Michael Levy (Jul 23 2020 at 22:22):sounds good, I won't try to dust off that old notebook. Thanks for the update!
Keith Lindsay (Jul 23 2020 at 22:45):Good news. patch1 solves the problem and doesn't change answers up to the abort
I'm checking patch2 now.
Keith Lindsay (Jul 23 2020 at 23:26):The model runs past the previous crash with patch2.
The version of the mods does indeed introduce roundoff level changes.
I ran with and without patch2 in an x1 test case and the difference in the interior_tendency_compute timer was <1%.
So for simplicity, I suggest going with patch1 and moving forward with the run.
@Michael Levy, please proceed with the runs with patch1.
It looks like you put patch1 in $SRCROOT.
However, you already have a modified version of marbl_interior_tendency_mod.F90 in SourceMods/src.pop (for reducing volume of DOP_loss_P_bal warnings). So I think you'll need to recreate that SourceMods file and rebuild.
Michael Levy (Jul 23 2020 at 23:29):@Keith Lindsay I agree with keeping the bit-for-bit patch given how small the performance improvement from changing answers is, so I'll update my SourceMods file and then get my two cases built. Once my jobs are in the queue, I'll put together a pull request based on what's in my source root.
Matt Long (Jul 24 2020 at 12:49):Great work Keith!
Michael Levy (Jul 29 2020 at 22:45):An update on the run status -- it looks like the issues we were having in the first two runs were due to CFL violations, so we've cut our time step. We are now doing 17 100s steps and 2 50s steps per 30 minute coupling interval:
     Step     Full/        Time in
     Number   Half         Seconds

      1        F      100.000000000000000
      2        H      150.000000000000000
      3        F      250.000000000000000
      4        F      350.000000000000000
      5        F      450.000000000000000
      6        F      550.000000000000000
      7        F      650.000000000000000
      8        F      750.000000000000000
      9        F      850.000000000000000
     10        F      950.000000000000000
     11        F     1050.000000000000000
     12        F     1150.000000000000000
     13        F     1250.000000000000000
     14        F     1350.000000000000000
     15        F     1450.000000000000000
     16        F     1550.000000000000000
     17        H     1600.000000000000000
     18        F     1700.000000000000000
     19        F     1800.000000000000000 <-- LAST STEP in coupling interval   1
                                           hour, min, sec at end of interval =    0  30   0
This compares to the previous setup of 10 171.4s steps and one 85.7s step:
      1        F      171.428571428571416
      2        H      257.142857142857110
      3        F      428.571428571428555
      4        F      600.000000000000000
      5        F      771.428571428571445
      6        F      942.857142857142890
      7        F     1114.285714285714221
      8        F     1285.714285714285552
      9        F     1457.142857142856883
     10        F     1628.571428571428214
     11        F     1799.999999999999545 <-- LAST STEP in coupling interval   1
                                           hour, min, sec at end of interval =    0  30   0
(I started wondering about the ideal location for the second half-step, and it made me think that maybe we should be doing 18 97.3s steps and 1 48.6s step instead, but I'm sure this scheme is fine).
The downside to this is that it really slows things down -- there's a chance that a 2-month run could fit in a 12 hour window, but to be safe I'm doing 1 month at a time and requesting 7 hours per run.
I built two new cases from scratch for this:
/glade/work/mlevy/hi-res_BGC_JRA/cases/g.e22.G1850ECO_JRA_HR.TL319_t13.003 -- initialized from combination of WOA and Kristen's runs/glade/work/mlevy/hi-res_BGC_JRA/cases/g.e22.G1850ECO_JRA_HR.TL319_t13.004 -- initialized from Kristen's runs Keith Lindsay (Jul 30 2020 at 13:38):FYI, I now see that previous hi-res BGC runs of @Matt Long had dt ~ 112 s, which isn't tremendously different our new dt = 100 s. An example CASEROOT is /glade/p/cgd/oce/people/mclong/hi-res-eco/g.e11.G.T62_t12.eco.004.
Caveats are that his runs were forced with CORE normal year and had OCN_NCPL=4, so it's definitely not an apples to apples comparison with these hi-res JRA runs.
I don't know how he came to that dt value, if he inherited it from previous CORE NY hi-res cases, or if it was necessary because of the addition of BGC tracers.
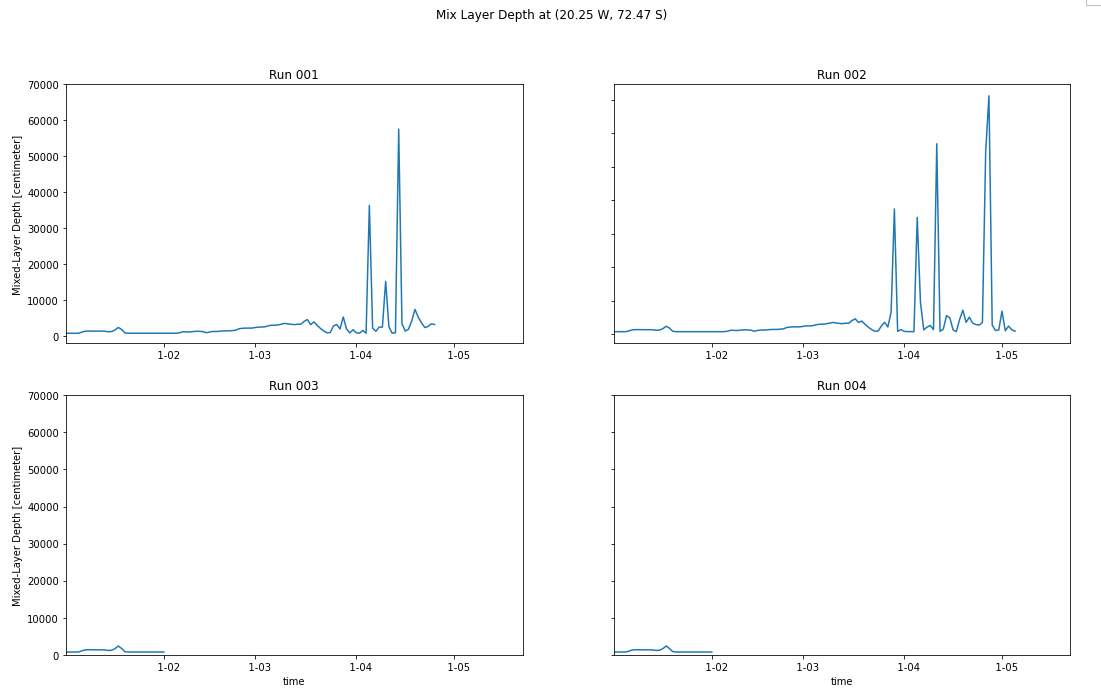
Michael Levy (Jul 30 2020 at 16:03):I thought it would be useful to compare time-series of HMXL at one of the grid cells reporting errors (when @Keith Lindsay and I chatted yesterday, that was one of the variables in the daily stream that was showing significant noise where the co2calc routine was failing).
I don't really see a signal in 001 or 002 until late March / early April, so I'll update this plot tomorrow (if things stay on schedule, both runs should be done with February and March in less than 24 hours, and 003 will be through April right around the end of the day)
Michael Levy (Jul 30 2020 at 23:20):The notebook that generated the plot above is https://github.com/mnlevy1981/MARBL-notebooks/blob/master/hi-res%20comparisons.ipynb
Besides the panel plot, it also creates a plot with all four lines on the same axes. Both runs have completed two months and 003 is about 1/3 of the way through March, so we're a run ahead of where I thought we were this morning -- 003 was through two months and 004 was just starting its second month.
So far every job has finished in under 6 hours, so it may be worth considering trying for 2 months at a time in a 12 hour wallclock... though the July-August (or December-January) runs with two 31-day months could cut it pretty close if there's a glade hiccup. A better solution might be to look at higher-throughput PE layouts if things remain stable? We went with the 232-node layout because the 431-node jobs were getting stuck in the queue, but then the 232-node jobs also starting getting stuck. Rough math based on the performance spreadsheet, I think we'd be on the cusp of squeezing 4 months into a 12 hour wallclock but would probably want 3 months in a 10 hour request to play it safe.
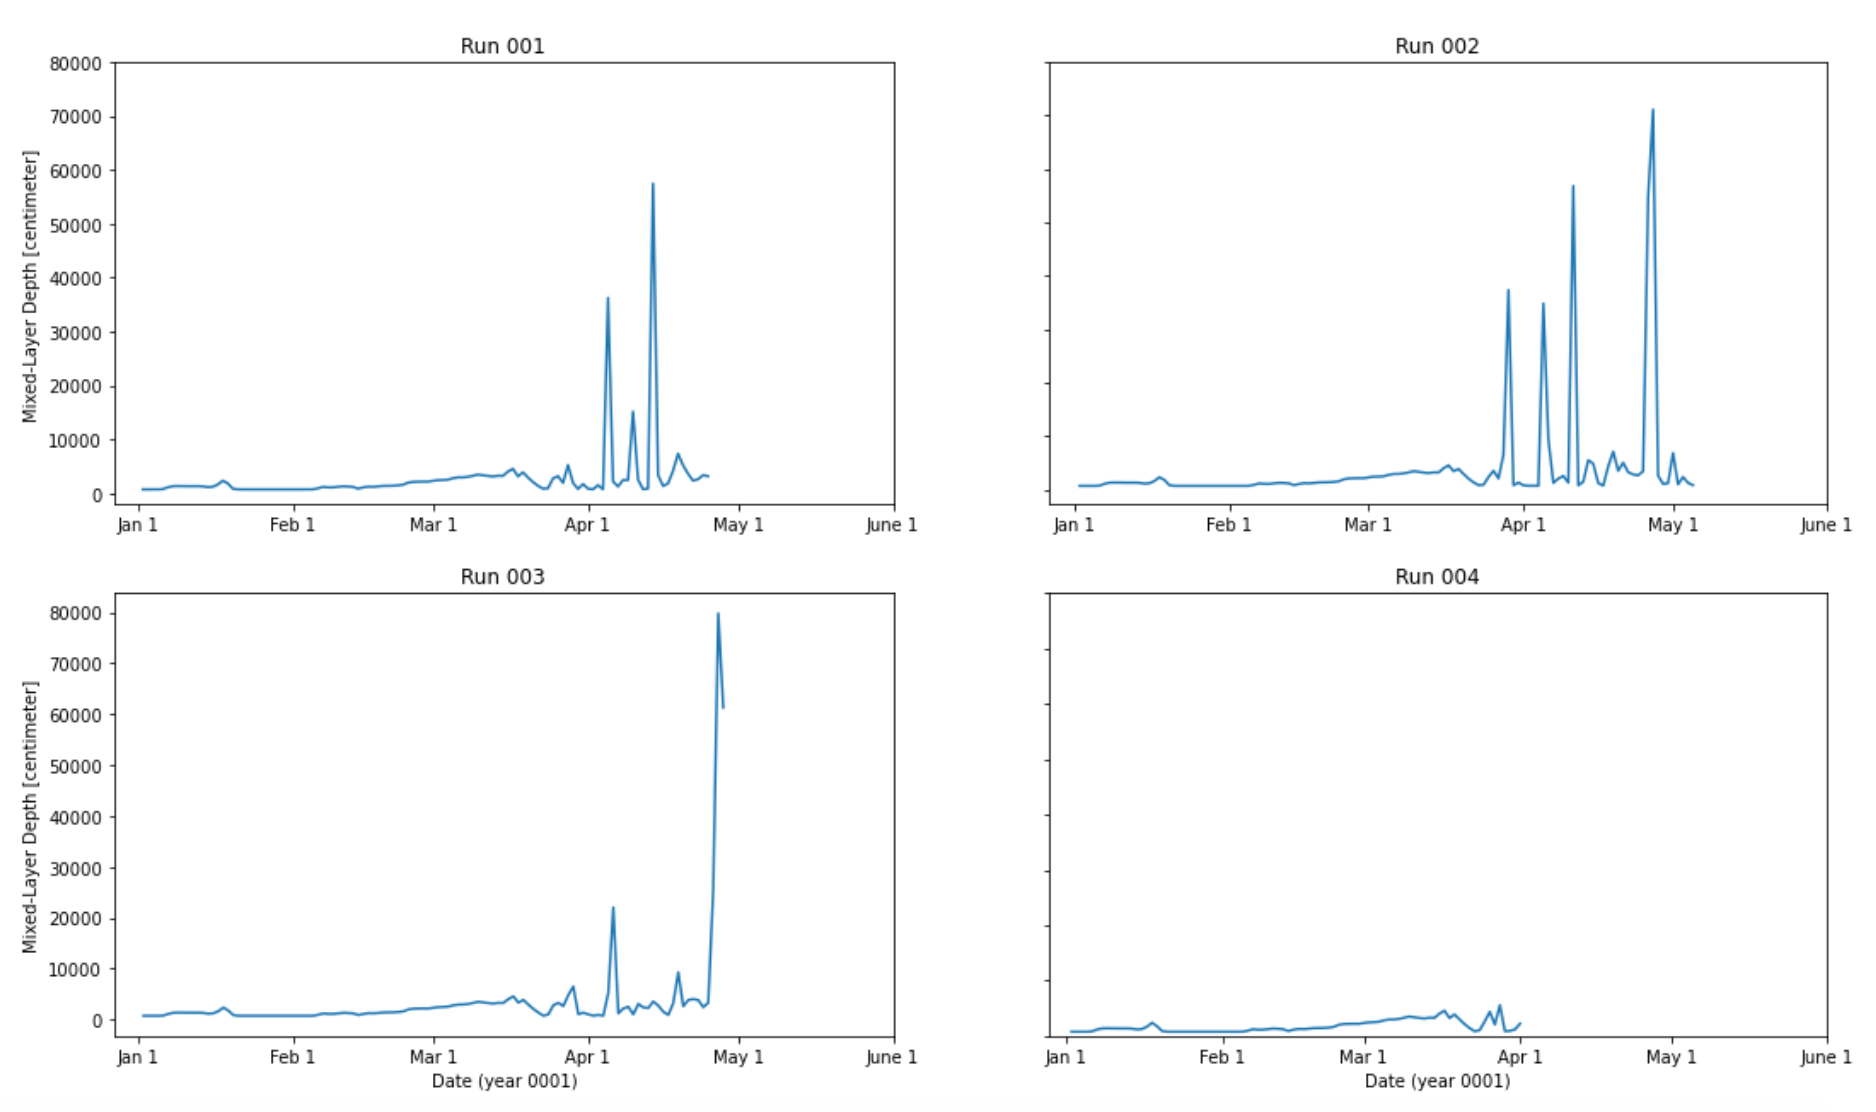
Michael Levy (Jul 31 2020 at 13:42):003 has run past the April day where 001 crashed, but there's still a lot of noise in the mix layer depth at this point:
CFL criteria looks okay, though:
 Global Time Averages: 04-24-0001 00:00:00
 max. cfl number for vertical advection       :   2.9769E-01      899  144   21
 Global Time Averages: 04-25-0001 00:00:00
 max. cfl number for vertical advection       :   2.2005E-01      899  143   19
 Global Time Averages: 04-26-0001 00:00:00
 max. cfl number for vertical advection       :   1.9214E-01      903  144   20
 Global Time Averages: 04-27-0001 00:00:00
 max. cfl number for vertical advection       :   1.8842E-01      904  145   18
 Global Time Averages: 04-28-0001 00:00:00
 max. cfl number for vertical advection       :   1.9116E-01      901  144   19
Keith Lindsay (Jul 31 2020 at 14:23):Additional (good) info is that 003 has now finished the month of 0001-04 and there were no marbl_co2calc_mod warnings. So whatever is causing the HMXL noise is not tripping up the carbonate solver, as happened in 001.
Keith Lindsay (Aug 01 2020 at 13:18):Something caused 003 st_archive job 3429790 to stop before completing. It's not clear to me what the problem was. A consequence is that the follow up run job was not submitted. So 003 needs to be resubmitted manually.
Michael Levy (Aug 16 2020 at 05:33):A few small updates:
003 to use 14666 tasks for the ocean -- I also updated STOP_N and JOB_WALLCLOCK_TIME; the first pass will be 3 months in a 12 hour window, but I suspect I'll be able to drop the wallclock to 10 or 11 hours (expecting something in the neighborhood of 0.6 SYPD, so 4 months in 12 hours is likely out of the question) Michael Levy (Aug 16 2020 at 05:37):004 should finish up around 2:30a, and I just noticed that RESUBMIT is 0; I changed it to 1, so in the morning (or some point tomorrow) I can check to see if changing that value while the case is running does anything... if not, I'll update the task count and submit it with the same 3 month / 12 hour wallclock as 003
Michael Levy (Aug 16 2020 at 15:16):
004should finish up around 2:30a, and I just noticed thatRESUBMITis 0; I changed it to 1, so in the morning (or some point tomorrow) I can check to see if changing that value while the case is running does anything...
This worked, so there's one more month of 004 in the queue; I'll update the pe layout after it runs
Michael Levy (Aug 27 2020 at 15:35):I've increased NTASKS_OCN from 7507 to 14666; I had originally increased STOP_N and JOB_WALLCLOCK_TIME to target 3 months in a 10 hour window but it was only taking 8ish hours to complete so I've bumped up to 4 months in a 12 hour window. The first month with the new pe layout was January 0002 for 003 and March 0002 for 004. I moved some jobs to the premium queue but didn't see much improvement in queue wait time, so I've dropped back to regular. In perhaps the best turn-around time I've seen yet, an 004 run that was submitted to the queue around midnight was running at 3:30a. I actually had two jobs running simultaneously for a bit last night; an 003 job finished around 2:45a but the next 003 job is still waiting in the queue.
003 has run through September 0002, and the section of the run covering 10-0002 through 01-0003 is in the queue. 004 has run through August 0002, and the section of the run covering 09-0002 through 12-0002 is running as we speak -- we're a few days into November, so I think we'll barely squeak in under the 12 hour limit. (The 003 run will really test the wisdom of pushing for 4 months, since it spans 123 model days which is the max for any four consecutive months; the 004 run is "only" 122 days.)
Matt Long (Aug 28 2020 at 11:19):How's it going with the reservation?
Michael Levy (Aug 28 2020 at 17:33):So far, so good - I ran 4 months of 004 in ~11.5 hours, and now 003 has been running for over 2.5 hours and is almost a month in. I think I have RESUBMIT configured so that the last job will be submitted at 5p Sunday, though I should verify with Mick that "midnight on Monday" is 12:00a Monday and not 12:00a Tuesday. I'll monitor my email for failures over the weekend, but the nice thing about alternating between the two jobs is that if one crashes the other one can make use of the reservation while we track down the issue so the nodes aren't sitting idle.
Michael Levy (Aug 28 2020 at 17:34):oh, that "2.5 hours ago" update was from 10:00 when I started typing that response... we're now four hours in and about 1/2 through November.
Matt Long (Aug 28 2020 at 17:38):great
Keith Lindsay (Aug 29 2020 at 21:46):FYI, the command pbs_rstat shows information about reservations in PBS. When I run it, I get the output
Resv ID    Queue    User     State             Start / Duration / End
---------------------------------------------------------------------
R3853685.c R3853685 csgteam@ RN            Thu 20:00 / 359940 / Mon Aug 31 23:59
So it looks like your reservation runs through Monday.
Michael Levy (Aug 31 2020 at 13:13):Thanks Keith, that's a super helpful command! 003 is 7 months behind 004 (the former is through Sept 0003, the latter is through April 004) so I'll finish out the reservation by running 8 months of 003 to get the two runs to roughly the same spot.
Michael Levy (Sep 08 2020 at 14:01):004 crashed ~15 days into a run this morning. Looking at /glade/scratch/mlevy/g.e22.G1850ECO_JRA_HR.TL319_t13.004/run/cesm.log.3984065.chadmin1.ib0.cheyenne.ucar.edu.200908-020400 I think it might've been a machine error, so I've resubmitted the job:
12057:MPT ERROR: Assertion failed at ibdev_multirail.c:4331: "0 <= chan->queued"
12057:MPT ERROR: Rank 12057(g:12057) is aborting with error code 0.
...
12057:MPT: #15 PMPI_Waitall (count=8, array_of_requests=<optimized out>,
12057:MPT:     array_of_statuses=0x2b467dd4ba00) at waitall.c:80
12057:MPT: #16 0x00002b1db84f44dd in pmpi_waitall__ ()
12057:MPT:    from /glade/u/apps/ch/opt/mpt/2.21/lib/libmpi.so
12057:MPT: #17 0x000000000086114f in pop_halomod_mp_pop_haloupdate2dr8_ ()
12057:MPT:     at /glade/scratch/mlevy/g.e22.G1850ECO_JRA_HR.TL319_t13.004/bld/ocn/source/POP_HaloMod.F90:1923
It looks like it's getting hung up in the broadcast step of a halo update, and there's nothing in the ocean or ice logs to indicate a problem.
Michael Levy (Sep 16 2020 at 21:02):The run that crashed on September 8th ran successfully over the weekend so it does appear to have been a machine glitch. Now jobs are failing because /glade/scratch is full (not my scratch space, but the entire disk):
$ gladequota
Current GLADE space usage: mlevy

  Space                                      Used       Quota    % Full      # Files
--------------------------------------- ----------- ----------- --------- -----------
/glade/scratch/mlevy                       49.98 TB    60.00 TB   83.31 %      282493
...
/glade/scratch  - 100.0% used ( 15 TB used out of  15 TB total)
I assume 15 TB should really be 15 PB in that message. I'll submit an issue ticket to CISL, hopefully they can send out a system-wide nagging email to get folks to clean up old files
Michael Levy (Sep 16 2020 at 21:08):Somebody noticed :)
/glade/scratch - 79.2% used (11887 TB used out of 15000 TB total)
Keith Lindsay (Sep 22 2020 at 15:41):The jobs are sitting in the queue for 3 1/2 to 4 days. I propose that we use the premium queue. It sounds like there's an (unknown) upper limit on how many core-hours can carry over after the allocation period, so we may as well use them paying for premium, instead of leaving them on the table.
Michael Levy (Sep 22 2020 at 15:53):Good call - I've updated JOB_QUEUE in the case directory, so the next job will be submitted to premium; I can cancel / resubmit the current job but it's already been in the queue for 18 hours so my preference is to let it run from regular (I've used qalter in the past to change queues of an active job, but then CISL asked me not to do that anymore)
Keith Lindsay (Sep 22 2020 at 16:02):I suggest cancelling and resubmitting the current job. Otherwise we'll wait for 3+ days for this change to kick in.
Michael Levy (Sep 22 2020 at 16:08):done. I also just noticed that I am running low on scratch space, so I've removed the 003 time series (which have already been copied to campaign) and I will start converting 004 to get that output onto campaign as well. We need to update the diagnostics API to read the time series files, because there's still 16 TB of history files from 003 sitting in the short-term archive that I'd like to get rid of
Michael Levy (Sep 24 2020 at 17:07):First five years of 004 are on campaign (in time-series format); I'm going to take a break from the MOM driver and work on the API for reading these files for the next day or two
Michael Levy (Sep 24 2020 at 17:07):/glade/campaign/cesm/development/bgcwg/projects/hi-res_JRA/cases/g.e22.G1850ECO_JRA_HR.TL319_t13.004
Matt Long (Sep 24 2020 at 17:15):Perhaps you can touch base with @Anderson Banihirwe; I think intake-esm should be able to help here.
Keith Lindsay (Sep 24 2020 at 17:21):In my sandbox, I've added a **kwargs argument to CaseClass._open_history_files that gets passed through to open_mfdataset. I'm using this to specify chunk sizes when I open the dataset. I think having a **kwargs argument in our new API would be useful for use cases like this.
Michael Levy (Oct 01 2020 at 16:09):It looks like the current run of 004 stalled about 4 hours ago:
$ tail -f cpl.log.4336094.chadmin1.ib0.cheyenne.ucar.edu.200930-221247 | grep tStamp
 tStamp_write: model date =   00070319       0 wall clock = 2020-10-01 05:30:20 avg dt =   339.77 dt =   339.32
 tStamp_write: model date =   00070320       0 wall clock = 2020-10-01 05:35:59 avg dt =   339.76 dt =   338.81
 tStamp_write: model date =   00070321       0 wall clock = 2020-10-01 05:41:38 avg dt =   339.75 dt =   338.89
 tStamp_write: model date =   00070322       0 wall clock = 2020-10-01 05:47:17 avg dt =   339.74 dt =   339.10
 tStamp_write: model date =   00070323       0 wall clock = 2020-10-01 05:52:56 avg dt =   339.73 dt =   338.91
I didn't see anything in the ocn.log or cesm.log that indicates a problem, so I'm tempted to just restart the run (there should be restarts from the beginning of March 0007).
Keith Lindsay (Oct 01 2020 at 16:25):I also don't see a smoking gun. Restarting from 0007-03-01 makes sense to me.
Keith Lindsay (Oct 04 2020 at 14:33):It looks like the submission that would have run 0008-04-01 to 0008-08-01 stalled around 11:13 PM last night (3-Oct-2020) at model date 0008-05-09. The job, jobid=4482573, was killed at 7:32 AM this morning, 4-Oct-2020, when it hit its 12-hour wallclock limit. I don't see anything in the logs indicated why it stalled.
I suggest restarting using the latest restart files, at 0008-05-01, and initially running for 3 months so that we get back to restarting on the 1st of Apr, Aug, Dec.
Michael Levy (Oct 04 2020 at 14:57):I just saw the email about this failure and have restarted the job; I didn't change STOP_N, but will change it for the next job that gets submitted... so ~8:30p or 9p tonight, we'll have 3 more months run in the reservation and then that job will submit a 4-month continuation back into premium
Michael Levy (Oct 04 2020 at 14:59):I guess we'll find out if a machine issue is the cause of these intermittent failures since the reservation should put this new job on the exact same group of nodes as the job that failed.
Michael Levy (Oct 10 2020 at 13:55):Another job died about an hour ago
3317:MPT ERROR: rank:3317, function:MPI_WAITALL, Message truncated on receive: An application bug caused the sender to send too much data
3317:MPT ERROR: Rank 3317(g:3317) is aborting with error code 0.
This is a little different than the other error messages we've seen MPI_WAITALL throw, but hopefully it's not reproducible... we should know in about 2 1/2 hours when we get back to where the run crashed (26 days into April, so pretty far from the last restart)
Keith Lindsay (Oct 11 2020 at 14:39):It looks like the run stalled around 5:10 AM this morning, 11 Oct 2020, at model date 0009-11-07.
Michael Levy (Oct 11 2020 at 17:12):Just saw this, I’ll have a chance to restart the run in 10 or 15 minutes
Michael Levy (Oct 12 2020 at 14:11):I was hoping our run would get through August 0009, but we ran into some issues and ended up not quite finishing May of that year. I think the big take-away is that I need to figure out how to get notifications from this topic on my phone -- had I noticed Keith's message earlier yesterday morning, we definitely would have gotten through May and possibly also June. Still, 17 months is decent progress for a run that isn't getting through the queue otherwise.
Michael Levy (Oct 12 2020 at 14:15):Also, time series for 0007 and 0008 are available on /glade/campaign
Keith Lindsay (Oct 12 2020 at 16:49):There are a couple of zulip apps for the iPhone, Zulip and ZulipReader. I don't have personal experience with either.
I get email notifications from zulip for certain categories of messages that arrive when I am 'away'. I think this is configurable via settings/notifications.
That said, I'd be happy to send you messages via email if that medium is more reliable for getting to you.
Michael Levy (Oct 12 2020 at 17:00):I have the phone app, and had it configured to notify me when I get mentioned... but I just figured out how to get notifications for messages in this stream even if I’m not mentioned so moving forward I’m good. Yesterday morning was a perfect storm of Anna needing to catch up on her work and me not realizing the run had stalled, but I think in the future I’ll catch problems like that much faster.
Keith Lindsay (Oct 15 2020 at 19:03):It looks like a job started up yesterday, 14 Oct, right after cheyenne was returned to service. Unfortunately, the job died in PIO, setting up to read a field from the nyear1 tavg restart file. Fingers crossed that this doesn't occur again.
Michael Levy (Oct 15 2020 at 19:22):Yeah, I debated letting CISL know about that job dying but didn't end up notifying them -- I just re-submitted the job. I think that job died before the official "we have returned cheyenne to service" email, so I thought there was a chance that someone inadvertently unlocked the queue a little too soon or just did something out of order
Michael Levy (Nov 04 2020 at 23:19):Year 0015 is wrapping up. @Matt Long and @Keith Lindsay: yesterday we were talking about the cost of running the model; it's right around 550k core-hours per year so we have roughly 10 years left in UGIT0016 (if I can run it dry)
Keith Lindsay (Nov 04 2020 at 23:26):This latest batch job was in the queue for less than a day. Can we seeing if a job in the economy queue runs?
Michael Levy (Nov 04 2020 at 23:29):The next one should be in economy, that's a good thought. I was thinking the bulk of our runs will still be the weekend reservation, but we may only have two or three weekends of that left (three weekends = 5 sim years at full price = 2.8 million hours)
Keith Lindsay (Nov 05 2020 at 13:00):The batch job submitted to the economy queue started running a short time ago. Look at all of the core-hours that we're saving! :)
Keith Lindsay (Nov 05 2020 at 13:34):The batch job now running in the economy queue waited in the queue for ~13 hours. So system wait is much lower than recent weeks, when we waited for days in the regular queue. A natural question is: Should we use the weekend reservation at full cost and guaranteed throughput (except for system glitches), or go with reduced cost and throughput by using the economy queue? I'm inclined to go with the latter, because of the reduced cost. What do others think?
Matt Long (Nov 05 2020 at 15:08):The latter seems fine to me, but we need to communicate with CISL.
Michael Levy (Nov 05 2020 at 15:20):I'll email Mick and ask to skip the reservation this weekend; if throughput seems reasonable next week as well, we can cancel the whole thing
Michael Levy (Nov 05 2020 at 15:21):Meanwhile, I'll look to see where we are in the run and switch back to 4 months when appropriate. I think the current run is ending in March 0016, which would be great for getting back to starting runs in April, August, and December
Michael Levy (Nov 06 2020 at 19:28):Ugh, I got bitten by https://github.com/ESMCI/cime/issues/3338 -- Despite mentioning it at 8:30 yesterday morning, I forgot to update STOP_N until a little after 2:30p, at which time the short term archiver was running. It looks like the archiver reset STOP_N=3, so this most recent run ended after June instead of July. I'll do three more 3-month runs and then switch back to four months when we're at a point to avoid 123-day runs.
Michael Levy (Nov 12 2020 at 17:13):I have a 100 TB quota in my scratch space, and am using almost 94 TB of it... so I think it's time to start removing old output. I was going to start by removing /glade/scratch/mlevy/archive/g.e22.G1850ECO_JRA_HR.TL319_t13.003 -- it's taking up 16 TB, and all the data has been copied to /glade/campaign/cesm/development/bgcwg/projects/hi-res_JRA/cases/g.e22.G1850ECO_JRA_HR.TL319_t13.003. Does that sound reasonable? "All the data" refers to
4 years of [daily, monthly, and annual] POP and [daily* and monthly] CICE history files (which have been converted to time series)
* We started providing daily CICE output in the middle of year 0001, but the first time series files are for 0002
log files from every run
pop.d filesThere's another ~3 TB of data between the 001 and 002 runs (when our time step was too large and the runs died in late April / early May of 0001). I have not copied any of that output to campaign, should I? It's currently only being used by my Sanity Check.ipynb because 001 is a good example of combining output from two different CESM cases (I had fixed a typo in the case name by branching a few months in to the run).
Keith Lindsay (Nov 12 2020 at 18:16):Deleting 003 output in DOUT_S_ROOT sounds reasonable to me.
I can't come up with a compelling reason to hold on the output from 001 and 002. That said, it looks like you could remove everything except for the log files and the pop.h.nday1 files and the notebooks would continue to work. That would free up most of the space, because you're removing the monthly pop.h files and the restart files.
Michael Levy (Nov 19 2020 at 15:36):The Aug - Nov run from yesterday died (on Nov 30th... so close!); there's a two month job running now (to get a January 1 restart file). I'll follow it with a three month run to get back to the April / August / December starting months... the machine had been fairly stable and we were consistently running in the 340 - 345 sec / sim-day range but this run had several periods creeping into the 350 - 380 second range, then had a single long day
tStamp_write: model date = 00181015 0 wall clock = 2020-11-18 11:46:46 avg dt = 351.42 dt = 473.21
Then this happened:
 tStamp_write: model date =   00181106       0 wall clock = 2020-11-18 13:56:51 avg dt =   352.18 dt =   407.67
 tStamp_write: model date =   00181107       0 wall clock = 2020-11-18 14:03:44 avg dt =   352.81 dt =   413.08
 tStamp_write: model date =   00181108       0 wall clock = 2020-11-18 14:10:35 avg dt =   353.40 dt =   411.15
 tStamp_write: model date =   00181109       0 wall clock = 2020-11-18 14:17:23 avg dt =   353.94 dt =   407.54
 tStamp_write: model date =   00181110       0 wall clock = 2020-11-18 14:24:19 avg dt =   354.55 dt =   416.35
 tStamp_write: model date =   00181111       0 wall clock = 2020-11-18 14:31:12 avg dt =   355.13 dt =   412.83
 tStamp_write: model date =   00181112       0 wall clock = 2020-11-18 14:37:44 avg dt =   355.48 dt =   391.77
 tStamp_write: model date =   00181113       0 wall clock = 2020-11-18 14:44:09 avg dt =   355.76 dt =   384.91
 tStamp_write: model date =   00181114       0 wall clock = 2020-11-18 14:50:39 avg dt =   356.10 dt =   390.82
I think for now we should treat this as an abnormality, but if we see more runs dying in the final days of the fourth month I propose running 3-month segments.
Michael Levy (Dec 14 2020 at 16:12):I was running into all sorts of machine issues over the weekend, but was able to get the run through year 30 (last job hung in the middle of Feb 0031). I've burned through the rest of the allocation, though, and UGIT0016 is at -400k core-hours, so runs are on hold for now. I'm converted 0030 to time series and will get that onto campaign, then I guess this project will be on hold until I get my hands on more core hours?
Michael Levy (Jan 12 2021 at 18:33):oops, accidentally posted about the no_pinatubo run here instead of #pinatubo-LE ... sorry! (deleted the message, will paste it in appropriate channel)
Matt Long (Jan 13 2021 at 19:15):@Michael Levy, so we now have 2M hours in UGIT0016 and can resume the integration. I think you should run in economy.
Michael Levy (Jan 13 2021 at 20:35):@Matt Long awesome! I need to clean up some scratch space by moving some of the Pinatubo runs to campaign, but I'll restart this run tonight or tomorrow. In economy, we should be able to get five more years including the last two years of the CO2 pulse (I'll drop back to 284.317 at the beginning on 0033)
Michael Levy (Jan 14 2021 at 14:41):I probably should've heeded the warnings from CISL about the machine misbehaving yesterday; last night I wasted ~130k cpu-hours because I submitted the job at 6:45p, verified that it got past initialization, and then got an email at 6:45a telling me it had been killed for exceeding wallclock... looking in the log, it hung in the first day of computation. I've resubmitted and have verified that it's actually moving forward in time (for now, at least)
Matt Long (Jan 14 2021 at 15:33):bummer!
Michael Levy (Jan 14 2021 at 15:33):I checked the new run's status after this morning's CISL message about the cheyenne cooling system, and that run had died but the job hadn't been killed... so I ran qdel but it looks like another 15k cpu-hours spent without any results. I'm going to wait for another all-clear message from CISL before trying to launch the job again. Also, I'll send an email to cisl-help once the charges post SAM to see about getting a refund because I've used almost 10% of the 2 million hours they gave us and have nothing to show for it
Matt Long (Jan 14 2021 at 15:34):yes, 0.13M hours is significant!
Last updated: May 16 2025 at 17:14 UTC