Stephen Yeager (Apr 30 2021 at 14:05): Stephen Yeager (Apr 30 2021 at 14:05):
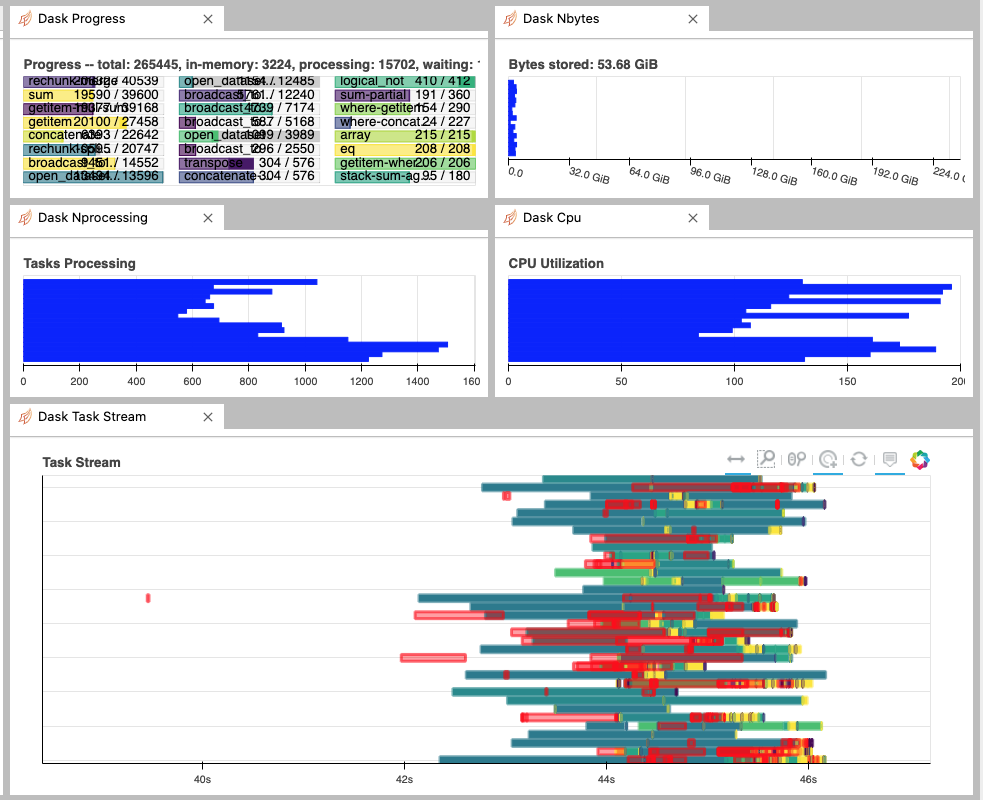
When I logged on to jupyterhub this morning, I had several dask dashboard windows open from my last session that show lots of activity even before I've initiated a cluster :
Screen-Shot-2021-04-30-at-8.01.33-AM.png
When I do qstat -u yeager, I don't see any dask workers. My dashboard is pointing to https://jupyterhub.hpc.ucar.edu/stable/user/yeager/proxy/8787/. Is my dashboard somehow reflecting another user's job? What's going on?
Max Grover (Apr 30 2021 at 15:13):Is it still showing up?
Max Grover (Apr 30 2021 at 15:13):Also, are you on the login node?
Stephen Yeager (Apr 30 2021 at 15:15):I stopped my server and then restarted, and then the dask dashboard went inactive. Both times, I logged into casper batch queue.
Max Grover (Apr 30 2021 at 15:30):So the dashboard isn't showing at all for you anymore? Does it spawn a new dashboard link?
Stephen Yeager (Apr 30 2021 at 15:37):The dashboard is now working. I just initiated a new cluster on casper and the link (https://jupyterhub.hpc.ucar.edu/stable/user/yeager/proxy/8787/) now shows activity on my cluster.
Stephen Yeager (Apr 30 2021 at 15:37):Still a mystery why I already had an active dashboard when first logging in to casper.
Michael Levy (Apr 30 2021 at 15:40):Still a mystery why I already had an active dashboard when first logging in to casper.
@Stephen Yeager the port-forwarding for the dashboard does not require authentication, so somebody else must have spun up a cluster on the node you were logged in with and been assigned the port you had previously used. This is pretty common if your dashboard was pointing to 8787 (the default), because once you stop your cluster the next person on the node to start one will then get 8787 instead
Last updated: May 16 2025 at 17:14 UTC