Kristen Krumhardt (Sep 30 2021 at 19:14): Kristen Krumhardt (Sep 30 2021 at 19:14):
@Fred Castruccio
Here is a list of variables for making postage stamp screening plots:
For general assessment BGC/ecosystem predictability:
• NPP: photoC_TOT_zint_100m
• total chlorophyll: diatChl + diazChl + spChl (these will need to be depth integrated to reduce to 2D)
• zooplankton biomass: zooC (this will also need to be depth integrated)
• carbon export: POC_FLUX_100m
These variables would be necessary for FEISTY fish model input:
• zooplankton biomass (already listed above): zooC (depth integrated over top100m)
• we also need the diatom fraction of phytoplankton biomass: first, integrate biomass of diatC, spC, and diazC over the top 100m, then calculate diatom fraction as diatC/(diatC + diazC + spC)
• zooplankton loss: zoo_loss_zint_100m
• mean temperature over top 100m: TEMP (mean over top 10 levels)
• bottom temperature: TEMP at the model's bottom layer
• bottom POC flux: POC_FLUX_IN at the model's bottom layer
@Stephen Yeager @Matt Long , does this list look good? Perhaps we should just look at a few of these to begin with...
Matt Long (Sep 30 2021 at 19:54):total chlorophyll: diatChl + diazChl + spChl (these will need to be depth integrated to reduce to 2D)
Did you check that we don't have a total chlorophyl diagnostic? Also, I think we should look at phyto C depth integrated, but confine our examination of Chl to the surface.
Matt Long (Sep 30 2021 at 19:55):Also, to clarify: we have codes to compute FEISTY inputs from the model output.
Kristen Krumhardt (Sep 30 2021 at 20:16):Did you check that we don't have a total chlorophyl diagnostic?
I did check for the SMYLE FOSI run and it looks like there's only PFT specific 3d Chl fields (see /glade/campaign/cesm/development/espwg/SMYLE/initial_conditions/SMYLE-FOSI/ocn/proc/tseries/month_1)
It's the same case with phytoplankton carbon (diatC, diazC, and spC), which would need to be summed and depth integrated.
Also, to clarify: we have codes to compute FEISTY inputs from the model output.
These functions are in cells 5 & 8 of this notebook:
https://github.com/matt-long/fish-offline/blob/main/notebooks/proc-cesm-dple-fields.ipynb
Fred Castruccio (Sep 30 2021 at 20:28):Thanks. I will try to get some plot quickly!
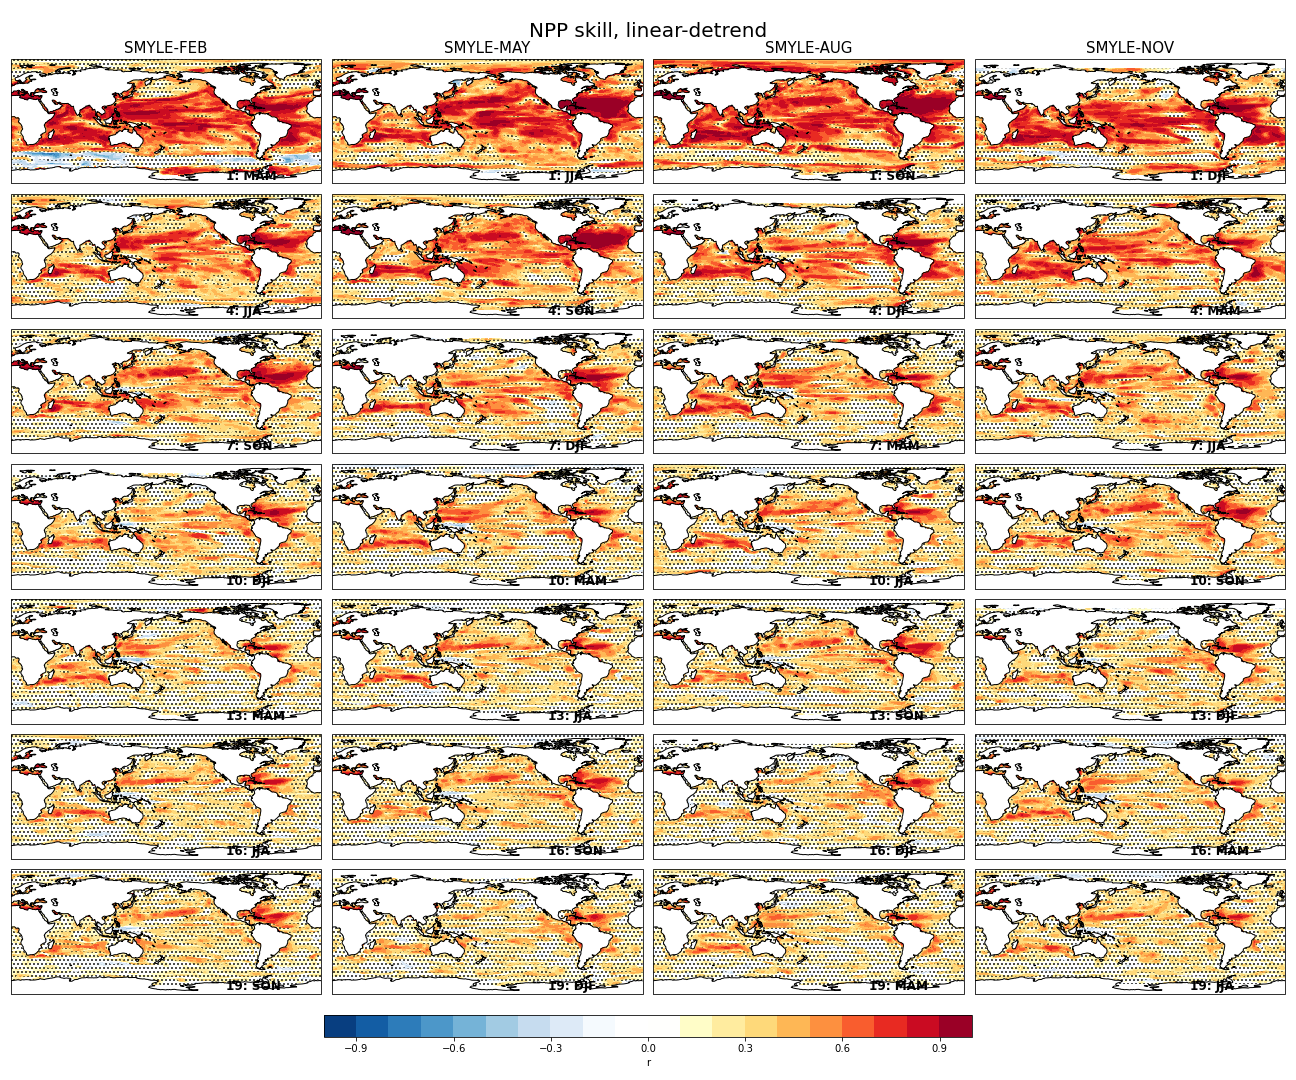
Fred Castruccio (Oct 04 2021 at 15:15):I have created the poster stamp plots for NPP. See below. Skills appear to be in line with DPLE and Kristen 2020 paper. More to come soon...
NPP_skill_linear-detrend.png
Matt Long (Oct 04 2021 at 15:19):Awesome! Nice work.
Kristen Krumhardt (Oct 04 2021 at 15:20):This is great, Fred! Thanks for plotting this up... and ACC is particularly high in the Caribbean & SE US continental shelf LME regions, which is good for our NMS proposal
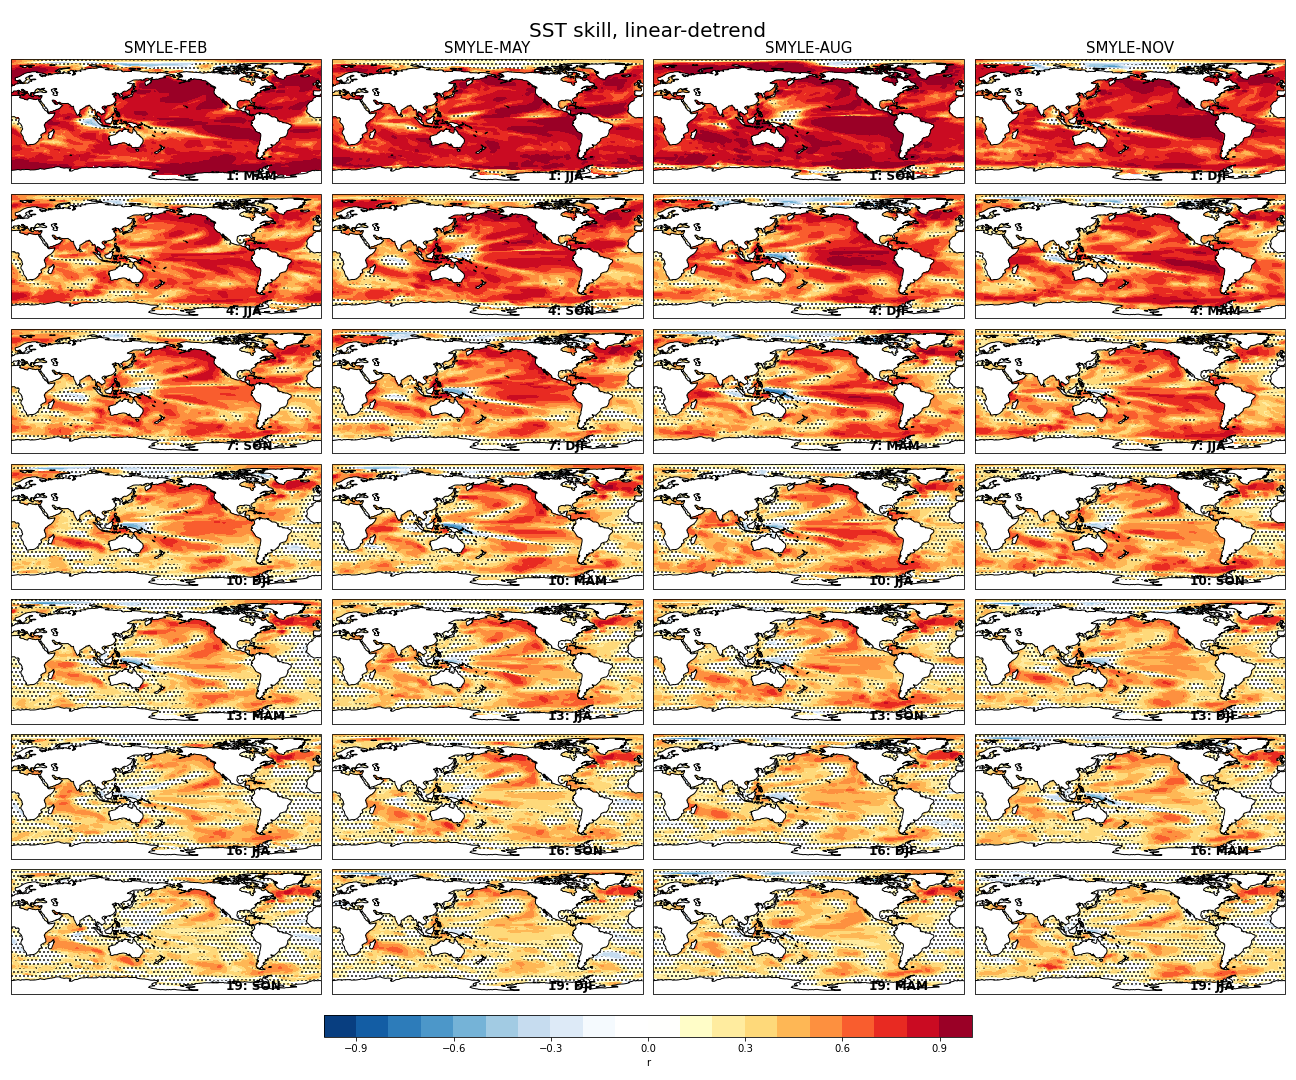
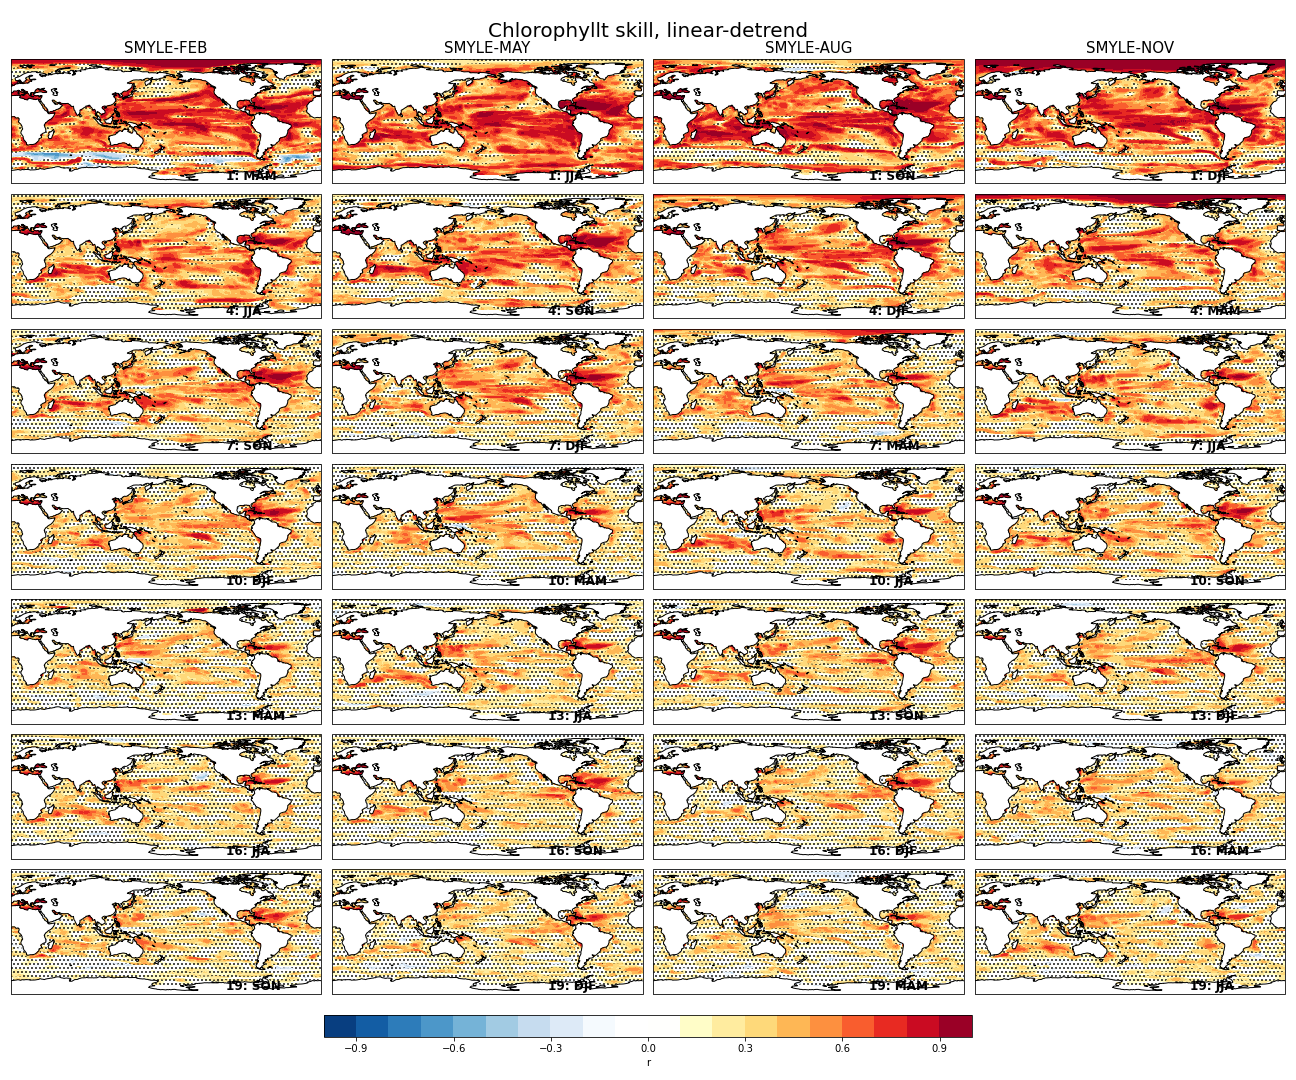
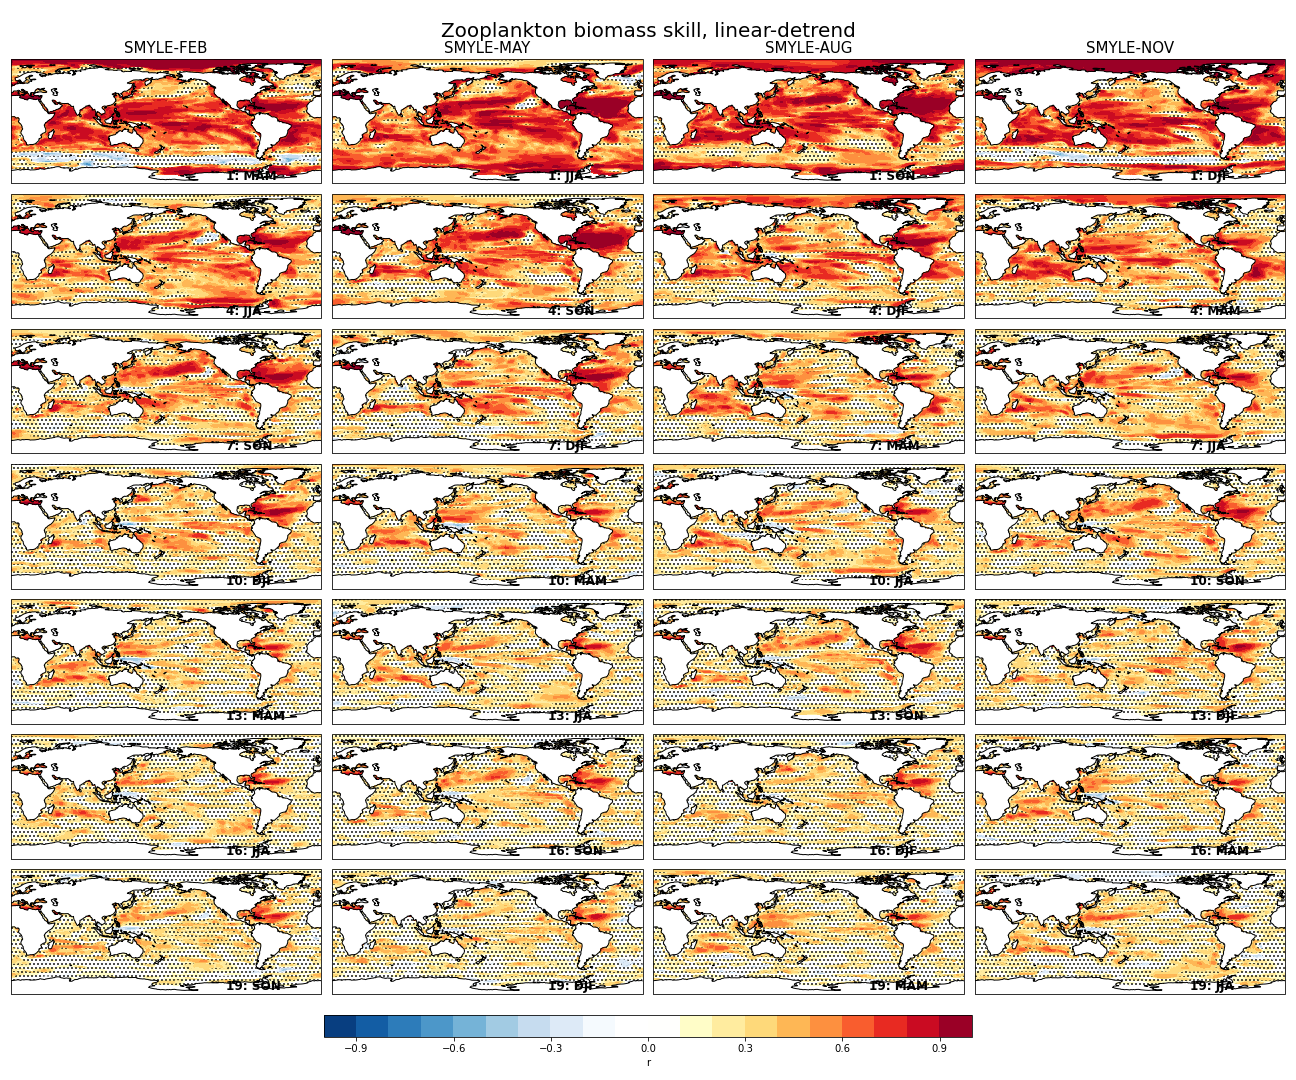
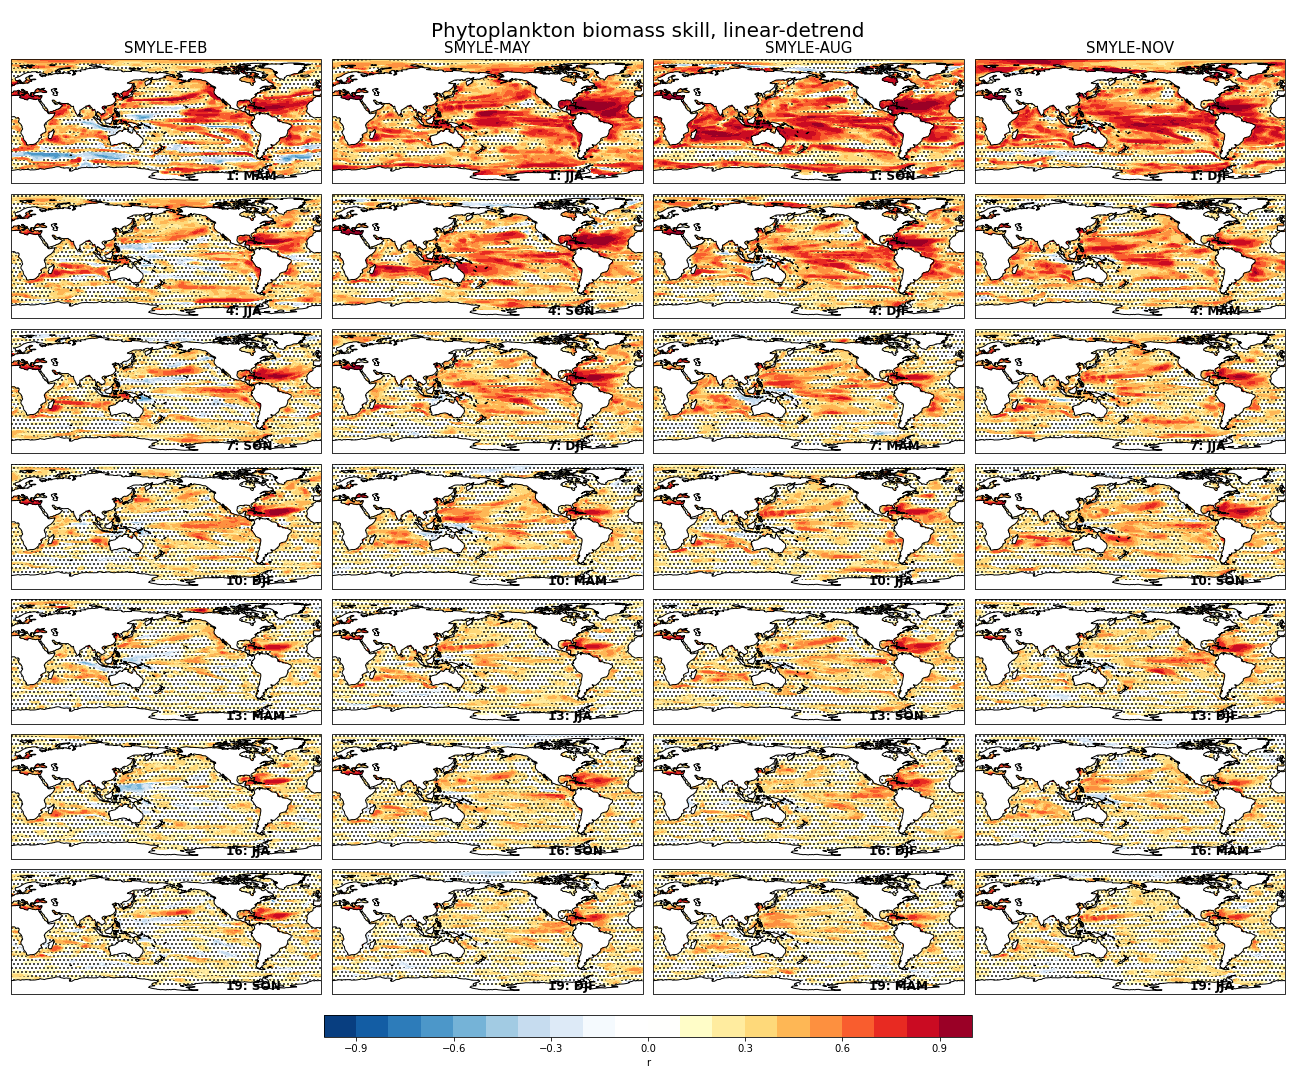
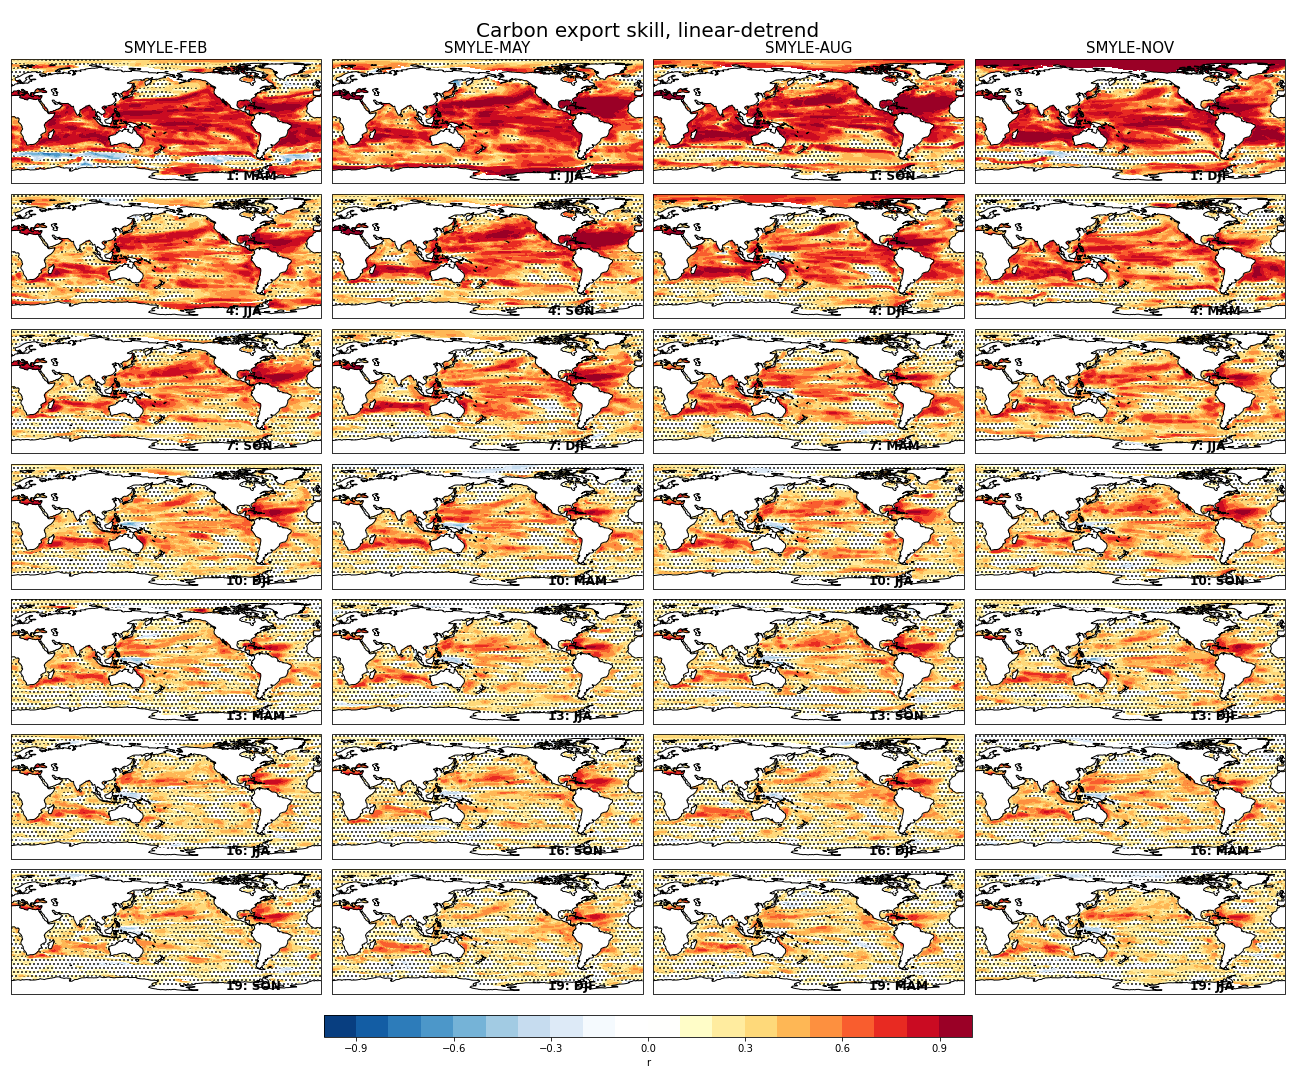
Fred Castruccio (Oct 06 2021 at 16:02):Here are a few more plots for SST, total chlorophyll at the surface, zooplankton biomass, phytoplankton biomass, and carbon export. All the BGC fields show high skill in the tropical Atlantic / Caribbean region and the skill persist at longer lead time. Do we have an idea why this is the case?
SST_skill_linear-detrend.png
chlorophyll_skill_linear-detrend.png
zooC_skill_linear-detrend.png
phytoC_skill_linear-detrend.png
carbon_export_skill_linear-detrend.png
Matt Long (Oct 06 2021 at 16:14):@Fred Castruccio, would you mind showing one or two of these at the section meeting?
Fred Castruccio (Oct 06 2021 at 16:28):OK. I will show a few panels.
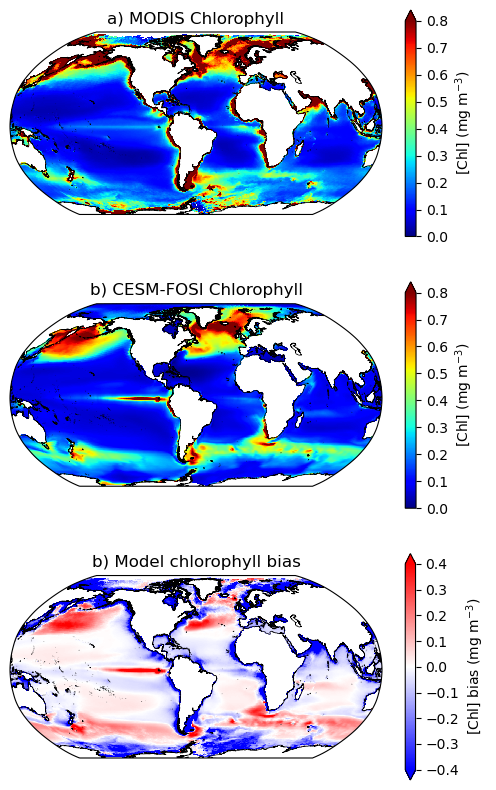
Kristen Krumhardt (Oct 18 2021 at 15:46):Hi! Here is a chlorophyll mean state comparison between the CESM-SMYLE FOSI and the MODIS satellite record (mean over 2002-2020):
mean-state-chl-comparison.png
Global area-weighted RMSD is 0.7 mg/m3.
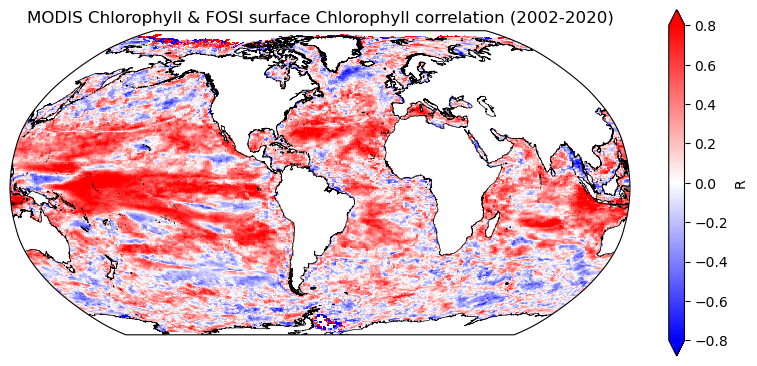
and a correlation coefficient plot between the FOSI and MODIS annual mean chlorophyll over the 2002 to 2020 time period (both datasets were detrended before taking correlation):
modis-fosi-chl-correlation.png
Stephen Yeager (Nov 01 2021 at 14:32):@Kristen Krumhardt , @Matt Long : Could you generate a figure + text for section 3.4 (ocean bgc) of the SMYLE paper?
https://docs.google.com/document/d/11KyxiSutp5SSvTbxjL4orcgZgAM66pHc1LrjGuHZjEM/edit?usp=sharing
It doesn't have to NPP, could be whatever BGC result you'd like to highlight, but I'd ask the following:
Matt Long (Nov 01 2021 at 15:10):We'll work on this!
Kristen Krumhardt (Nov 01 2021 at 15:11):Hi Steve! Sure, this sounds great. I'm getting a branch of the repo set up right now and will be up and running shortly. Matt, what variables should we focus on? perhaps NPP and then some of the FEISTY input variables?
Matt Long (Nov 01 2021 at 15:16):I think NPP, ZooC and POC_FLUX_100m are reasonable targets.
Kristen Krumhardt (Nov 01 2021 at 15:21):Ok, I'll start there, generating some ACC maps for these fields. Then we can discuss a way to condense the information so we don't have huge postage stamp plots
Kristen Krumhardt (Nov 01 2021 at 17:47):I see from above messages that @Fred Castruccio has already calculated ACC for these variables. I will coordinate with him so I can use his notebooks as a starting point for making a figure for the paper
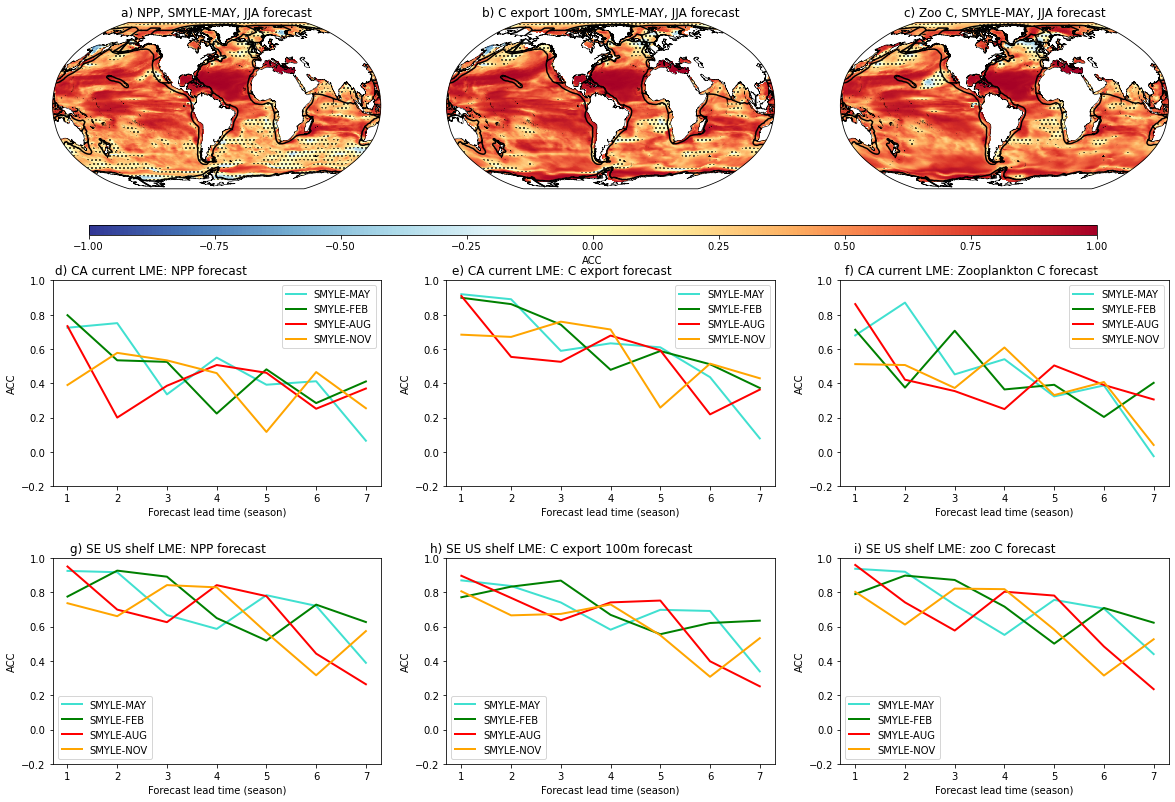
Kristen Krumhardt (Nov 03 2021 at 18:45):First draft of an ocean BGC figure. Top row is maps of ACC for a JJA forecast from a MAY initialization: NPP, carbon export, and zoo biomass . Second and third rows are ACC versus lead time (season) for NPP, carbon export, and zoo biomass for two example large marine ecosystems: the CA current and the SE US continental shelf.
oceanBGC_fig_v1.png
I will work on the layout a bit more and I'm also going try a few other ideas.. but just wanted to post this for now:)
Stephen Yeager (Nov 05 2021 at 15:22):Thanks Kristen! This looks like a great addition. Could you work on matching the format of existing plots? For map plots of ACC: https://github.com/NCAR/SMYLE-analysis/blob/main/notebooks/PaperFigs/SMYLEvsDPLE_GlobMaps_SAT.ipynb. For Regional ACC as a function of lead: https://github.com/NCAR/SMYLE-analysis/blob/main/notebooks/PaperFigs/Regional-average_SSTindex_skill.ipynb. For the latter, I've been meaning to include a persistence forecast as reference. Will let you know when I've got that included.
Kristen Krumhardt (Nov 05 2021 at 15:39):Ok, sounds great! I'll make those plots/maps match the style and will add persistence when you've got that included.
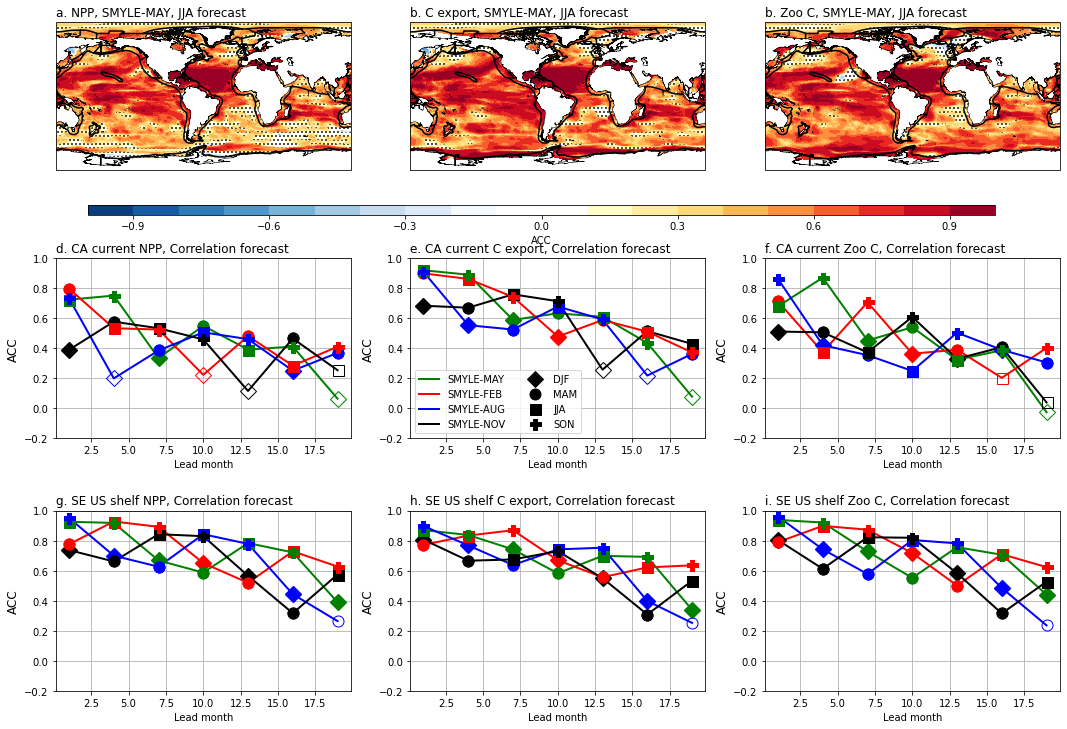
Kristen Krumhardt (Nov 18 2021 at 20:05):Just wanted to post some updated BGC figures. Here is the same one I posted last time but matching Steve's style:
BGC_fig.png
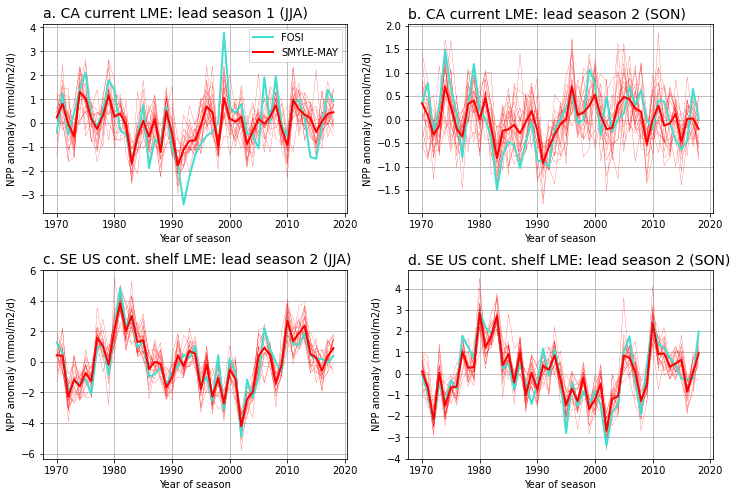
and here is another figure that shows the timeseries of NPP from the FOSI and lead seasons 1 (left) and 2 (right) forecasts from the SMYLE-MAY simulations for the California Current (top row) and SE US continental shelf LMEs (bottom row):
ts_2LMEs_FOSI_forecasts.png
Not sure the second figure belongs in the paper, but I think it's nice to visualize how the forecasts match the FOSI .
Stephen Yeager (Dec 15 2021 at 16:45):Thanks @Kristen Krumhardt . I've inserted your BGC_fig.png into the SMYLE paper and am adding some companion text which I'll ask you and Matt to revise as appropriate. I have a some requests: 1) could you edit the figure to correct the duplication of "b." in your panel labelling and to make the lead month axis show integer values corresponding to data points? 2) Can you confirm that your ACC is computed after detrending? 3) Could you push your notebook to https://github.com/NCAR/SMYLE-analysis/tree/main/notebooks/PaperFigs? Thanks.
Kristen Krumhardt (Dec 15 2021 at 19:50):Hi @Stephen Yeager , yes, I will do these modifications to the figure, then push the notebook to the repo and put the updated figure in the manuscript. I'm pretty sure that ACC is computed after detrending for this figure, but will check and verify that too... will get back to you soon.
Sathish Chandra Akula (Feb 07 2022 at 18:48):I wanted to work with the SMYLE dataset to improve soil moisture prediction. I was wondering if we have a way to access SMYLE dataset through NCAR Jupyter hub python notebook. Thanks for your help.
Stephen Yeager (Mar 07 2022 at 19:54):Sathish, we are working on a creating a clean repository of notebooks that will demonstrate how to analyze SMYLE using NCAR's Jupyterhub. Please check the SMYLE website for updates in coming weeks: https://www.cesm.ucar.edu/working-groups/earth-system-prediction/simulations/smyle/
Sathish Chandra Akula (Mar 09 2022 at 22:08):@Stephen Yeager Thank You for replying will definitely look at it and get back to you if i have any questions.
Last updated: May 16 2025 at 17:14 UTC