Matt Long (Dec 05 2020 at 23:30): Matt Long (Dec 05 2020 at 23:30):
@Colleen Petrik, here's a repo for coordinating analysis of DPLE-FEISTY
https://github.com/matt-long/fish-offline
As a first step, I started a notebook for extracting data from the FOSI integration:
https://github.com/matt-long/fish-offline/blob/main/notebooks/proc-cesm-dple-fields.ipynb
This creates a netCDF file, on disk here:
/glade/work/mclong/fish-offline/g.e11_LENS.GECOIAF.T62_g16.009.FIESTY-forcing.nc
I imagine this will require some iteration. Let me know what questions you have.
Colleen Petrik (Dec 08 2020 at 22:07):@Matt Long , I forked the directory, but have not yet run the code on Jupyterhub. Just looking at it, I realize I misspoke about the FEISTY inputs. The plankton fields should be 100-m integrations [sum(mass*dz)] in units of mass per m2. The cell thicknesses all look equal in the top 100 m, but it may be good to explicitly include it in the calculation.
Matt Long (Dec 08 2020 at 22:10):The integral is a straightforward modification.
Colleen Petrik (Dec 11 2020 at 01:07):I have been unable to spawn a server on DAV.
Matt Long (Dec 11 2020 at 16:11):I have a hypothesis:
SSH into the machine:
ssh -Y [your username]@cheyenne.ucar.edu
Execute this command:
mkdir -p /glade/scratch/${USER}/.jupyter_logs
Try again via jupyterhub.ucar.edu.
Colleen Petrik (Dec 12 2020 at 00:16):Excellent, that was the issue. Now a new one:
ModuleNotFoundError Traceback (most recent call last)
<ipython-input-4-df93822554da> in <module>
----> 1 from ncar_jobqueue import NCARCluster
2 from dask.distributed import Client
3 try:
4 cluster
5 client
ModuleNotFoundError: No module named 'ncar_jobqueue'
Matt Long (Dec 12 2020 at 00:28):Looks like you are not running in the right kernel. I apologize in advance, this is a bit arduous:
Download minicode:
wget https://repo.anaconda.com/miniconda/Miniconda3-latest-Linux-x86_64.sh
Run it
bash Miniconda3-latest-Linux-x86_64.sh
and follow the prompts (you can accept defaults)
Once you have a working conda installation (by following the steps above) generate the fish-offline environment by cd-ing into the repo directory and doing:
conda create -n fish-offline --file environment/conda-linux-64.lock
(Note: more generally you can do conda env create -f environment/environment.yml, but using the lock file replicates the environment I used exactly.)
Re-open your notebook and specific the fish-offline kernel (little drop down in upper right shows the kernel).
(@Michael Levy, did I miss anything?)
Colleen Petrik (Dec 22 2020 at 02:15):I did 1-3 on JupyterLab. To do 4, do I need to fork and clone the repo to my directory (/glade/u/home/cpetrik)? Currently, the kernel showing for the notebook is Pangeo Python 3.6. I do not get a drop down to change it anymore.
Matt Long (Dec 22 2020 at 02:16):you don't need to fork the repo, but rather clone it locally:
$ git clone REPO_URL
Matt Long (Dec 22 2020 at 02:16):the environment directory is in the repo. Does that make any sense?
Colleen Petrik (Jan 04 2021 at 22:56):Ok, I have set the conda fish offline environment. When I get to the 2nd section (Spin up dask cluster) I get an error:
Task exception was never retrieved
future: <Task finished coro=<_wrap_awaitable() done, defined at /glade/u/home/cpetrik/.conda/envs/fish-offline/lib/python3.7/asyncio/tasks.py:623> exception=RuntimeError('Command exited with non-zero exit code.\nExit code: 1\nCommand:\nsbatch /glade/scratch/cpetrik/tmpn5s3ha6q.sh\nstdout:\n\nstderr:\nsbatch: error: You must specify an account (--account)\nsbatch: error: Contact cislhelp@ucar.edu for assistance\nsbatch: error: Batch job submission failed: Access/permission denied\n\n')>
Traceback (most recent call last):
File "/glade/u/home/cpetrik/.conda/envs/fish-offline/lib/python3.7/asyncio/tasks.py", line 630, in _wrap_awaitable
return (yield from awaitable.__await__())
File "/glade/u/home/cpetrik/.conda/envs/fish-offline/lib/python3.7/site-packages/distributed/deploy/spec.py", line 50, in _
await self.start()
File "/glade/u/home/cpetrik/.conda/envs/fish-offline/lib/python3.7/site-packages/dask_jobqueue/core.py", line 310, in start
out = await self._submit_job(fn)
File "/glade/u/home/cpetrik/.conda/envs/fish-offline/lib/python3.7/site-packages/dask_jobqueue/core.py", line 293, in _submit_job
return self._call(shlex.split(self.submit_command) + [script_filename])
File "/glade/u/home/cpetrik/.conda/envs/fish-offline/lib/python3.7/site-packages/dask_jobqueue/core.py", line 393, in _call
"stderr:\n{}\n".format(proc.returncode, cmd_str, out, err)
RuntimeError: Command exited with non-zero exit code.
Exit code: 1
Command:
sbatch /glade/scratch/cpetrik/tmpn5s3ha6q.sh
stdout:
stderr:
sbatch: error: You must specify an account (--account)
sbatch: error: Contact cislhelp@ucar.edu for assistance
sbatch: error: Batch job submission failed: Access/permission denied
Matt Long (Jan 04 2021 at 23:00):@Colleen Petrik, try adding the following to the argument list of in the call to NCARCluster:
project='NCGD0011'
Matt Long (Jan 04 2021 at 23:02):Also, you can copy this file
/glade/u/home/mclong/.config/dask/ncar-jobqueue.yaml
to your home directory (~cpetrik/.config/dask/.) and edit to change all instances of mclong to cpetrik.
Colleen Petrik (Jan 05 2021 at 01:04):Thanks, Matt. Got the code running. What is the syntax for calculating the integrated biomass over the top 100 m?
da.sel(z_t=slice(0, 100e2)).sum('z_t')
or do I need a new function to compute sum(biom*dz)?
Matt Long (Jan 05 2021 at 03:18):Yes, to compute the integral, you need to multiply by dz
da_zint_100m = (da * ds.dz).sel(z_t=slice(0, 100e2)).sum('z_t')
A wrinkle, however, is that the biomass terms are stored on an alternative vertical dimension, z_t_150m, which is the upper 150 m (top 15 vertical levels). You can do something like
dz_150m = ds.dz.sel(z_t=slice(0, 100e2)).rename({'z_t': 'z_t_150m'})
and then use dz_150m in the computation of the integral.
Colleen Petrik (Jan 06 2021 at 01:29):Something like this:
def field_100m_int(da):
    """compute integrated upper 100 m"""
    depth_slice = slice(0, 100e2)
    with xr.set_options(keep_attrs=True):
        if 'z_t' in da.dims:
            return da_zint_100m = (da * ds.dz).sel(z_t=slice(0, 100e2)).sum('z_t')
        elif 'z_t_150m' in da.dims:
            dz_150m = ds.dz.sel(z_t=slice(0, 100e2)).rename({'z_t': 'z_t_150m'})
            da_100m = da.sel(z_t=slice(0, 100e2))
            return da_zint_100m = (da_100m * dz_150m).sum('z_t')
Colleen Petrik (Jan 06 2021 at 01:30):Also, how long should it take to execute? Just computing the TEMP mean has been running for over 25 min.
Matt Long (Jan 06 2021 at 15:54):@Colleen Petrik, looks like you are on the right track there. Here's a revised function:
def field_zint(da, dz, depth_slice=slice(0, 100e2)):
    """compute integral over `depth_slice"""
    if 'z_t' in da.dims:
        dz_loc = dz.sel(z_t=depth_slice)
        zdim = 'z_t'
    elif 'z_t_150m' in da.dims:
        dz_loc = dz.sel(z_t=slice(0, 150e2)).rename({'z_t': 'z_t_150m'}).sel(z_t_150m=depth_slice)
        zdim = 'z_t_150m'
    da_loc = da.sel({zdim: depth_slice})

    with xr.set_options(keep_attrs=True):
        return (da_loc * dz_loc).sum(zdim)
Matt Long (Jan 06 2021 at 15:55):Also, how long should it take to execute? Just computing the TEMP mean has been running for over 25 min.
I can't recall how long it took to execute. I think you want to check the dask dashboard to ensure it's working on something had hasn't hung. I ran the original notebook to completion and 20-30 min seems about right.
Matt Long (Feb 19 2021 at 23:31):@Colleen Petrik, I committed the changes we made to the repo. Output forcing file is here:
/glade/work/mclong/fish-offline/g.e11_LENS.GECOIAF.T62_g16.009.FIESTY-forcing.nc
Your CISL account has been restored. Looking forward to seeing some CESM-FIESTY results!
Colleen Petrik (Feb 23 2021 at 01:03):@Matt Long , I'll have to call CISL help to reset my password tomorrow. In addition to the forcing variables, I also need a gridfile with the depths and areas of each lat/lon grid cell.
Matt Long (Feb 23 2021 at 12:54):Here's a grid file for you:
/glade/work/mclong/fish-offline/grid-data-POP_gx1v6.nc
created by a new notebook in the repo. The grid area is TAREA and the depth of the model bottom in HT:
HT[j, i] = z_w_bot[KMT[j, i]]
Note that HT in this file is off by 1 k-level in a few isolated points comprising the locations of the "overflow" parameterization. Don't worry about this.
Colleen Petrik (Feb 24 2021 at 02:18):Thanks, @Matt Long ! I got my account working and have downloaded the files. Should be able to start running the FEISTY simulation tomorrow.
Colleen Petrik (Feb 25 2021 at 00:13):@Matt Long , I thought I'd start working on the Reynolds decomposition simulations. Should the mean of the forcing variable be a simple time average, a seasonal climatology, a linear trend (if one exists), or something else?
Matt Long (Feb 25 2021 at 00:55):I think that depends on what the research question is. Drivers of interannual variability? That would make the seasonal climatology an appropriate reference, I think.
Colleen Petrik (Feb 25 2021 at 19:10):Yeah, I think interannual variation is the question to start with.
Matt Long (Mar 31 2021 at 16:50):@Colleen Petrik, where are you at wrt working with the full DPLE?
Colleen Petrik (Mar 31 2021 at 17:03):@Matt Long , I have not started working with the full DPLE. We will need to extract similar means/integrations from the outputs. Will we be able to use the same method as the FOSI?
Kristen Krumhardt (Mar 31 2021 at 19:24):@Colleen Petrik I processed some of my 4 phyto/4 zoo model output to be ready for FEISTY. The output is here /glade/work/kristenk/fish-offline/g.e22a06.G1850ECOIAF_JRA_PHYS_DEV.TL319_g17.4p4z.004.FIESTY-forcing.nc
Please let me know if you have any questions about the variables :)
I'd be curious to see how the 4P4Z model does with FEISTY, whether or not you get reasonable fish distributions when using the this version of CESM...
Colleen Petrik (Apr 01 2021 at 19:35):Thanks, @Kristen Krumhardt ! I downloaded the file and will let you know how it goes.
Colleen Petrik (Apr 02 2021 at 20:09):@Matt Long and @Kristen Krumhardt , when post-processing the CESM outputs, I noticed that both the FOSI and 4P4Z zooplankton biomass integrations have negative values. How is this possible?
Kristen Krumhardt (Apr 02 2021 at 21:30):Hi Colleen, I think biomass fields can go slightly negative if calculated losses exceed production. I always treat negatives as zero. @Matt Long , perhaps you have a better explanation?
Matt Long (Apr 02 2021 at 21:39):@Colleen Petrik, negative values are typically associated with numerical errors in advection. These are typically isolated and small in magnitude—so if you are seeing negative integrals over the upper 150 m, I would suspect that there is a problem. Note that the advection scheme is mass conserving, inclusive of the negative values.
Colleen Petrik (Apr 02 2021 at 22:24):Would you like to look into this issue before I proceed, or should I just treat all negative values as zeros?
Matt Long (Apr 02 2021 at 22:26):I think if you are integrating, you can just ignore them.
Matt Long (Apr 02 2021 at 22:26):if you are looking pointwise, treat negative values as zero
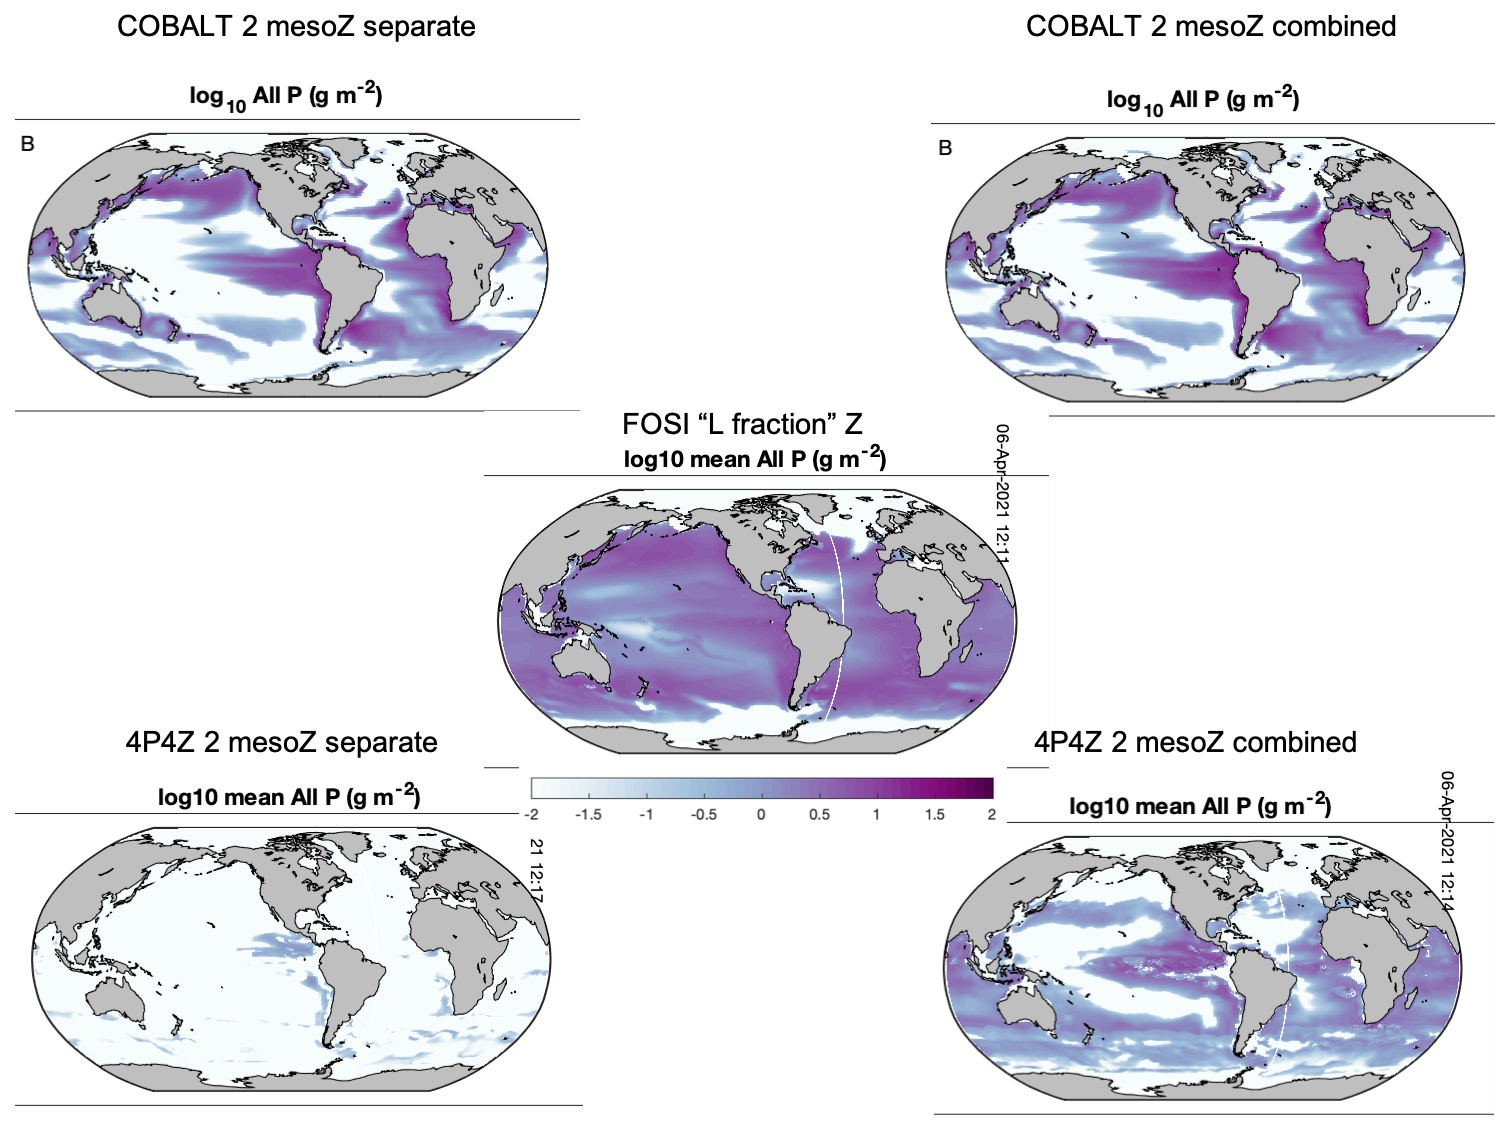
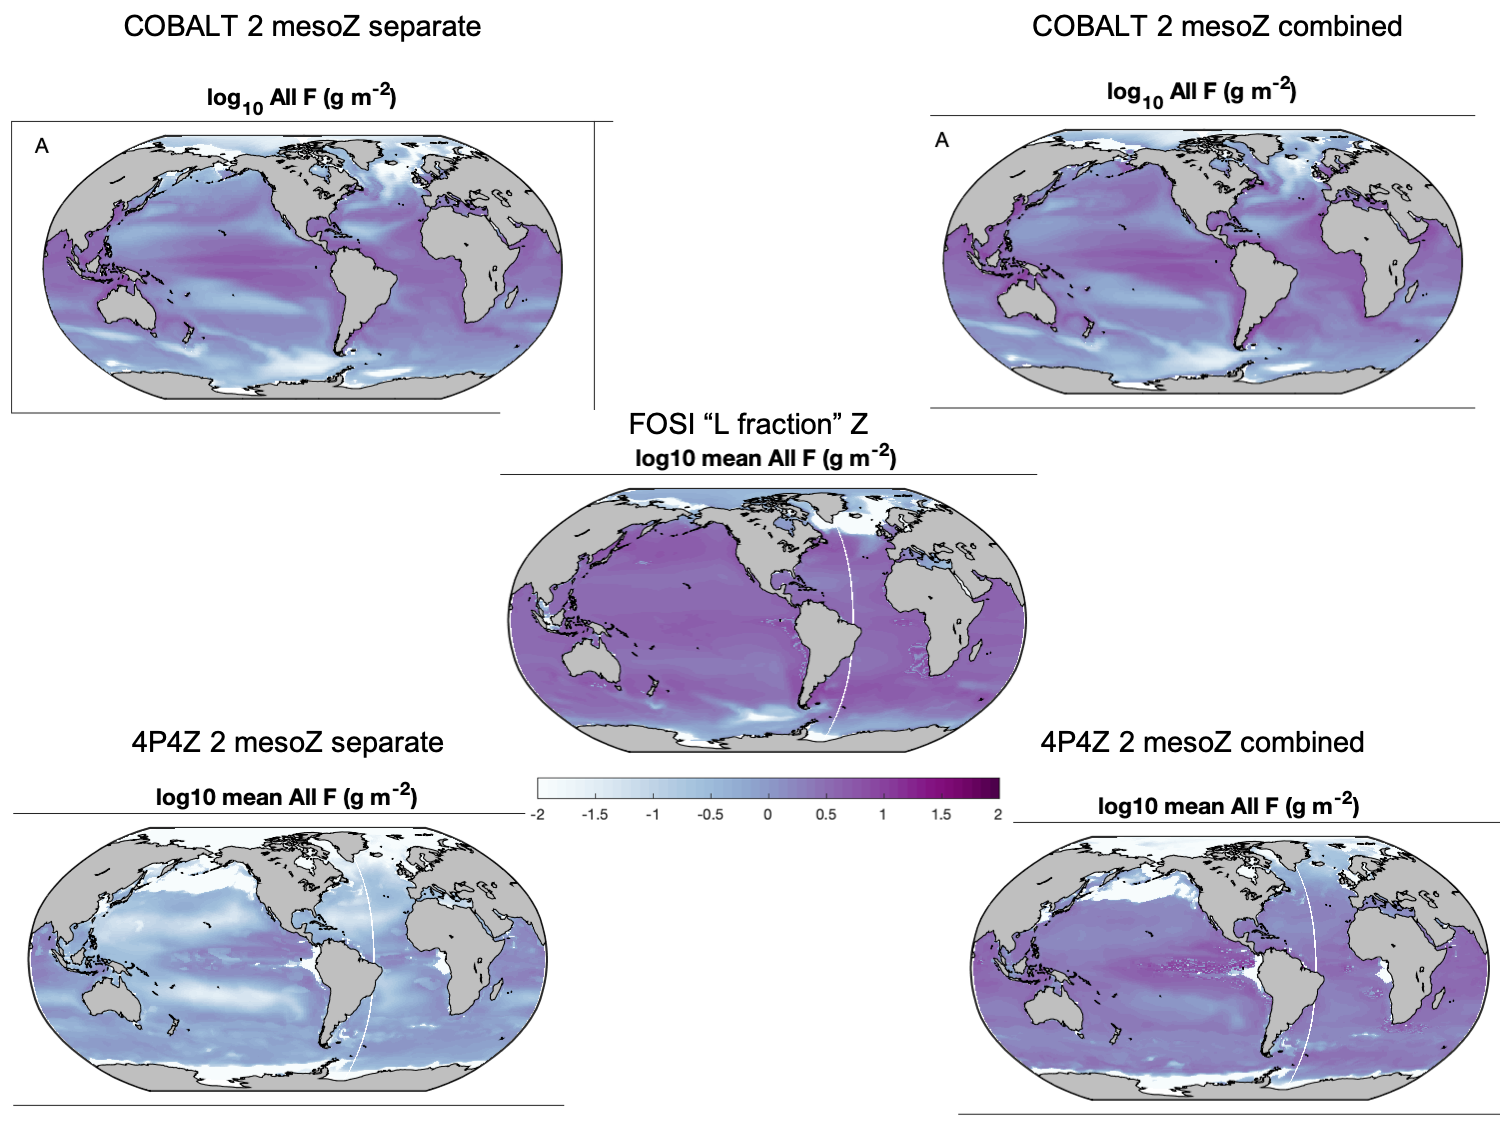
Colleen Petrik (Apr 06 2021 at 19:36):@Kristen Krumhardt , preliminary runs forcing FEISTY with the 4P4Z output suggest that the largest zooplankton mortality term is not large enough. FEISTY is typically run with 2 distinct mesozooplankton groups, small fish feed exclusively on the medium zoo, while medium fish feed with 25% preference on medium zoo and 100% preference on large zoo. FEISTY can also be run with 1 mesozooplankton group, allowing both small and medium fish to consume it with 100% preference. With 2 separate meszooplankton, almost no large pelagic fish can survive. The large pelagic biomass improves with combined mesozooplankton, but there are still regions without either large pelagic fish or small pelagic fish (forage fish) where we expect to find them. I attached a figure for comparison. 4P4Z_comparison_Pfish.png
Colleen Petrik (Apr 06 2021 at 19:37):Forage fish are here: 4P4Z_comparison_Ffish.png
Colleen Petrik (Apr 06 2021 at 19:38):Zooplankton biomasses are higher in the 4P4Z runs compared to the FOSI, but the mortality rates are much lower. And these are used to cap fish consumption so that mass is conserved with the BGC model.
Kristen Krumhardt (Apr 06 2021 at 19:45):Thanks, @Colleen Petrik ! This is really helpful to know... I was suspecting the mortality terms for zoo4 might be too low. I have some output from an older simulation where the mortality on zoo4 is quite a bit higher. I will process the output from this run for FEISTY and point you to the output, then perhaps you could re-make these plots with that output?
Colleen Petrik (Apr 06 2021 at 21:36):No problem, @Kristen Krumhardt . And let me know if there are other quantities you'd like to see. I also output the ratio of fish consumption to mortality if that is helpful.
Colleen Petrik (Apr 09 2022 at 00:00):@Matt Long , the FEISTY FOSI output is here
/glade/work/cpetrik/fish-offline/feisty_output/Dc_Lam700_enc70-b200_m400-b175-k086_c20-b250_D075_A050_sMZ090_mMZ045_nmort1_BE08_CC80_RE00100/FOSI/
aggregated by group. s=small; m=medium; l=large, f=forage; p=large pelagic; d=demersal; b=benthic inverts; v=all vertebrates (all fish)
Matt Long (Apr 10 2022 at 18:40):Thanks @Colleen Petrik!
FYI, I had to do this to make your files readable by Xarray:
module load nco
ncrename -d lat,nlat -d lon,nlon feisty_cesm-fosi_monthly_tvb_.nc feisty_cesm-fosi_monthly_tvb_.nc
The dimensions lon and lat conflicted with the 2D variables lon and lat, which violates the netCDF data model conventions.
Matt Long (Apr 10 2022 at 18:44):gWW m-2 = g wet weight?
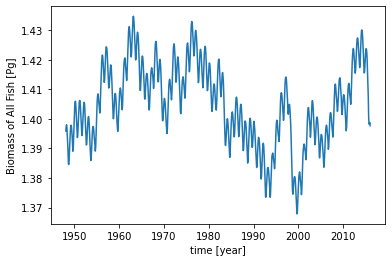
Matt Long (Apr 10 2022 at 18:48):Here is a plot of globally integrated total fish (all vertebrates) biomass:
image.png
Does that make sense to you? I don't have any clear sense of what the right order of magnitude should be. Order 1 Pg?
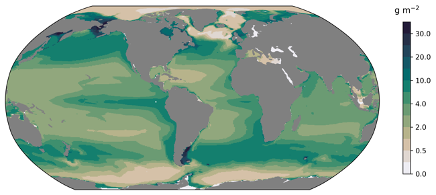
Matt Long (Apr 10 2022 at 21:46):Annual mean fish:
image.png
Matt Long (Apr 10 2022 at 21:47):Std dev.
image.png
Matt Long (May 16 2022 at 20:21):@Colleen Petrik, I generated FEISTY forcing from the SMYLE-FOSI here:
/glade/work/mclong/fish-offline/g.e22.GOMIPECOIAF_JRA-1p4-2018.TL319_g17.SMYLE.005.FIESTY-forcing.nc
Used upper 100m as this was the only depth over which zoo_loss was available.
Matt Long (May 16 2022 at 20:21):cc @Fred Castruccio
Colleen Petrik (May 25 2022 at 21:35):Thanks, I downloaded it. Are we doing these runs for any particular reason?
Hyunggyu Lim (Jul 26 2022 at 18:53):@Zhuomin Chen Hi Zhoumin, Thanks for comments in last meeting. I would like to follow your analysis for DPLE for consistency of results. Could you point your method specifically or script for temperature if you don't mind? I use grads and fortran scripts before but I would like to learn new coding as well.
Hyunggyu Lim (Jul 27 2022 at 13:38):Hi @Kristen Krumhardt , Thanks for your comment. utils.py is now loaded in prep_upper_fields_DPLE.ipynb based on CMIP kernal. I run it that shows the error message. I wonder this is what you saw before.
AssertionError Traceback (most recent call last)
/glade/scratch/hglim/ipykernel_70577/1003656566.py in <module>
11 #first get this particular file
12 ds = xr.open_dataset(
---> 13 utils.file_in(var,styear,member),
14 decode_coords=False,
15 decode_times=True,
~/analysis/FEISTY/NOTE/kristenk/fish-offline-kristens_branch/notebooks/utils.py in file_in(var, styear, member)
53
54
---> 55 assert os.path.exists(file), f'missing {file}'
56 return file
57
AssertionError: missing /glade/campaign/cesm/collections/CESM1-DPLE/ocn/proc/tseries/monthly/zooC/b.e11.BDP.f09_g16.1954-11.001.pop.h.zooC.195411-196412.nc
if I run "prep_bottom_fields_DPLE.ipynb" I can see below message after runing PBSCluster section.
tornado.application - ERROR - Exception in callback functools.partial(<bound method IOLoop._discard_future_result of <zmq.eventloop.ioloop.ZMQIOLoop object at 0x7fbda8a657d0>>, <Task finished coro=<SpecCluster._correct_state_internal() done, defined at /ncar/usr/jupyterhub/envs/cmip6-201910/lib/python3.7/site-packages/distributed/deploy/spec.py:333> exception=RuntimeError('Command exited with non-zero exit code.\nExit code: 170\nCommand:\nqsub /glade/scratch/hglim/tmpg7uyk2kh.sh\nstdout:\n\nstderr:\nqsub: Unknown queue\n\n')>)
Traceback (most recent call last):
File "/ncar/usr/jupyterhub/envs/cmip6-201910/lib/python3.7/site-packages/tornado/ioloop.py", line 741, in _run_callback
ret = callback()
File "/ncar/usr/jupyterhub/envs/cmip6-201910/lib/python3.7/site-packages/tornado/ioloop.py", line 765, in _discard_future_result
future.result()
File "/ncar/usr/jupyterhub/envs/cmip6-201910/lib/python3.7/site-packages/distributed/deploy/spec.py", line 371, in _correct_state_internal
await w # for tornado gen.coroutine support
File "/ncar/usr/jupyterhub/envs/cmip6-201910/lib/python3.7/site-packages/distributed/deploy/spec.py", line 67, in _
await self.start()
File "/ncar/usr/jupyterhub/envs/cmip6-201910/lib/python3.7/site-packages/dask_jobqueue/core.py", line 325, in start
out = await self._submit_job(fn)
File "/ncar/usr/jupyterhub/envs/cmip6-201910/lib/python3.7/site-packages/dask_jobqueue/core.py", line 308, in _submit_job
return self._call(shlex.split(self.submit_command) + [script_filename])
File "/ncar/usr/jupyterhub/envs/cmip6-201910/lib/python3.7/site-packages/dask_jobqueue/core.py", line 408, in _call
"stderr:\n{}\n".format(proc.returncode, cmd_str, out, err)
RuntimeError: Command exited with non-zero exit code.
Exit code: 170
Command:
qsub /glade/scratch/hglim/tmpg7uyk2kh.sh
stdout:
stderr:
qsub: Unknown queue
Zhuomin Chen (Aug 01 2022 at 21:39):Hyunggyu Lim said:
Zhuomin Chen Hi Zhoumin, Thanks for comments in last meeting. I would like to follow your analysis for DPLE for consistency of results. Could you point your method specifically or script for temperature if you don't mind? I use grads and fortran scripts before but I would like to learn new coding as well.
Hi Hyunggyu, sorry I usually missed messages here. I have just replied your email about your questions. If you would like to look at temperature predictability using DPLE, I could help with that as I have done it already (maybe not on the same level). @Hyunggyu Lim
Michael Levy (Feb 02 2023 at 17:58):@Kristen Krumhardt , @Elena Romashkova and I have been working on this quite a bit recently, and it seems like we're long overdue for an update in this channel... all of the plots I'm going to share came from code on a branch that is still in an open PR (#45) but I hope to merge it back to main today or tomorrow.
So first the good news:
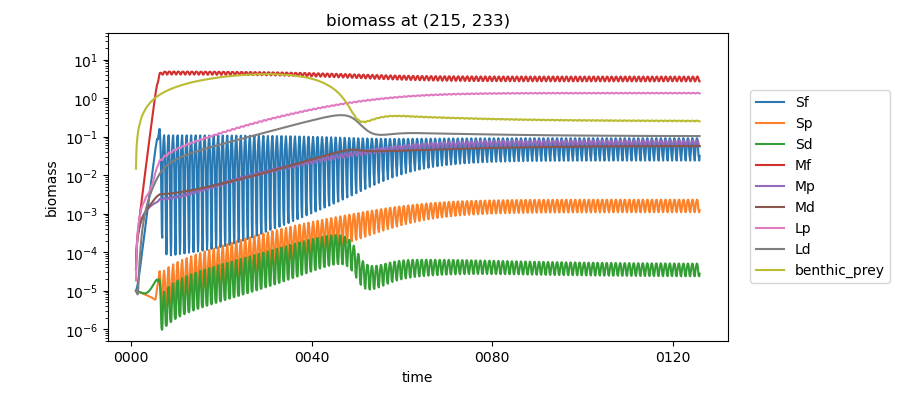
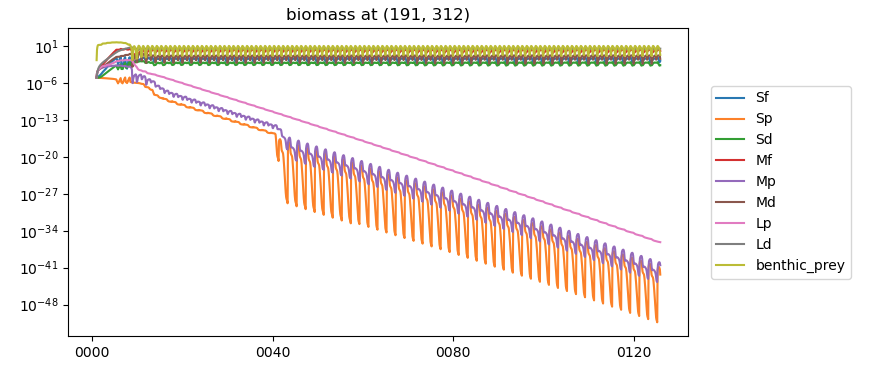
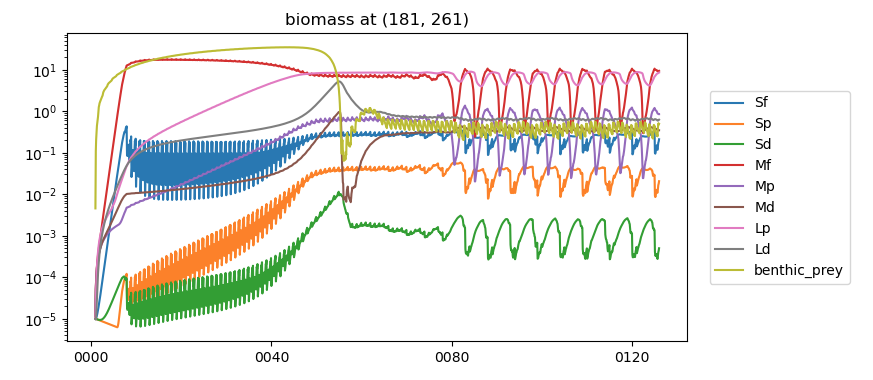
Exploring the spin-up has led to some bad news, though:
but then the pelagic functional types seemed to be constantly declining at another point :
125-year-spinup-003-diff-gridpoint.png
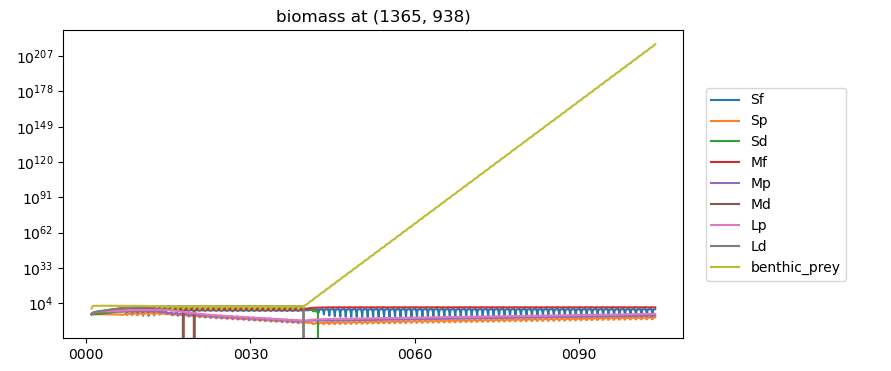
and a third point shows multi-year cycles (despite the forcing being a 1-year cycle):
125-year-spinup-003-third-gridpoint.png
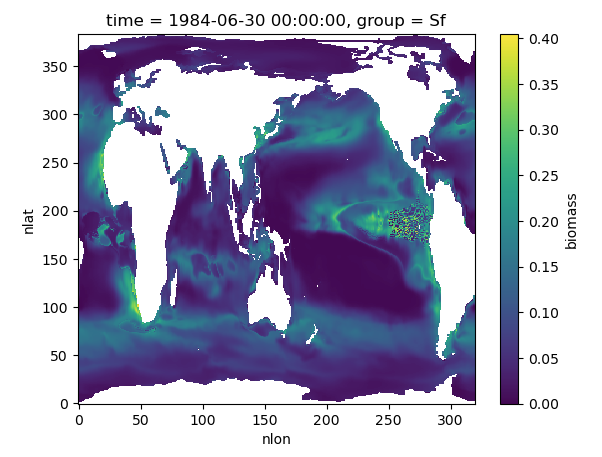
June-30-1984-companion-Sf-map.png
note all the noise in the eastern equatorial Pacific -- the time series plot that shows the multi-year cycles is actually a point in that noisy region.
@Colleen Petrik I think we (including Kristen and Elena) should talk some to figure out next steps...
Colleen Petrik (Feb 02 2023 at 19:30):Hi @Michael Levy (and @Kristen Krumhardt , @Elena Romashkova , @Rémy Denéchère ). These 3 examples are all common in spinup.
#1 is what you hope to achieve in most places.
#2 is what happens in locations where either (a) there are not enough resources to sustain large pelagic fish or (b) the demersal fish outcompete the large pelagics. Any time that their biomass (gWW/m2) drops below 10^-6 they are effectively not there. It is fine to stop the spinup before they equilibrate, because they will just drop to whatever the minimum value allowed in the simulation is (in the Matlab version, it was 10^-16).
#3 is the result of predator-prey cycles between the forage fish and the large pelagics. This is expected from a theoretical ecology perspective. It tends to happen in highly productive regions like the Eastern Equatorial Pacific upwelling zone and creates that incoherent pattern of high and low biomasses in neighboring grid cells. The cycles are just out of phase with each other in those cells. Thus it is important to average over a chunk of time to create the initial biomasses from the spinup. I use the mean of the last year of the spinup, but it would be good to calculate how long the cycles are. I also think that tuning the model will dampen these cycles, as the base model of FEISTY forced by COBALT does not result in them.
Colleen Petrik (Feb 02 2023 at 19:31):p.s. Can we move these messages out of the "literature" stream and into the "offline FEISTY" stream?
Michael Levy (Feb 02 2023 at 19:41):Colleen Petrik said:
p.s. Can we move these messages out of the "literature" stream and into the "offline FEISTY" stream?
well, I seem to have made it worse... I thought I was moving my message out of literature (I could've sworn I had put it in "high res"), but it looks like I maybe merged all of literature into offline FEISTY?
Michael Levy (Feb 02 2023 at 19:52):okay, the comment about IPSL is back in #fisheries > literature ; I scanned through this topic and didn't see any other messages that looked like they had been moved but if I missed anything let me know.
Back on topic, thanks for the details on the different possible spinup modes. Should we introduce a floor for the biomass (perhaps 1e-16, to match the matlab code)? I'll look into using an average value for the initial conditions, right now we're just starting from the Dec 31 values as if we were continuing the run exactly. Do you think initializing from a time mean instead of instantaneous value will fix the spatial noise we are seeing in the [instantaneous] map?
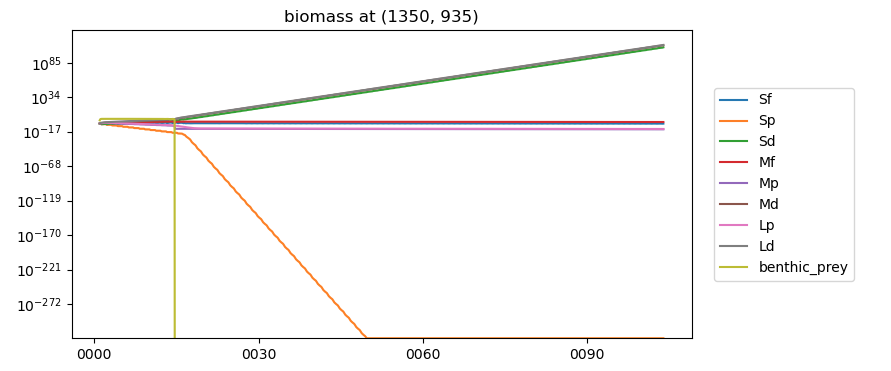
Michael Levy (Feb 08 2023 at 22:56):I've found two more interesting points in the high res spinup (the companion spinup does not have any grid cells exhibiting this behavior): in one, most of the biomass grows uncontrollably large:
highres-103-year-spinup-uncontrolled-benthic.png
In this plot, the demersal biomasses all go negative (and the drop in large demersal coincides with the beginning of the growth of benthic prey).
In the other grid cell, benthic prey biomass goes negative in year 15 and that seems to cause the demersal biomasses to grow uncontrollably.
highres-103-year-spinup-negative-benthic.png
The small pelagic biomass does not go negative, but it does plummet to 2.5e-323 by year 50 and then stay there for the rest of the run. (I'm surprised this does not trigger underflow warnings... or maybe it does and I'm not looking for them in the right place?)
@Colleen Petrik have you run into individual points going off the rails like this? @Kristen Krumhardt, did you want to chime in with your thoughts on the effect the high resolution dynamics might be playing? (I don't want to misrepresent what you mentioned after the BGCWG meeting)
Michael Levy (Feb 08 2023 at 23:38):Despite the above issue (which we can also discuss on github), I just merged my PR. @Kristen Krumhardt and @Elena Romashkova you should be able to switch to main. I did sneak in a last-second change to the temporal offset applied to POP forcing; rather than subtracting a full day from the POP calendar (treating 0001-01-02 0:00:00 as the start of January 1st), I only subtract a half day (treating it as 0001-01-01 12:00:00). This should have a small effect on the runs, but I think fixing the issues in the spinup will have a much bigger effect.
Colleen Petrik (Feb 09 2023 at 19:12):Some diagnostics for tuning FEISTY, to be calculated within the model at each time step:
feeding level [unitless]= consumption [g/g/d] / cmax [g/g/d]
gross growth efficiency (gge) [unitless] = nu [g/g/d] / consumption [g/g/d]
production [g/m2/d] = nu [g/g/d] * biomass [g/m2]
Colleen Petrik (Feb 09 2023 at 19:14):Michael Levy said:
I've found two more interesting points in the high res spinup (the companion spinup does not have any grid cells exhibiting this behavior): in one, most of the biomass grows uncontrollably large:
highres-103-year-spinup-uncontrolled-benthic.png
In this plot, the demersal biomasses all go negative (and the drop in large demersal coincides with the beginning of the growth of benthic prey).
In the other grid cell, benthic prey biomass goes negative in year 15 and that seems to cause the demersal biomasses to grow uncontrollably.
highres-103-year-spinup-negative-benthic.png
The small pelagic biomass does not go negative, but it does plummet to 2.5e-323 by year 50 and then stay there for the rest of the run. (I'm surprised this does not trigger underflow warnings... or maybe it does and I'm not looking for them in the right place?)
Colleen Petrik have you run into individual points going off the rails like this? Kristen Krumhardt, did you want to chime in with your thoughts on the effect the high resolution dynamics might be playing? (I don't want to misrepresent what you mentioned after the BGCWG meeting)
In today's meeting we mentioned the need to prevent negative biomasses and negative POC fluxes before forcing FEISTY and after each time step. And also setting a floor for biomass would be good.
Michael Levy (Mar 06 2023 at 17:49):I've got a question about diagnostics... in previous meetings, we've talked about saving production and catch along with biomass. I think the full list of diagnostics we can currently provide from the python code is
    diagnostic_names=[
        "T_habitat",
        "ingestion_rate",
        "predation_flux",
        "predation_rate",
        "metabolism_rate",
        "mortality_rate",
        "energy_avail_rate",
        "growth_rate",
        "reproduction_rate",
        "recruitment_flux",
        "fish_catch_rate",
        "encounter_rate_link",
        "encounter_rate_total",
        "consumption_rate_max_pred",
        "consumption_rate_link",
    ],
The fish_catch_rate varies by functional type, but has no spatial or temporal variance:
Sf: 0.0
Sp: 0.0
Sd: 0.0
Mf: 0.000821917808219178
Mp: 8.219178082191781e-05
Md: 8.219178082191781e-05
Lp: 0.000821917808219178
Ld: 0.000821917808219178
Do we want to multiply this term by biomass? Or do we need to compute something different?
Also, is the production term just growth_rate or the sum of growth_rate and a few other terms? Or maybe something else entirely?
Colleen Petrik (Mar 08 2023 at 21:18):@Michael Levy , I provided how to calculate the diagnostics for feeding level, gross growth efficiency, and production in the comment above on Feb 9th. Those were the names of the terms in the Matlab code, their names in the Python code are (I think)
For fishing yield, it is not the catch rate. It is the fishing mortality * selectivity * biomass at each time step. In the Matlab code it is the "caught" term calculated with the "sub_fishing_rate.m" function.
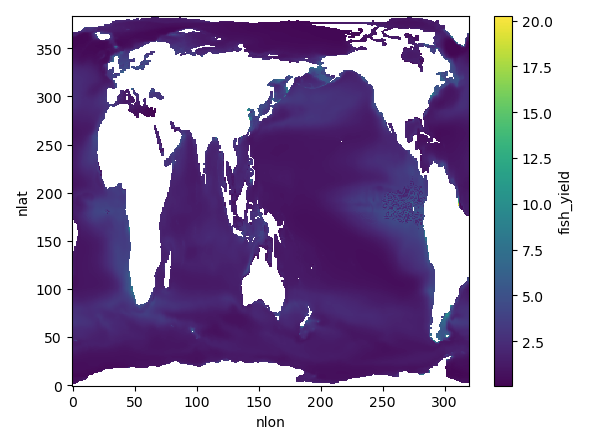
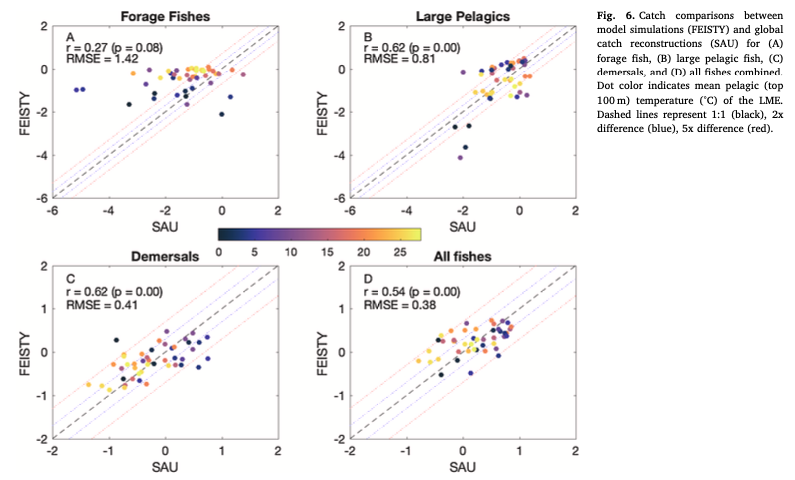
Michael Levy (Jul 12 2023 at 19:58):It has taken a little while, but I added production (biomass * energy_avail_rate) and fish yield (biomass * fish_catch_rate) to the diagnostic output in the python version of FEISTY. Adding two additional variables causes dask to hang on the ds.to_zarr() call in the high-res case, but I can look at these variables in the 1 degree while I ponder how to refactor the code to be more memory-friendly... here's a spatial plot of total fish yield for 1958 (I'm 99% sure the units are g / m^2 / year):
The plot to compare to in Colleen's 2019 paper is a scatter plot:
As a first-order check, I just looked at the min and max of log10 of yield for each of the four classes in the scatter plot above:
Forager yield ranges from -68.39 to 0.52 (log scale)
Large pelagic yield ranges from -68.79 to 0.51 (log scale)
Demersal yield ranges from -3.07 to 1.23 (log scale)
Total yield ranges from -1.13 to 1.31 (log scale)
Comparing those numbers to y-axis of each of the four panels, I think we're doing this computation right... @Kristen Krumhardt will try to recreate the scatter plot once this is merged to main
Colleen Petrik (Aug 22 2023 at 19:08):@Michael Levy and @Elena Romashkova . I just saw the git comment on fishing units. The native units in FEISTY are grams wet weight per m2 (per day if a rate). Thus, all ESM forcing variables are converted into those units. The fishing yield output is gWW/m2/d. If you want to calculate annual fishing yield, you just multiply by the grid cell area and 365.
Last updated: May 16 2025 at 17:14 UTC