Matt Long (Feb 19 2021 at 18:00): Matt Long (Feb 19 2021 at 18:00):
A digital twin of Earth for the green transition
I found this article quite stimulating, articulating a vision of data-model fusion that I think we should aspire too.
Katie Dagon (Feb 22 2021 at 19:00):It looks like there is a ECMWF webinar on this topic, though it is in the morning UK time. Perhaps it will be recorded: https://events.ecmwf.int/event/234/
Matt Long (Mar 10 2021 at 18:27):I created an ESDS category on Discourse; I think we should consider cultivating conversations there. @Orhan Eroglu, this would be a broader venue for GeoCAT updates.
https://discourse-nsa.ucar.edu/c/esds/8
Orhan Eroglu (Mar 10 2021 at 19:11):I created an ESDS category on Discourse; I think we should consider cultivating conversations there. Orhan Eroglu, this would be a broader venue for GeoCAT updates.
https://discourse-nsa.ucar.edu/c/esds/8
Thanks Matt, I will check it out once my new discourse account is approved
Matt Long (Mar 10 2021 at 19:25):Approved!
Matt Long (Mar 17 2021 at 18:29):@all, here's an exceptional example of a great collaborative effort, showing how to close a heat budget in POP using xgcm:
https://pop-tools.readthedocs.io/en/latest/examples/CloseHeatBudget_POP2.html
Full credit to @Anna-Lena Deppenmeier, @Deepak Cherian, @Yassir Eddebbar and @Anderson Banihirwe.
Awesome to see this come together.
Matt Long (Mar 19 2021 at 15:30):Interesting conversation here:
https://discourse.jupyter.org/t/feature-idea-jupyterhub-binderhub-jupyter-book-as-a-publishing-platform/8359
Katie Dagon (Mar 19 2021 at 23:22):Relevant talk from Theo McCaie at the UKMO: https://portal.enes.org/community/announcements/Youdoyou..pdf
This was part of a workshop this past week on 'New Opportunities for ML and AI in Weather and Climate Modelling' (https://portal.enes.org/community/announcements/events/joint-is-enes3-esiwace2-virtual-workshop-on-new-opportunities-for-ml-and-ai-in-weather-and-climate-modelling)
Michael Levy (Mar 31 2021 at 18:48):An interesting blog post by Sam Partee* came up at the CSEG meeting yesterday. Basically, there was a terrible Wired article lamenting the fact that climate models are written in (gasp) Fortran and Sam's post is a good rebuttal. (The Wired link might require a private browser window to be readable).
Sam is collaborating with Scott B and Gustavo M on a machine-learning project that was featured in a CGD seminar from February.
Kristen Krumhardt (Mar 31 2021 at 18:57):I read this post by Sam Partee a few days ago and found it very useful in explaining why Fortran is used for climate models. I thought it was great the way he outlined all the positive points about Fortran ;)
Katie Dagon (Apr 05 2021 at 19:58):A relevant python package for AI/ML workflows: https://aiqc.readthedocs.io/en/latest/
Deepak Cherian (Apr 08 2021 at 14:52):https://know.anaconda.com/MakingReproducibleConda-basedProjects_LP.html?es_id=057f1fde31
Webinar: Making Reproducible Conda-based Projects
Wednesday, May 19 at 2pm EDT/11am PDTEveryone knows how good Conda is at providing you a development environment for your Python projects, but how do you capture what you created when you're ready to share it or save it? How can you collaborate with others on it, publish a specific version of it, archive a snapshot of the project for posterity, or deploy a live running server with your code?
In each of these cases, you need not just an environment but also a project: a Conda environment coupled closely with a set of commands that can execute in that environment. This webinar will show you why it is essential to capture reproducible projects and how you can use Conda to do it.
Matt Long (Apr 08 2021 at 19:28):"The Unidata netCDF team is happy to announce the availability of netCDF 4.8.0 C library, now with Zarr support (nczarr)!"
https://www.unidata.ucar.edu/blogs/news/entry/netcdf-4-8-0
Max Grover (Apr 09 2021 at 14:40):For those who work with model output stored in grib format...
"Happy to announce the release of @ECMWF cfgrib 0.9.9.0, the library to access climate and meteo GRIB files with xarray and Python. Highlights: much better performance on big files (10k+ messages), use the official and faster ecCodes bindings." https://pypi.org/project/cfgrib/0.9.9.0/
Max Grover (Apr 14 2021 at 01:39):The American Meteorological Society released their recordings from the Python Workshop (focused on climate and weather data)! If you are interested in this, check out this link! https://youtu.be/uQZAEPnUZ5o (there are several videos from the different days)
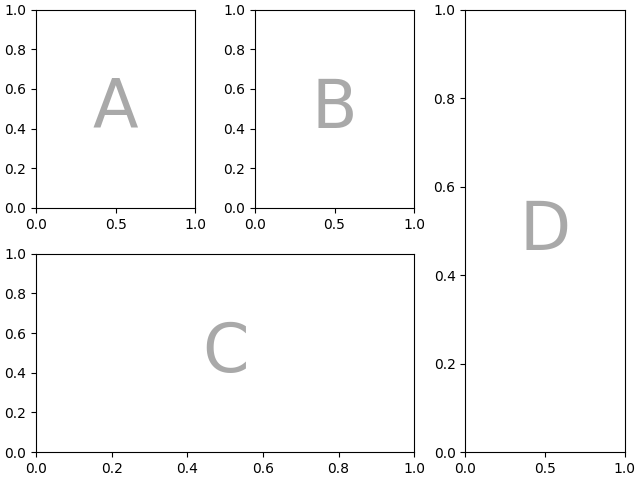
Max Grover (Apr 14 2021 at 19:26):Matplotlib's new release includes a new way to create figure panels where you can pass a layout id'ed on name! Here is a link to an example https://matplotlib.org/stable/tutorials/provisional/mosaic.html#sphx-glr-tutorials-provisional-mosaic-py
axd = plt.subplot_mosaic(
    """
    ABD
    CCD
    """)
Matt Long (Apr 14 2021 at 22:42):Thanks to @Anderson Banihirwe, ncar-jobqueue has been updated! See #dask for more details.
Max Grover (Apr 19 2021 at 16:40):Registration has opened for the "Trustworthy Artificial Intelligence for Environmental Science (TAI4ES) Summer School"! If you are interested in attending, check out the website https://www2.cisl.ucar.edu/tai4es
The summer school runs July 26-30, 2021
Registration is free and it looks they have some great talks lined up for this year's event!
Max Grover (Apr 22 2021 at 15:17):Interesting article from Ryan Abernathey https://medium.com/pangeo/closed-platforms-vs-open-architectures-for-cloud-native-earth-system-analytics-1ad88708ebb6
Max Grover (Apr 26 2021 at 17:33):Interested in working with Jupyter notebooks from the command line? Check out this new post from the Jupyter Blog https://blog.jupyter.org/nbterm-jupyter-notebooks-in-the-terminal-6a2b55d08b70
Isla Simpson (Apr 26 2021 at 19:51):Interested in working with Jupyter notebooks from the command line? Check out this new post from the Jupyter Blog https://blog.jupyter.org/nbterm-jupyter-notebooks-in-the-terminal-6a2b55d08b70
I am very interested in this. However, I tried to add this to my environment (which is not very complex) and it failed because of conflicts. Have you successfully got this working?
Matt Long (Apr 26 2021 at 19:53):@Isla Simpson, did you try to install with conda using -c conda-forge or pip?
What part is interesting? There are other approaches to batch processing notebooks, for example.
Max Grover (Apr 26 2021 at 19:55):I would try installing via pip instead of conda-forge
Max Grover (Apr 26 2021 at 19:56):or use mamba (which they recommend in the post) which would require
conda install -c mamba
then
mamba install nbterm -c conda-forge
Isla Simpson (Apr 26 2021 at 19:57):I just tried adding it into my yml file and then tried to update my environment using the yml file. I'm just interested in it because I like to do everything in the terminal. I get frustrated that I can't just open up a notebook with vi and instead have to launch the whole browser business.
Anna-Lena Deppenmeier (Apr 28 2021 at 17:34):Hi all, is the time for the ESDS meetings set for Mondays at 2pm? I saw a poll come by a while ago to find a time, but haven't heard whether there is a consensus on time?
Matt Long (Apr 28 2021 at 17:36):Yes, we settled on 2p Monday. Sorry we didn't make that more explicit.
Max Grover (May 05 2021 at 15:10):For anyone interested in learning more about Dask, the team at Coiled is offering a free course here https://training.talkpython.fm/courses/introduction-to-scaling-python-and-pandas-with-dask! Although the course is moreso focused on working with tabular data using pandas, the fundamentals covered can be helpful!
Max Grover (May 11 2021 at 16:29):We updated a few sections of the ESDS website, including a best practices page! Feel free to check out the latest updates, if you have suggestions please submit an issue on the repository! https://github.com/NCAR/esds/issues
Max Grover (May 24 2021 at 21:33):Last week, the team at Anaconda presented on "Making Reproducible Conda-based Projects" - if you are interested in the slide deck, check it out here
Brian Medeiros (May 29 2021 at 16:13):Hi all, I have heard several comments that people would like to see examples using python as on the NCL website. I know that GeoCAT has been expanding their library of examples (https://geocat-examples.readthedocs.io/en/latest/), which is great. I've also replicated some of the NCL examples in a repository here: https://github.com/brianpm/hacknostics.
I have now added most of NCL's bootstrapping examples. They are all in one Notebook, and I also exported the notebook to HTML:
I think for those looking to "pivot", this might be useful because I show how to implement the NCL functions (in as simple a way as possible, I think).
@Orhan Eroglu -- if you want to take any of this for GeoCAT, feel free.
Orhan Eroglu (Jun 01 2021 at 13:02):Thank you for putting this effort and bringing to here, @Brian Medeiros !
I skimmed through your hacknostics repo and bootstrapping notebook, and we could make use of them in our GeoCAT-examples gallery, crediting your work. For those who haven't interacted with the gallery yet, we are implementing each plotting example separately in a Python script, which is also auto-generated to a Jupyter notebook. That said, instead of generating a single notebook for the whole NCL examples list (i.e. bootstrapping in this case), I think we would create separate scripts for each of those plots when it comes to include them in our gallery.
For your reference, I have created this GeoCAT-examples issue #353 to follow with this.
cc: @Anissa Zacharias @Michaela Sizemore
Max Grover (Jun 10 2021 at 15:01):Looks like the Pangeo gallery recently added a section on Glaciology! For any interested in working with glacier related datasets, check this out! https://gallery.pangeo.io/repos/ldeo-glaciology/pangeo-glaciology-examples/index.html
Max Grover (Jun 16 2021 at 02:27):AGU just launched a new "AGU Data Leadership" site - they have some great resources + a blog! https://data.agu.org/
Max Grover (Jun 21 2021 at 14:40):CISL is soliciting feedback on Derecho (the new supercomputer) - there is a survey regarding
".. questions about storage policies, software needs, job scheduling policies and capabilities, and cloud bursting and cloud integration with the PBS Pro scheduler."
Here is a link to the survey
John Clyne (Sep 14 2021 at 16:22):Be sure to check out the CISL Seminar on "GeoCAT and Creating Python Software for Big Data and HPC", presented by Anissa Zacharias on Wednesday, Sept 22 at 1pm. Details here: https://www2.cisl.ucar.edu/calendar/cisl-seminar-geocat-and-creating-python-software-big-data-and-hpc
Matt Long (Oct 05 2021 at 14:14):New EarthCube Peer-Reviewed Jupyter Notebooks
A novel element of the 2020 and 2021 EarthCube Annual Meetings was a call for notebooks, which led to over 30 peer-reviewed Jupyter notebooks that encompass an array of geoscience data tools, software, services, and libraries. Each notebook was reviewed by scholars within the geoscience and cyberinfrastructure community.
"EarthCube's second call for notebooks as peer-reviewed scholarly objects was even bigger this year, with nearly double the submissions," said Kenton McHenry, associate director for software at the National Center for Supercomputing Applications (NCSA). "Nineteen notebooks were accepted and presented at the EarthCube Annual Meeting during a two-track session - one focused on research and education while the other focused on demonstrations of software."
The accepted notebooks along with DOIs that can be used to cite them are available through a Jupyter Book, which serves as the meeting's online proceedings.
Matt Long (Oct 06 2021 at 18:24):AWS CMIP6 Data Informational Session
In April, Amazon announced that it is now hosting petabytes of data from the largest and most updated climate simulation dataset in the world. This was made possible through cloud grants from the Amazon Sustainability Data Initiative (ASDI) provided to the Earth System Grid Federation (ESGF) and Pangeo. With this effort, Amazon is enabling climate researchers worldwide to access and analyze the dataset used for the United Nation’s Intergovernmental Panel on Climate Change’s Sixth Assessment Report (IPCC-AR6) on the Amazon Web Services (AWS).
More information: https://cmip6datainformationalsession.splashthat.com/
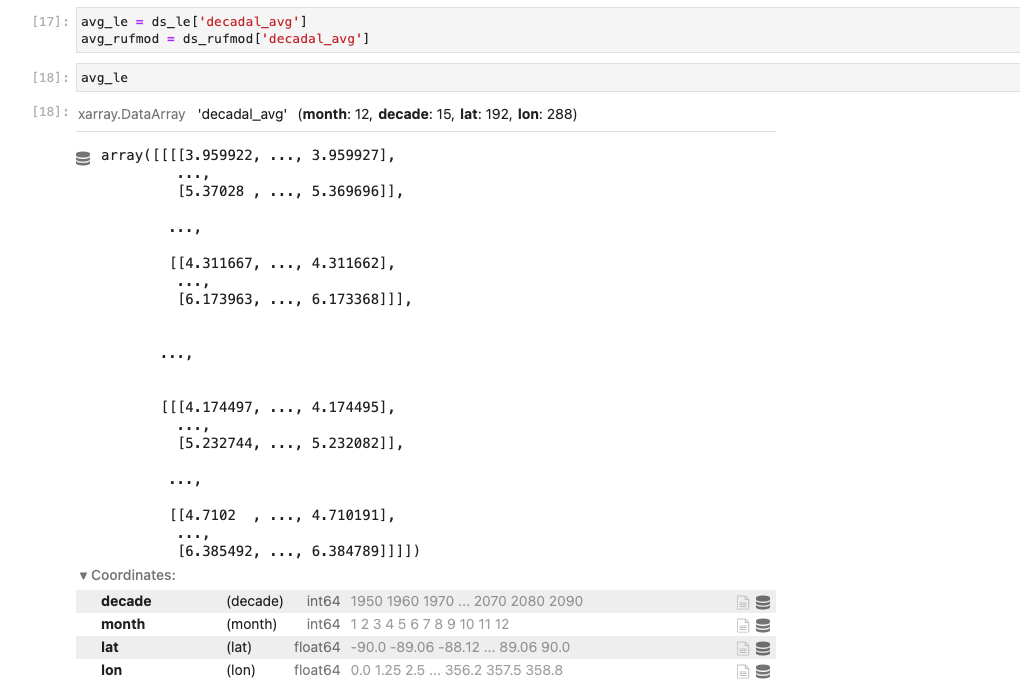
Alice DuVivier (Oct 11 2021 at 14:29):@Max Grover I ran into an odd error (?) in my notebook when I tried to take the difference of two arrays and I'm hoping you or someone else can help me sort out what's going on since I'm totally baffled.
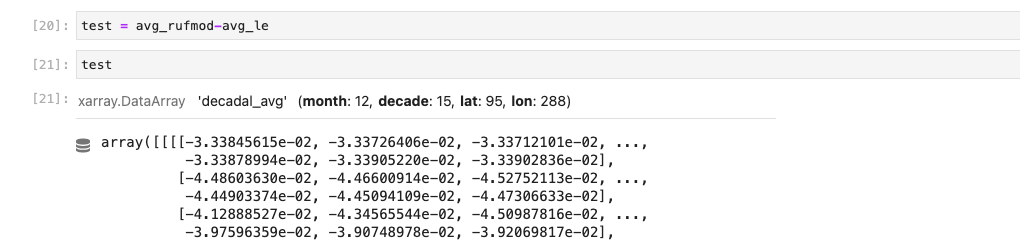
I have two xarray data arrays of the same size with the same coordinates/dimensions. (see first screenshot). However when I take the difference of the two arrays, the resulting array has a reduced size in the latitude dimension (see second screenshot). I have NO idea what's going on since I've verified they both have the same shape and named coordinates.
If it helps, this is CAM data that I've already averaged into decadal means. I did the same operation with sea ice data that I'd processed the same way and the reduction of dimensions did not happen. So I'm pretty perplexed. I'm guessing this is something that python is doing that it probably should be doing, but that I'm not familiar with and so I'm missing a step in here. Advice would be appreciated. :)
Screen-Shot-2021-10-09-at-1.59.27-PM.png
Screen-Shot-2021-10-09-at-1.59.47-PM.png
Max Grover (Oct 11 2021 at 14:39):@Alice DuVivier can you double check that the latitudes are identical between the two datasets? (the actual latitude values)
Matt Long (Oct 11 2021 at 14:43):@Alice DuVivier, I think Max is on the right track. It could be that round-off level differences in the coordinates hose up the xarray alignment. You could use xr.set_options(arithmetic_join="exact") before the operation. This should cause a failure if there is a mismatch in the coords.
Then you could do something like
with xr.set_options(arithmetic_join="override"):
    # do operation
See also:
http://xarray.pydata.org/en/stable/generated/xarray.set_options.html#xarray.set_options
http://xarray.pydata.org/en/stable/generated/xarray.align.html
Alice DuVivier (Oct 11 2021 at 15:06):@Max Grover @Matt Long I looked at the values of 'lat' for each array and they appear to be the same, but it only shows 6 decimal points. If I difference the two lat arrays only, then I get an array of all zeros that is reduced in size to 95 (like was happening with the full array).
I tried Matt's suggestion of:
with xr.set_options(arithmetic_join="exact"):
    test = avg_rufmod - avg_le
And got:
ValueError: indexes along dimension 'lat' are not equal
So I also tried the override option:
with xr.set_options(arithmetic_join="override"):
    test = avg_rufmod - avg_le
And got:
ValueError: option 'arithmetic_join' given an invalid value: 'override'. Expected one of frozenset({'inner', 'outer', 'exact', 'right', 'left'})
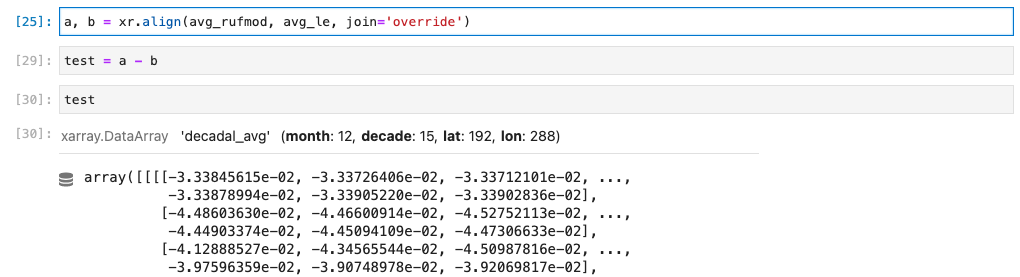
What I tried that I think did what I want is:
a, b = xr.align(avg_rufmod, avg_le, join='override')
test = a - b
And then when "test" has the coordinates I wanted. So I believe this has worked. Thanks!
Screen-Shot-2021-10-11-at-9.05.50-AM.png
Matt Long (Oct 11 2021 at 15:09):xarray documentation is incomplete on the accepted values for the arithmetic_join in set_options. I was guessing that might work since the documentation for align has that option. Your approach is a good one.
Max Grover (Nov 16 2021 at 00:05):Interested in learning more about Matplotlib? Check out the new textbook that came out! It is available online for free!
Here is the link
matplotlib book
Matt Long (Mar 17 2022 at 15:53):How Python is building a welcoming community for women
https://github.com/readme/featured/women-in-tech-python
Matt Long (Apr 18 2022 at 20:57):Here is a recording of the CISL seminar talk I gave a few weeks ago:
https://youtu.be/BV77jjLiCWA
and here are the slides:
https://docs.google.com/presentation/d/1gqeOkpJ2oacDRYSVwWnyJdut0XVpVuoz/edit?usp=sharing&ouid=117138039621880619457&rtpof=true&sd=true
Heather Craker (Nov 16 2022 at 19:22):Hi all! ESDS now has a resource guide explaining all of the ways you can get involved with ESDS. Please take a look at it and share it with colleagues that are interested! https://docs.google.com/document/d/1gr0OXPyakc-Pt00a8M-50QdZaPw8mDx_d2BiU0ifhy4/edit#heading=h.c9z3cev3zz6o
Alice DuVivier (Nov 21 2022 at 19:26):Are there still ESDS help hours going on? I'm having an issue with dask and reading CESM2-LE data and could use some help sorting it out. Thanks!
Michael Levy (Nov 21 2022 at 19:41):@Alice DuVivier there are still office hours, but we've moved away from the single zoom call free-for-all to an appointment system: https://ncar.github.io/esds/office-hours/
Michael Levy (Nov 21 2022 at 19:42):I'm not sure who is available or when this week, but I'm around for the next 2 1/2 hours if you want to send me a private message and set up a call
Daniel Howard (Dec 21 2022 at 19:36):Documentation for Using Conda and Python on NCAR HPC clusters has been updated. Notable revisions are detailed below:
"Updated 12/21/2022: This documentation has been revised to include the new update schedule for the NCAR Python Library as well as information for determining when to use managed environments vs. when to create your own environments."
The update schedule for NPL is twice a year. If you have specific packages you'd like to recommend to be either updated in NPL or added to NPL, please reach out to the HelpDesk.
Heather Craker (Dec 21 2022 at 20:26):Awesome! Thank you for so quickly responding to the user and presenter feedback from the November ESDS event!
Negin Sobhani (Dec 22 2022 at 23:54):Hello Everyone,
CISL Consulting Services in collaboration with ESDS is going to host a Dask half-day tutorial in the Spring of 2023. This tutorial will be focused on effective HPC and Dask usage for the Earth Science community. The tutorial will be tailored both for those who are familiar with Python but are not using Dask extensively and for those who use Dask regularly but would like to learn more about optimization guidance and tips/tricks. We would like to solicit feedback on topics of interest for this tutorial from the community. Are there any particular Dask-related topics that our community would like to be covered in this tutorial?
Happy Holidays!
Negin Sobhani on behalf of Dask mini-tutorial organization team
Katie Dagon (Jan 03 2023 at 19:44):Thanks @Negin Sobhani - here are a few potential topics of interest:
dask-jobqueue usage and best practicesdask dashboardxarray and dask, including chunking best practices.compute or .persist) Chia-Wei Hsu (Jan 12 2023 at 17:28):Hi Everyone, I join the ZULIP through the ESDS GitHub.io page. The AMS presentation about Pythia is the main reason that leads me to this community! Thank you for the great talks. My name is Chia-Wei Hsu. I am an associate scientist at NOAA PSL and would love to attend the future forum and possibly contribute to the Pythia cookbook if our idea of a cookbook match the Pythia's goal/idea about a cookbook. I was planning to attend the Pangeo meeting this Friday after AMS to get involve and discuss with the Pythia team about cookbook idea, but my daughter is sick due to the virus circling in daycare. One quick question is about the in-person forum meeting at NCAR Mesa lab on 1/18 2pm. If I want to attend, will I be able to go in to the chapman room without NCAR b? Thank you!
Chia-Wei Hsu (Jan 12 2023 at 17:30):@Negin Sobhani I am interested about the dask half-day tutorial. Will this tutorial be opened to the public? It looks super helpful!
Katie Dagon (Jan 13 2023 at 18:31):Welcome @Chia-Wei Hsu! It should be fine for you to join the meeting next week in person. @Elena Romashkova will be in the office if you need help accessing the Mesa Lab chapman room.
Lev Romashkov (Jan 13 2023 at 18:33):Katie Dagon said:
Welcome Chia-Wei Hsu! It should be fine for you to join the meeting next week in person. Elena Romashkova will be in the office if you need help accessing the Mesa Lab chapman room.
^ Yep, I'll be coordinating the forum in person, feel free to message me day of if you need help finding the room
Chia-Wei Hsu (Jan 13 2023 at 20:58):@Elena Romashkova @Katie Dagon Thank you!
Chia-Wei Hsu (Jan 25 2023 at 17:30):Hi All, I have a general question to ask related to cookbook on pythia. I find the idea of demonstrating how to access data or reproducing the published figures really great. The cookbook also helps introduce the python ecosystem to people who might not be familiar with it. Therefore, I am recently thinking of creating "cookbook" for the various datasets hosted on NOAA PSL server. I totally understand this might not be matching with the goal of the pythia cookbook. However, I think it will be helpful for people who want to access the data on PSL server. For the time being, I am only creating a jupyterbook with binder launch as a cookbook demo. It will be great if eventually the PSL data cookbook can be incorporate into the pythia cookbook gallery. Since the cookbook idea is totally coming from pythia, I want to ask if it is okay to use the word "cookbook" if we are going to publish the jupyterbook on PSL data instruction website. I am not sure this question is posting at the right place. Please feel free to point me to the high point of contact if I am asking the wrong group of people. Thank you!
Julia Kent (Jan 25 2023 at 17:32):Hi Chia-Wei. This is a great idea and we would love to host a cookbook like this in the Project Pythia gallery. I can definitely be a point person to help you with this.
Julia Kent (Jan 25 2023 at 17:33):We want to be a community project and depend on your contributions and guidance for what content would be most useful.
Chia-Wei Hsu (Jan 25 2023 at 17:52):Thanks @Julia Kent . Once I have a more complete version of the various notebook. I will try to submit a new cookbook on the pythia gallery.
Julia Kent (Jan 25 2023 at 17:56):Awesome thank you!
Last updated: May 16 2025 at 17:14 UTC