Matt Long (May 25 2022 at 15:35): Matt Long (May 25 2022 at 15:35):
@all
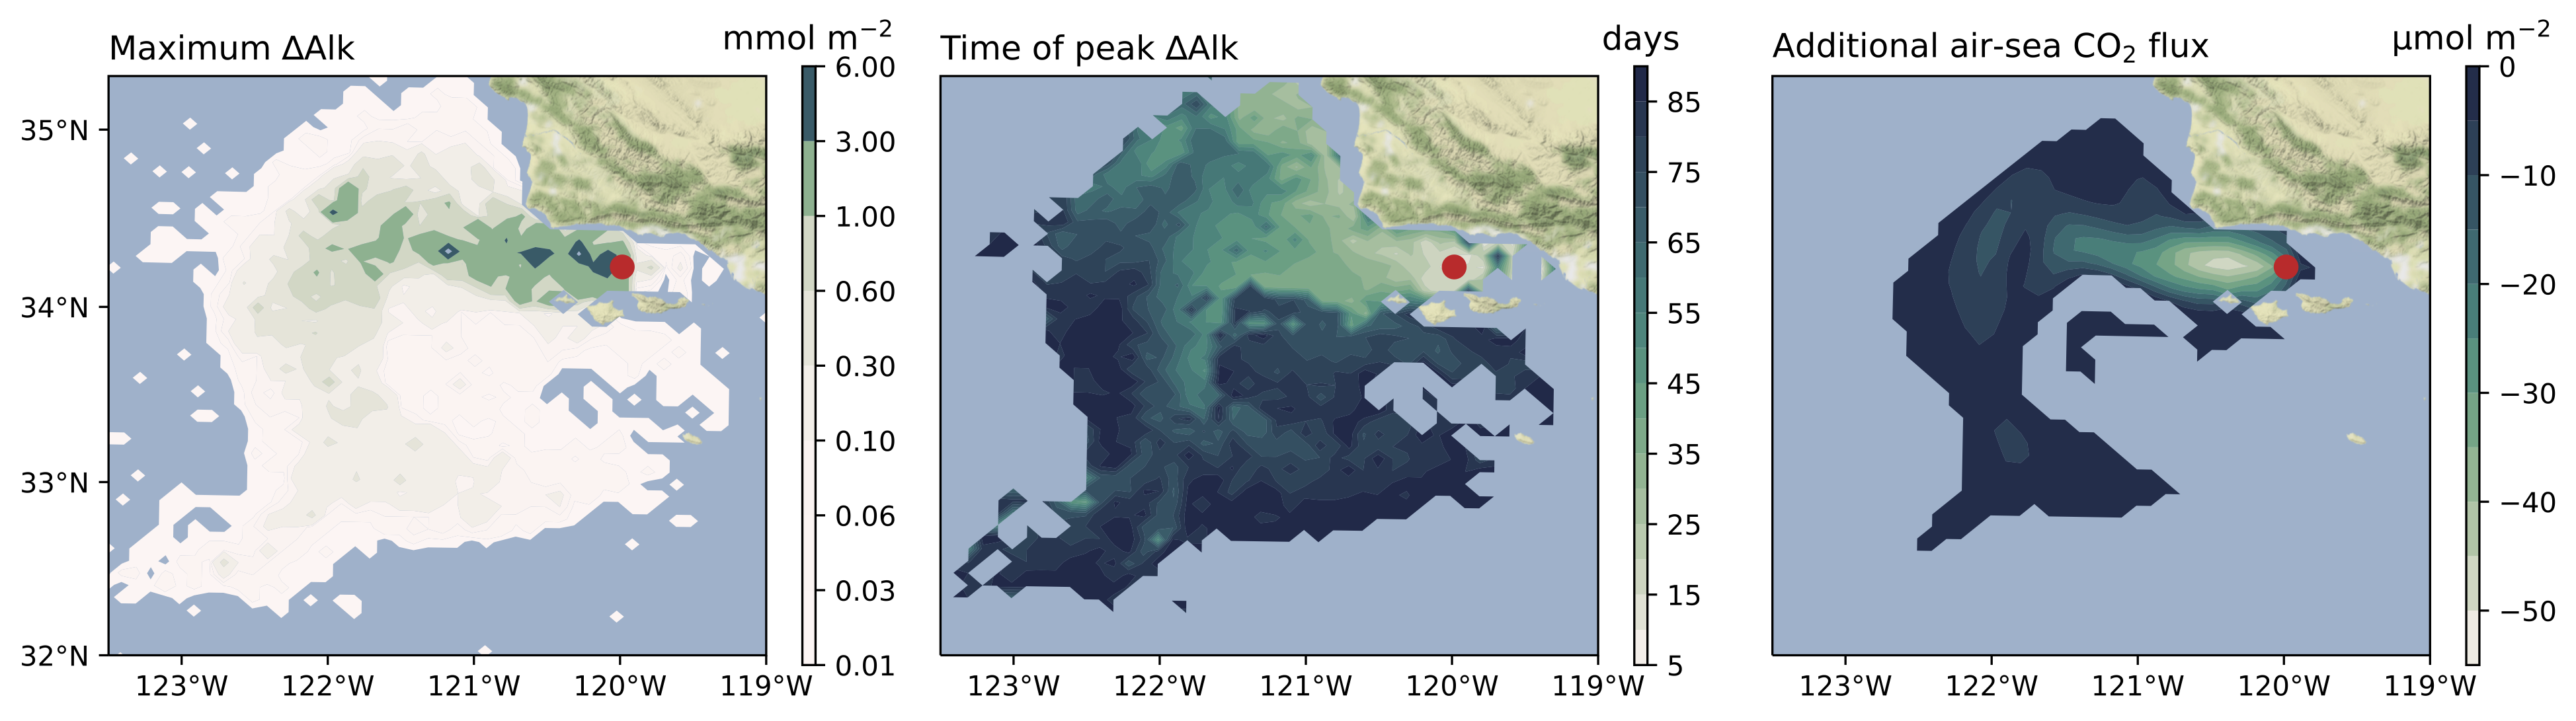
I did a global 0.1° integration and released alkalinity via surface flux in the Santa Barbara channel.
Here's a summary figure and movie from this experiment.
I was thinking the figure could go in the AV proposal. Thoughts? Comments?
SBachman (May 25 2022 at 15:51):That is a very handsome figure! I think it could go in the proposal, yeah
Dan Amrhein (May 25 2022 at 16:07):Very cool, definitely seems like a nice part of the proposal! Is there a different contouring algorithm used for the air-sea fluxes or is there something else giving a smoother field? Is there a simple (linear, log) relationship between the first and last panels? You could also make line plots as a function of time and radius to summarize the role of ocean transport and importance of downstream properties
Matt Long (May 25 2022 at 16:08): Matt Long (May 25 2022 at 16:09):good questions. The smoothness is a result of taking the integral in time, I think, as well as perhaps additional contour levels.
Matt Long (May 25 2022 at 16:11):I just posted the air-sea flux movie. You can see by comparing the alk and fgco2 movies that the two fields have different distributions. I presume this results from winds, possibly eddy-mediated variation in C chemistry and perhaps variation in the ratio of alk at the surface to the vertical integral (which is what's plotted). I don't have a surface alkalinity diagnostic output daily, unfortunately.
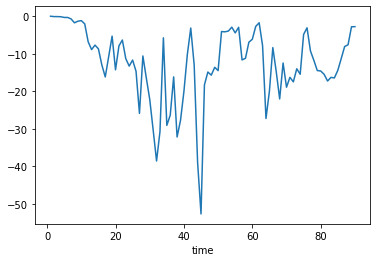
Matt Long (May 25 2022 at 16:13):Here is the flux effect (y axis lacks a label) as a function of time:
image.png
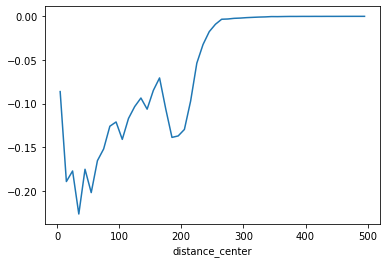
Matt Long (May 25 2022 at 16:13):and distance
image.png
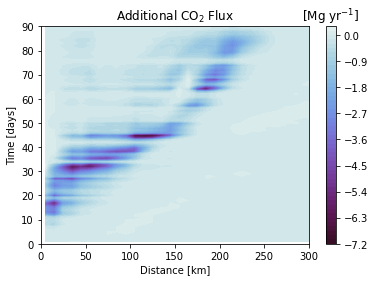
Matt Long (May 25 2022 at 16:14):and the joint PDF:
image.png
Matt Long (May 25 2022 at 16:14):we're probably limited on space and I felt like the geographic reference frame will be more intuitive for most people
Dan Amrhein (May 25 2022 at 16:24):That CO2 movie is pretty cool too; it shows even stronger filamentation of drawdown than just the alkalinity, especially during the time of peak flux
Matt Long (May 25 2022 at 16:25):exactly... I think the control has to be ocean side, not winds; the filaments are mesoscale
Dan Amrhein (May 25 2022 at 16:29):I'd be curious to see how different these are starting one grid box over or one day later!
Matt Long (May 25 2022 at 16:30):me too... but unfortunately this model cost 0.5M core-hours per year!
Matt Long (May 25 2022 at 16:30):bootlegging these kind of simulations is tricky
Last updated: May 16 2025 at 17:14 UTC