David Bailey (Jan 31 2024 at 17:42): David Bailey (Jan 31 2024 at 17:42):
I have the following code. It appears to create a numpy array of the values I want from the dataframe. However, when I do the plot, it remembers the time axis from the dataframe. So, it plots the values versus real years (1979 -) I want to reset years to 0 to 40 say. I have tried reset_index() and this appeared to do what I wanted, but I still got a plot versus the real years. I also tried to_numpy(). Same thing. Does anyone have experience with dataframes here?
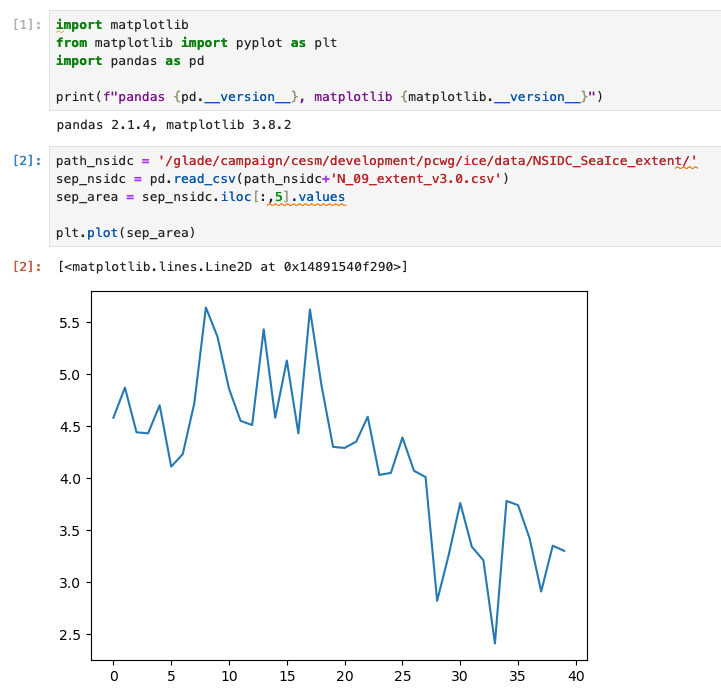
### Read in the NSIDC data from files

path_nsidc = '/glade/campaign/cesm/development/pcwg/ice/data/NSIDC_SeaIce_extent/'

sep_nsidc = pd.read_csv(path_nsidc+'N_09_extent_v3.0.csv')

sep_area = sep_nsidc.iloc[:,5].values

sep_area

plt.plot(sep_area)
Is possible you're working in a notebook where there's some holdover from a prior plot? The .values should just give the values in a numpy array. That's odd behavior.
David Bailey (Jan 31 2024 at 18:06):I even tried doing:
x =np. linspace(1,np.size(sep_area),np.size(sep_area))
plt.plot(x,sep_area)
and same result.
Katelyn FitzGerald (Jan 31 2024 at 18:44):Does something like this help at all?
plt.clf() # clear figure
x = np.linspace(1,np.size(sep_area),np.size(sep_area))
plt.plot(x,sep_area)
This did not help unfortunately.
Michael Levy (Jan 31 2024 at 20:02):What else is going on in your notebook? And what environment / package versions are you running? I copied and pasted your code into a new notebook using NPL 2024a and it doesn't put the years on the axes:
David Bailey (Jan 31 2024 at 20:45):Well crap. I was trying to overplot in on the same axis as two xarray averaged quantities. I'm guessing the problem is a month axis thing.
David Bailey (Jan 31 2024 at 20:50):Sorry about the confusion.
Katelyn FitzGerald (Jan 31 2024 at 20:51):No worries. Glad you got it tracked down!
Last updated: May 16 2025 at 17:14 UTC