import matplotlib.pyplot as plt
import numpy as np
import xarray as xr
import intake
import intake_esm
import pandas as pd
import cartopy.crs as ccrs
import cartopy.feature as cfeature
import os
/glade/u/home/harshah/.conda/envs/osdf/lib/python3.11/site-packages/pyproj/network.py:59: UserWarning: pyproj unable to set PROJ database path.
_set_context_ca_bundle_path(ca_bundle_path)
Required Packages
Please make sure to installed the packages before moving forward
matplotlib
xarray
dask
cartopy
zarr < 3
# Set up your scratch folder path - Ignore these lines if you are not on NCAR's cluster
username       = os.environ["USER"]
glade_scratch  = "/glade/derecho/scratch/" + username
print(glade_scratch)

# Load ERA5 catalog URL
era5_catalog_url ='https://osdf-director.osg-htc.org/ncar/gdex/d633000/catalogs/d633000-osdf.json'
/glade/derecho/scratch/harshah
Please set these two flags to False if you are not on NCAR’s HPC cluster or not using a dask gateway.
Setting these flags to False immediately selects a local cluster which can run on your personal device
USE_PBS_SCHEDULER = True # Use NCAR's HPC cluster
USE_DASK_GATEWAY  = False
# Create a PBS cluster object
def get_pbs_cluster():
""" Create cluster through dask_jobqueue.
"""
from dask_jobqueue import PBSCluster
cluster = PBSCluster(
job_name = 'dask-osdf-24',
cores = 1,
memory = '4GiB',
processes = 1,
local_directory = glade_scratch + '/dask/spill',
log_directory = glade_scratch + '/dask/logs/',
resource_spec = 'select=1:ncpus=1:mem=4GB',
queue = 'casper',
walltime = '3:00:00',
#interface = 'ib0'
interface = 'ext'
)
return cluster
def get_gateway_cluster():
""" Create cluster through dask_gateway
"""
from dask_gateway import Gateway
gateway = Gateway()
cluster = gateway.new_cluster()
cluster.adapt(minimum=2, maximum=4)
return cluster
def get_local_cluster():
""" Create cluster using the Jupyter server's resources
"""
from distributed import LocalCluster, performance_report
cluster = LocalCluster()
cluster.scale(5)
return cluster# Obtain dask cluster in one of three ways
if USE_PBS_SCHEDULER:
cluster = get_pbs_cluster()
elif USE_DASK_GATEWAY:
cluster = get_gateway_cluster()
else:
cluster = get_local_cluster()
# Connect to cluster
from distributed import Client
client = Client(cluster)/glade/u/home/harshah/.conda/envs/osdf/lib/python3.11/site-packages/distributed/node.py:188: UserWarning: Port 8787 is already in use.
Perhaps you already have a cluster running?
Hosting the HTTP server on port 33059 instead
warnings.warn(
# Scale the cluster and display cluster dashboard URL
n_workers =5
cluster.scale(n_workers)
client.wait_for_workers(n_workers = n_workers)
cluster
Loading...
%%time
era5_cat = intake.open_esm_datastore(era5_catalog_url)
era5_cat
CPU times: user 98.6 ms, sys: 8.02 ms, total: 107 ms
Wall time: 776 ms
Loading...
era5_cat.dfLoading...
era5_cat.df[['variable','long_name']].drop_duplicates()Loading...
cat_subset = era5_cat.search(variable='MTPR')
cat_subset.df
Loading...
# Define the xarray_open_kwargs with a compatible engine
xarray_open_kwargs = {
    'engine': 'h5netcdf',
    'chunks': {},  # Specify any chunking if needed
    'backend_kwargs': {}  # Any additional backend arguments if required
}
%%time
# dset_temp = temp_cat.to_dataset_dict(xarray_open_kwargs=xarray_open_kwargs)
dset_subset = cat_subset.to_dataset_dict(xarray_open_kwargs={'engine':'zarr','backend_kwargs':{'consolidated': True,'zarr_format': 2}})
--> The keys in the returned dictionary of datasets are constructed as follows:
	'variable.short_name'
Loading...
Loading...
CPU times: user 523 ms, sys: 70.5 ms, total: 593 ms
Wall time: 8.42 s
mtpr = dset_subset['MTPR.mtpr']
mtpr
Loading...
da = mtpr.MTPR.isel(forecast_hour=10).isel(forecast_initial_time=10)

# 2) Make a Cartopy map axis
proj = ccrs.PlateCarree()
fig, ax = plt.subplots(figsize=(12, 6), subplot_kw={"projection": proj})

# 3) Plot onto that axis
im = da.plot(
    ax=ax,
    transform=ccrs.PlateCarree(),
    cmap = 'Blues',
    x="longitude",
    y="latitude",
    #robust=True,
    cbar_kwargs={"label": getattr(da, "units", "")},
)

ax.coastlines(color="black", linewidth=1.0)
<cartopy.mpl.feature_artist.FeatureArtist at 0x149a08ae9590>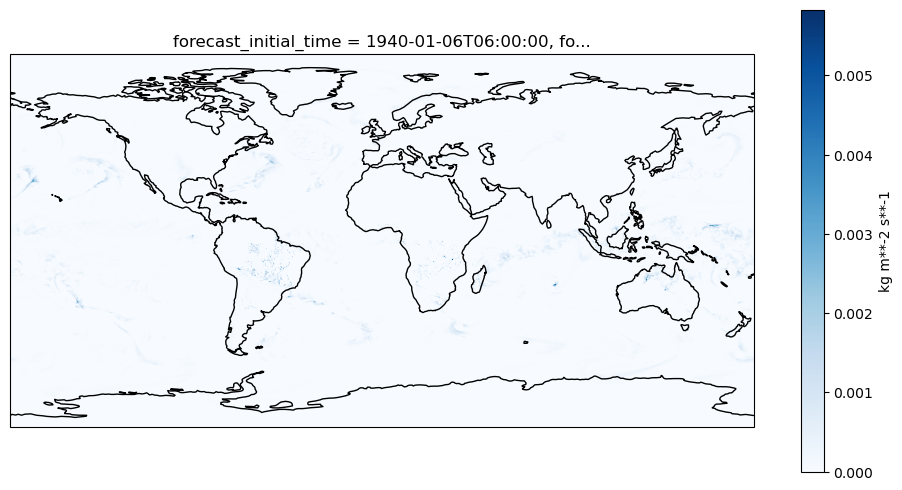
cluster.close()