Ctrl+K
Welcome to the pyDARTdiags documentation! 🚀

pyDARTdiags

  • User Guide
  • Developer Guide
  • Examples
  • API Guide
  • Release Notes
  • GitHub
  • User Guide
  • Developer Guide
  • Examples
  • API Guide
  • Release Notes
  • GitHub

Section Navigation

  • Manipulating Observation Sequences
    • Finding Duplicates in a Observation Sequence
    • Adding External Forward Operators to an Observation
    • Join Observation Sequences
    • Remove Observations
  • Visualizing Observation Sequences
    • Geographic Plot of Observations to look at QC
  • Diagnostics
    • Plot Evolution
    • Grand Statistics
    • Plot Profiles
    • Possible vs. Used Observations
    • Rank Histogram
  • Examples
  • Diagnostics

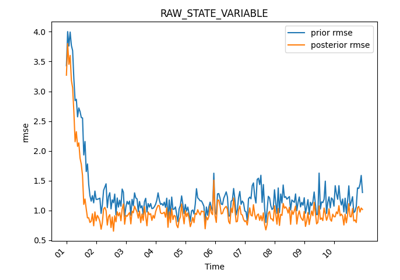
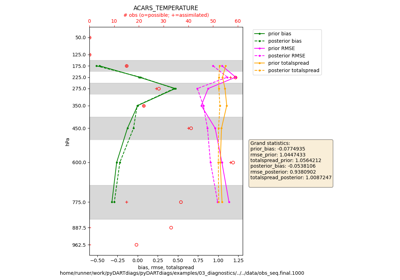
Diagnostics#

Examples of the diagnostic tools available in the library.

Plot Evolution

Plot Evolution

Grand Statistics

Grand Statistics

Plot Profiles

Plot Profiles

Possible vs. Used Observations

Possible vs. Used Observations

Rank Histogram

Rank Histogram

previous

Geographic Plot of Observations to look at QC

next

Plot Evolution

© Copyright 2025, University Corporation for Atmospheric Research.

Created using Sphinx 8.2.3.

Built with the PyData Sphinx Theme 0.16.1.