Note
Go to the end to download the full example code.
Plot Profiles#
This example demonstrates how to plot profiles of RMSE, bias, and totalspread. For an explanation of the statistics calculations see the Statistics guide.
Import the obs_sequence module and the matplots module for plotting.
import pydartdiags.obs_sequence.obs_sequence as obsq
from pydartdiags.matplots import matplots as mp
from pydartdiags.data import get_example_data
Chose an obs_seq file to read. In this example, we are using a small obs_seq file “obs_seq.final.1000”.
data_file = get_example_data("obs_seq.final.1000")
package_dir: /home/runner/work/pyDARTdiags/pyDARTdiags
Using development data file: /home/runner/work/pyDARTdiags/pyDARTdiags/data/obs_seq.final.1000
Read the obs_seq file into an obs_seq object.
obs_seq = obsq.ObsSequence(data_file)
Chose an observation type. The observation types are stored in the ‘type’ column. To see which observation types are in the dataframe, use the unique method:
obs_seq.df['type'].unique()
array(['ACARS_TEMPERATURE', 'ACARS_U_WIND_COMPONENT',
       'ACARS_V_WIND_COMPONENT', 'AIRCRAFT_TEMPERATURE',
       'AIRCRAFT_U_WIND_COMPONENT', 'AIRCRAFT_V_WIND_COMPONENT'],
      dtype=object)
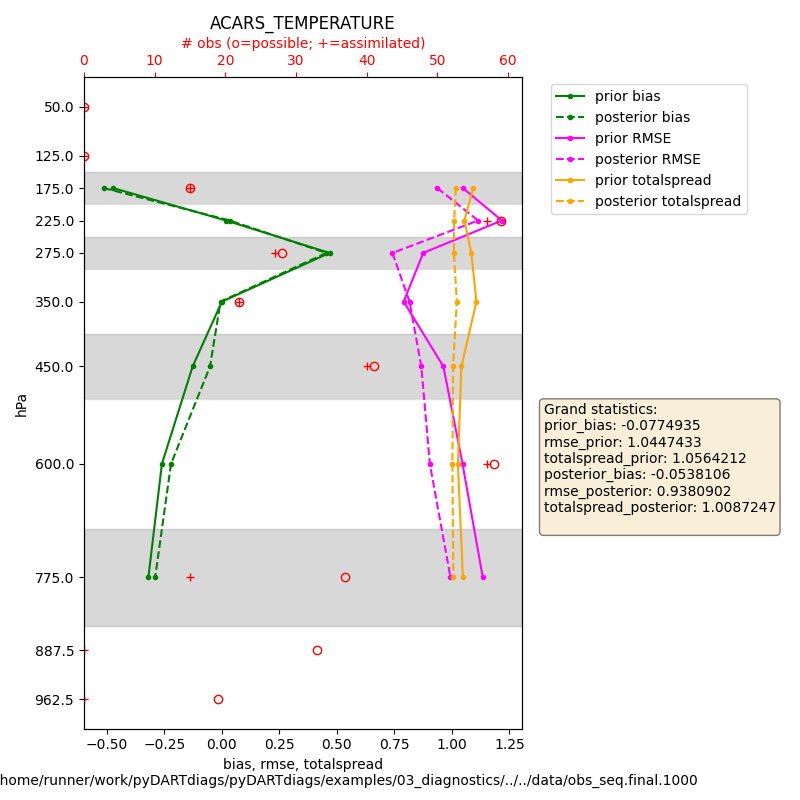
For this example, we are going to look at the profile for ACARS_TEMPERATURE observations.
type = 'ACARS_TEMPERATURE'
hPalevels = [0.0, 100.0,  150.0, 200.0, 250.0, 300.0, 400.0, 500.0, 700, 850, 925, 1000]  # hPa
levels = [i * 100 for i in hPalevels]

fig = mp.plot_profile(obs_seq, levels, type, bias=True, rmse=True, totalspread=True)
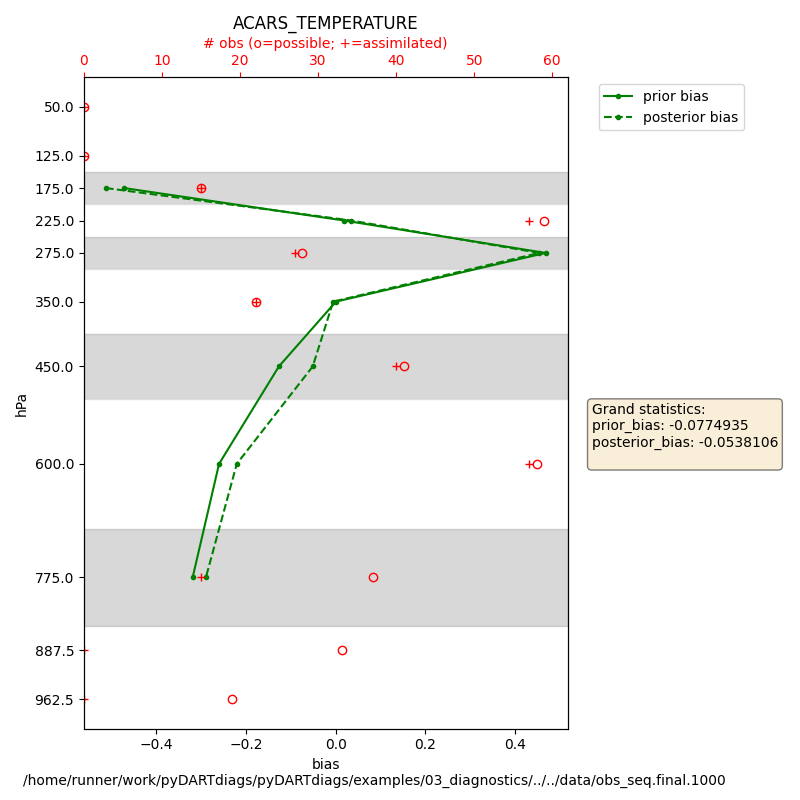
To plot only the bias, set rmse=False and totalspread=False.
fig = mp.plot_profile(obs_seq, levels, type, bias=True, rmse=False, totalspread=False)
Total running time of the script: (0 minutes 0.593 seconds)