Isla Simpson (Feb 28 2021 at 14:16): Isla Simpson (Feb 28 2021 at 14:16):
Hello,
I'm trying to get this code running /glade/u/home/islas/python/sortera5/grabera5zmfluxes.ipynb and I'm wondering if an expert could help me understand what is the best way to optimize it. I am calculating zonal mean fluxes for ERA5 and I'm currently trying to do it on a monthly basis. This means that for each month, I am reading in 4 variables that are 114Gb in size and doing some calculations with them to produce the output which is ~12M in size. My trouble is that, first of all, I was following the advice from Deepak in my posting above and trying to have the chunk size about 100Mb. It was impossibly slow - more than an hour to process a month - I'm not sure exactly how long because I stopped it. So I tried to optimize my chunk size and I made them bigger. I found that made it a lot faster. I got it to run with a chunk size of 1.3G and it will process a month in 7 minutes. However, it'll run happily and process somewhere between a year or two and then hang. It looks like it's still running and there's no error message, but it has clearly stopped doing anything as no more files are being produced. I'm guessing I may be overdoing it now with the chunk size. So, how would an expert optimize this? Should I throw more workers at it? more memory? reduce the chunk size? or am I doing something inefficient with the way that I am organizing the chunks?
Glad to hear any advice on this and hopefully eventually I'll get it and be able to apply it to other things too. Thanks in advance for any help.
Daniel Kennedy (Feb 28 2021 at 15:16):Hoping there's a simple answer to this... I think I'm experiencing similar behavior, where I can run some intensive calculations once with good performance (30secs), but then if I rerun the same cell, it never computes. Can provide an example script if needed.
Anderson Banihirwe (Mar 01 2021 at 20:30):@Isla Simpson, I am going to take a look at the notebook later today and will get back to you
Isla Simpson (Mar 01 2021 at 20:36):@Anderson Banihirwe . Great, thanks a lot. Since I originally posted I made the chunk size a bit smaller and that seems to make the problem worse. It starts hanging after only 3 months of processing. So the probability of hangs doesn't seem to be directly related to the chunk size.
Deepak Cherian (Mar 01 2021 at 20:37):Can you take a screenshot of the dask dashboard when the computation hangs?
Deepak Cherian (Mar 01 2021 at 21:05):Anderson, do you want to look at it together for "team time"?
Anderson Banihirwe (Mar 01 2021 at 21:57):Anderson, do you want to look at it together for "team time"?
Unfortunately, I have another meeting :frown:
Anderson Banihirwe (Mar 01 2021 at 22:00):Great, thanks a lot. Since I originally posted I made the chunk size a bit smaller and that seems to make the problem worse.
I've run into the "hanging issue" especially when using to_netcdf() on results from a huge computation task graph
Anderson Banihirwe (Mar 01 2021 at 22:01):Fortunately, there are some remedies
Isla Simpson (Mar 01 2021 at 22:42):Good to hear there are some remedies. I was struggling to get anything to work with the dask dashboard. When I clicked on the dask symbol and then tried to click on any of the things, it just gave me a warning and didn't show me anything. But maybe I'm not looking at the right thing. I'll try again, but currently waiting for workers.
Deepak Cherian (Mar 01 2021 at 23:08):I think there are two issues here:
But for this case the final temdiags dataset is tiny )1.5GB)? so just call .load().to_netcdf(...)
See /glade/u/home/dcherian/islas-era5zm.ipynb
Deepak Cherian (Mar 01 2021 at 23:08):I rewrote the cell to understand what it was doing., so the code may not be fully right :slight_smile:.
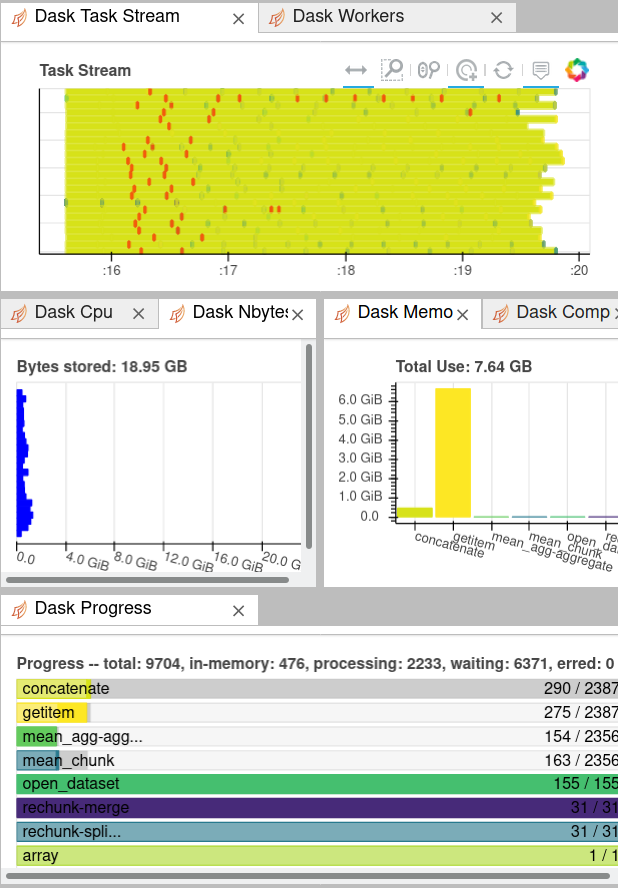
RIght now it's bottlenecked on the regridding and computation of zonal mean.
pasted image
but it looks fine.. memory use is low, seems limited by disk
Deepak Cherian (Mar 01 2021 at 23:57):I'm also seeing this bad load balancing behaviour. Near the end of the computation, one worker is overloaded and dask doesn't redistribute the tasks to idle workers. Barring some change in distributed, I think the way to deal with this is to process multiple months to once so you hit this bottleneck less frequently
Deepak Cherian (Mar 02 2021 at 00:33):Let me know if /glade/u/home/dcherian/islas-era5zm.ipynb helps.
Isla Simpson (Mar 02 2021 at 01:52):@Deepak Cherian Thanks so much for looking into this. This is really helpful and it's great to see how you would do this in a much more elegant way! I have set this going and will let you know if it makes it further than what I was getting to before. Thanks!
Kevin Paul (Mar 02 2021 at 15:57):@Isla Simpson & @Deepak Cherian: Is it dask or is it xarray that is the problem? I did a benchmarking study with a colleague from Ifremer, and one of the calculations we benchmarked was the anomaly calculation. The problem we found was that Xarray's groupby operation rechunks the data along the dimension that is "grouped." So, if you are chunking along a different dimension(s) than the one(s) that is (are) already chunked, Xarray produces many more chunks and the calculation gets bogged down. Is that what is happening here? (Sorry, I didn't have time to look at your notebook, @Isla Simpson!)
Deepak Cherian (Mar 02 2021 at 16:05):The problem we found was that Xarray's groupby operation rechunks the data along the dimension that is "grouped."
this has to happen. A group is obj.isel({group_dim: group_indices}) where group_indices is a list of ints so if the indices are not contiguous (ge.g. roupby(time.season) for 10 years of data), output chunks are different from input chunks.
So, if you are chunking along a different dimension(s) than the one(s) that is (are) already chunked, Xarray produces many more chunks and the calculation gets bogged down
Do you mean grouping along a different dimension? Indexing dask arrays by list of ints can end up in interesting places. Tom fixed a bad edge case: https://github.com/dask/dask/pull/6514 , but the output is controlled by dask.config.get("array.chunk-size") which seems to ignore existing chunk structure. it wouldn't surprise me that dask's heuristics can break down for this kind of thing. Can you write down an example?
Deepak Cherian (Mar 02 2021 at 16:06):Is that what is happening here?
I actually didn't figure out what was happening :slight_smile:. I noticed that the intermediate is small (96GB) relative to memory on the cluster (600GB) so persisting the regridded dataset used for subsequent the anomaly calculation was a good idea
Ufuk Turuncoglu (Mar 02 2021 at 18:09):Hi @Isla Simpson I have little bit experience to process ERA5 data. It was also slow in my case too due to the resolution of the data and I was trying to process hourly. In your case, it might be slow but I think there is no any dependency between processing each month. If this is the case, then your problem is embarrassingly parallel and you could process more than one month in the same time. That will significantly reduce the time to process entire dataset.
Isla Simpson (Mar 02 2021 at 18:14):@Deepak Cherian , @Kevin Paul Thanks for taking the time to think about this. It is clear from reading all your postings below that I have a long way to go before I come close to understanding what I'm doing. But an update here is that I successfully used Deepak's version of the code overnight and I think it kept on running for the full 12 hour wallclock. I was able to process a month per 8 minutes which is definitely faster than my simple minded parallelization I was doing prior to this. One thing that did not work was to process a full year at once. Workers got killed. But if I reverted back to processing a month at a time but with Deepak's changes, it worked. Thanks a lot for your help on this!
Isla Simpson (Mar 02 2021 at 18:16):@Ufuk Turuncoglu Thanks for your thoughts. Indeed that was the way I was doing it before when I was running a mess of bash and IDL scripts, but I thought this shouldn't be necessary with dask. But it seems like I am able to successfully process it now in a timely manner by following the suggestions from Deepak above.
Deepak Cherian (Mar 02 2021 at 18:20):work was to process a full year at once. Workers got killed.
After how many years did this happen?
Isla Simpson (Mar 02 2021 at 18:22):It happened immediately on the first year. It didn't get to the point where a netcdf file was produced in the output directory so I'm guessing it was while it was doing all the processing for the first year.
Deepak Cherian (Mar 02 2021 at 18:50):reading all your postings below that I have a long way to go before I come close to understanding what I'm doing
Your code was great. The problem is that there are "known inefficiencies", and "known workarounds" but this knowledge isn't easily accessible :confused:
Will Wieder (Mar 02 2021 at 19:15):I'd emailed @Anderson Banihirwe directly, but realized the question was really better on Zulip and related to this thread.
I realize that I don't really understand what's going on under the hood regarding memory, DASK, clusters, etc.
Specifically, This notebook below ran (and plotted) fine on Friday. The code takes daily data to look at the timing of snowmelt and the length of the snow free period in the Northern Hemisphere from the CESM2-LE.
Now I'm unable to generate the plots I'd like, and I'm not really clear why?
Should I just modify some of the high level changes Anderson made to the FireRisk notebook (e.g. using NCARCluster instead of SLURMCluster)?
Are there other memory tricks I should know about? Are there resources I can try to learn from on this? From Deepak's note to Isla, it seems there's more of an art to this than I necessarily have bandwidth to accomplish?
full URL of the notebook is here
https://github.com/wwieder/cesm-lens/blob/main/notebooks/lens2_VernalWindow.ipynb
Deepak Cherian (Mar 02 2021 at 19:18):Now I'm unable to generate the plots I'd like, and I'm not really clear why?
What does the dashboard look like in this case? What errors are you seeing?
Deepak Cherian (Mar 02 2021 at 19:19):I changed the rolling aggregations to use substantially less memory (except var, std) in xarray v0.17.0. You could try upgrading if you're running in to memory issues with rolling operations.
Deepak Cherian (Mar 02 2021 at 19:21):(that wouldn't explain the flakiness since it worked with the older version)
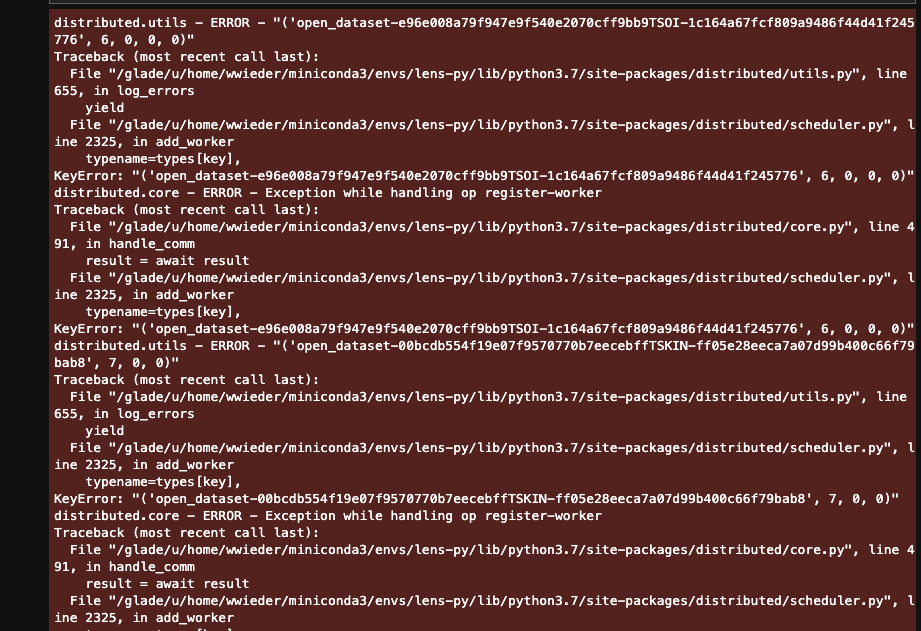
Will Wieder (Mar 02 2021 at 19:23):the error is long, but the last bit states:
KilledWorker: ("('open_dataset-392585d62b286712d16676c89012e8dcTSOI-460deed04f8252002d6150f75d57e19c', 5, 0, 0, 0)", <Worker 'tcp://10.12.205.19:37748', name: 0-17, memory: 0, processing: 117>)
Deepak Cherian (Mar 02 2021 at 19:26):yeah doesn't help unfortunately. How about a snapshot of the dashboard?
Anderson Banihirwe (Mar 02 2021 at 21:06):@Will Wieder,
Does this SO answer help?
https://stackoverflow.com/questions/46691675/what-do-killedworker-exceptions-mean-in-dask
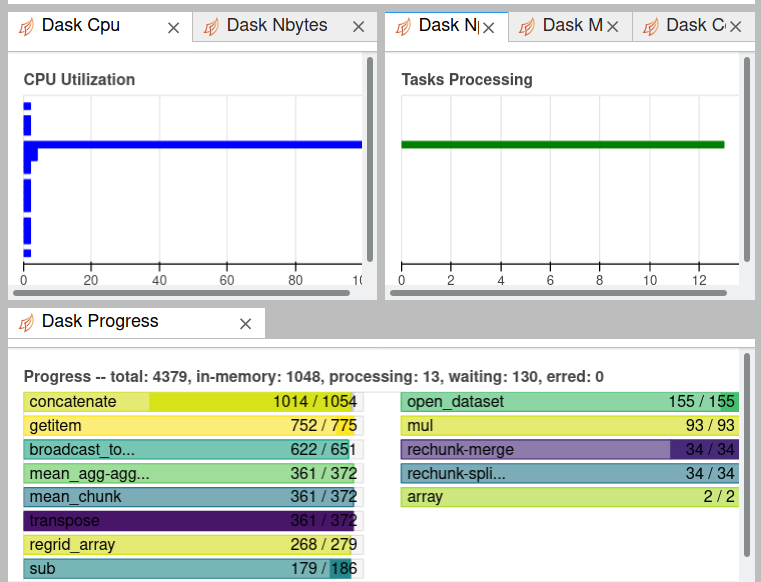
Will Wieder (Mar 02 2021 at 21:13):Do you mean this, Deepak? pasted image
Deepak Cherian (Mar 02 2021 at 21:16):Like this: pasted image
Will Wieder (Mar 02 2021 at 21:19):I have no idea, where do I find that?
Will Wieder (Mar 02 2021 at 21:20):my client has a dasboard, but it never loads with an error saying the site cannot be reached "10.12.205.28 took too long to respond."
Anderson Banihirwe (Mar 02 2021 at 21:26):Sounds like your dashboard link is pointing to a local/private address. You need to launch the dashboard via the notebook proxy by running the following code before creating your cluster/client:
import dask
dask.config.set({'distributed.dashboard.link': '/proxy/{port}/status'})
Will Wieder (Mar 02 2021 at 21:30):do I put anything in {port} or leave this as written? Leaving {port} I get 404 Not Found when I check on the dashboard link in the client.
Anderson Banihirwe (Mar 02 2021 at 21:32):do I put anything in {port} or leave this as written?
Leave it as is. Dask knows how to set it to an actual value.
Anderson Banihirwe (Mar 02 2021 at 21:32):Can you confirm that you have jupyter-server-proxy package in your conda environment?
Will Wieder (Mar 02 2021 at 21:38):looks like it. I check this by activating the lens-py environment you created and using conda list?
Anderson Banihirwe (Mar 02 2021 at 21:39):Yes
Anderson Banihirwe (Mar 02 2021 at 21:39):Also, are you running this from the jupyterhub or via SSH tunneling?
Will Wieder (Mar 02 2021 at 21:40):jupyterhub
Will Wieder (Mar 02 2021 at 21:40):does it work with ssh tunneling?
Anderson Banihirwe (Mar 02 2021 at 21:41):jupyterhub
Aha! my previous answer is misleading :slight_smile: Sorry
Anderson Banihirwe (Mar 02 2021 at 21:41):Try this
Anderson Banihirwe (Mar 02 2021 at 21:42):On cheyenne
Anderson Banihirwe (Mar 02 2021 at 21:42):https://jupyterhub.ucar.edu/ch/user/{USER}/proxy/{port}/status
Anderson Banihirwe (Mar 02 2021 at 21:42):On Casper
Anderson Banihirwe (Mar 02 2021 at 21:42):https://jupyterhub.ucar.edu/dav/user/{USER}/proxy/{port}/status
Will Wieder (Mar 02 2021 at 21:46):OK, now I have a dashboard to look at, but the only menu option that goes anywhere is for info, which give a bunch of info re. workers
Anderson Banihirwe (Mar 02 2021 at 21:48):The other routes return 404 errors or they just don't work?
Will Wieder (Mar 02 2021 at 21:51):The 404 error comes up when I click on this link in my notebook
pasted image
Will Wieder (Mar 02 2021 at 21:54):when I fetch the cluster, I also get this warning below, but no other cluster is running
/glade/u/home/wwieder/miniconda3/envs/lens-py/lib/python3.7/site-packages/distributed/node.py:155: UserWarning: Port 8787 is already in use.
Perhaps you already have a cluster running?
Hosting the HTTP server on port 44810 instead
http_address["port"], self.http_server.port
Anderson Banihirwe (Mar 02 2021 at 21:56):It's likely that someone else is running on the node as you and as a result the default port is taken hence the warning and random port assignment
Will Wieder (Mar 02 2021 at 21:57):I have to run to another meeting, is it helpful to schedule a zoom call where I can share my screen to help diagnose what's going on?
Anderson Banihirwe (Mar 02 2021 at 21:59):Sounds good...Let me know what time works best for you and we will schedule a short call
Will Wieder (Mar 02 2021 at 23:42):thanks @Anderson Banihirwe I sent you a zoom invite for tomorrow afternoon.
Will Wieder (Mar 15 2021 at 00:44):couldn't find a similar thread, so I added this questions here. Specifically my apply_ufunc seems to overload two workers, regardless of how data are being chunked. The notebook below works fine if I only have 20 years of data, but seems to go really slow on a 'transpose' step, which seems to happen on each ensemble member? (currently just reading in 2 for efficiency). Ideally I'd like to run this with a whole historical and SPP time series.
https://github.com/wwieder/cesm-lens/blob/main/notebooks/lens2_FireRisk.ipynb
@Anderson Banihirwe you helped with the first bit of this code (which worked for 10 year slices of data). Do you have suggestions for how to handle a longer time series?
Will Wieder (Mar 15 2021 at 12:36):it was the rechunk-merge part of the workflow that was getting hung up. increasing lat and lon chunks made this better!
Deepak Cherian (Mar 15 2021 at 13:19):at a high level, your data is chunked in time but your function wants only 1 chunk in time. So rechunking (rechunk-merge) will always be expensive (output chunks depend on a large number of input chunks). As you have found out, increasing lat and lon chunks (when you read in data) will make it better.
You could rewrite this to accept dataarrays. Xarray supports all these operations and they are dask-aware so you can avoid the rechunking/apply_ufunc dance.
def running_sum_np(data):
    v = pd.Series(data.copy())
    cumsum = v.cumsum().fillna(method='pad')
    reset = -cumsum[v.isnull()].diff().fillna(cumsum)
    result = v.where(v.notnull(), reset).cumsum()
    return result.values
xclim implements some of your calculations (https://xclim.readthedocs.io/en/stable/indices.html?highlight=fire#fire-weather-indices-submodule) so you could try their code
Deepak Cherian (Mar 15 2021 at 13:26):(the transpose step is also from apply_ufunc... it moves all core dimensions to the end).
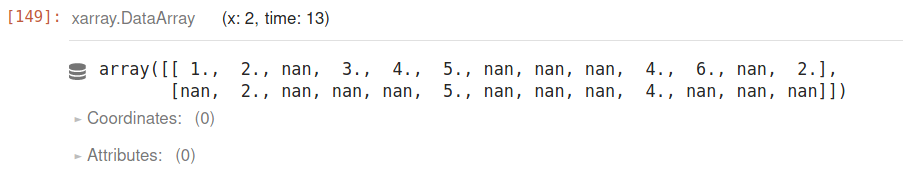
Deepak Cherian (Mar 15 2021 at 14:59):Maybe like this?
import numpy as np
import xarray as xr


arr = xr.DataArray(
    np.array(
        [
            [1, 2, np.nan, 3, 4, 5, np.nan, np.nan, np.nan, 4, 6, np.nan, 2],
            [np.nan, 2, np.nan, np.nan, np.nan, 5, np.nan, np.nan, np.nan, 4, np.nan, np.nan, np.nan]
        ]
    ),
    dims=("x", "time")
)
arr
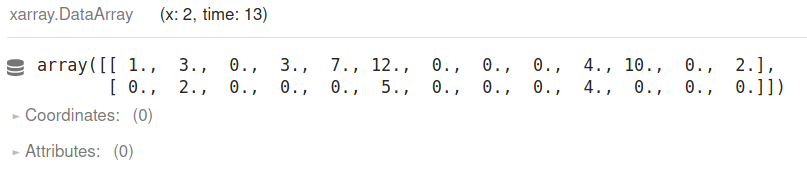
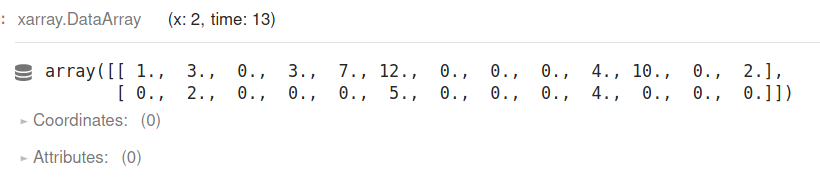
# attempt 1
# though ffill doesn't work across chunks:
# could use solution here: https://github.com/pydata/xarray/issues/2699
cumsum = arr.cumsum("time")
cumsum - cumsum.where(arr.isnull()).ffill("time").fillna(0)
# the last fillna(0) is really just for the beginning of the array
# pad with nans instead. this may be more efficient with dask,
# since we don't touch every element at the end
padded = arr.pad(time=(1, 0))
cumsum = padded.cumsum("time")
(cumsum - cumsum.where(padded.isnull()).ffill("time")).isel(time=slice(1, None))
This solution requires fixing https://github.com/pydata/xarray/issues/2699#issuecomment-456999707 to have ffill work across chunks. (A solution exists, just needs to be added with tests cc @xdev @geocat )
Will Wieder (Mar 16 2021 at 23:19):@Deepak Cherian thanks for the xclim suggestion. This calculation doesn't allow for dimension reduction (4 daily variables go in, 6 daily variables are calculated), with one days calculations dependent on the values from the day before. As a result the calculations are memory intensive. With help from @Anderson Banihirwe I'm able to calculate a decade of results from a single ensemble member and am testing now generating a whole 250 year time series of results, but it's slow going.
Will Wieder (Mar 16 2021 at 23:43):It works! but takes nearly an hour for a single ensemble member.
I'm currently writing out the calculated variables to scratch. Roughly 20GB/ ensemble member / variable. Should I be smarted with how I output these files as I'll end up with 5TB data once this is all written out?
Deepak Cherian (Mar 17 2021 at 00:52):re:speed: the rechunk to one chunk; apply_ufunc with vectorize=True pattern is slow because it involves a lot of network transfer (rechunking) and a for loop over points (vectorize).
re space: use zarr with a compressor or turn on compression with netCDF
Deepak Cherian (Mar 17 2021 at 03:23):Using ds = ds.where(ds['PPT'].max(['time', 'ens']) > 0.0) to mask out the ocean is max bad. Every block of every variable in ds now depends on a global reduction of ds.PPT across all time and ensemble members.
Changed to ds = ds.where(ds.landmask.notnull()) and things are flying...
Will Wieder (Mar 17 2021 at 13:20):Thanks! A few points of clarification, @Deepak Cherian :
apply_ufunc are you suggesting that I set vectorize=FalseDataset.to_zarr to write out files? Deepak Cherian (Mar 17 2021 at 13:24):for apply_ufunc are you suggesting that I set vectorize=False
Yes but you'll have to change your function to work with arrays rather than 1D vectors. vectorize is basically a for loop so it is slow. Avoid it if you can.
re. netCDF are you suggesting I use Dataset.to_zarr to write out files?
Yes this will write to zarr in parallel.
(I sent a PR with some suggested changes: https://github.com/wwieder/cesm-lens/pull/2; but I didn't get to the end of the notebook)
Will Wieder (Mar 17 2021 at 16:25):oh, zarr is money! This writes files much more quickly, thanks for this recommendation and for the suggestions in your PR @Deepak Cherian .
Haiying Xu (Mar 17 2021 at 19:01):@Will Wieder Zarr file should have default lz4 lossless compressor enabled. It can save you at least half the space, if you are interested in more space saving, I can teach you use zfp lossy compressor.
Will Wieder (Mar 17 2021 at 21:09):thanks @Haiying Xu for now I think we'll see if the lossless compression works, and colleagues can subsequently read in the data for her analyses
Jean-Francois Lamarque (Mar 25 2021 at 15:27):Even zarr seems to take a long time to write a tiny file (151x33) array. Any options?
/glade/u/home/lamar/Python/CMIP6_analysis/Deposition/interp_tracers_to_icecores_CESM2.ipynb
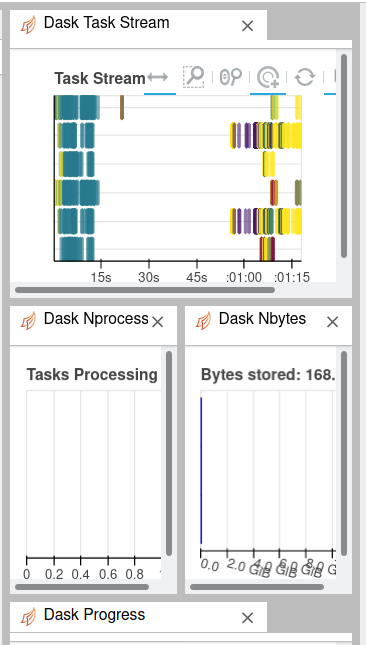
Deepak Cherian (Mar 25 2021 at 15:56):OK few things:
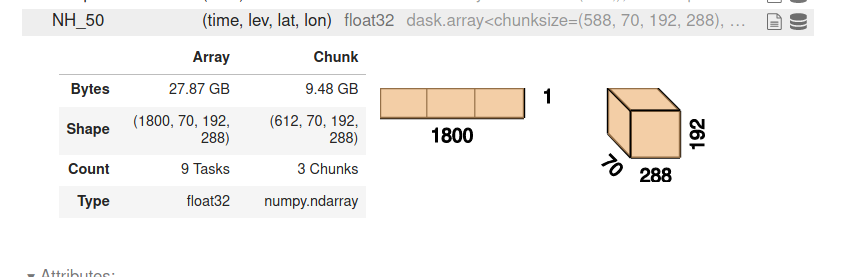
here is NH_50 after the open_mfdataset call:
pasted image
9.5GB is too big. Since you have not specified chunks in the open_mfdataset call, each file becomes one chunk of a variable.
Later you're only using lev=69, so that suggests using chunks={"lev": 1}.
open_mfdataset loads in dask variables but no dask cluster was setup. So it was effectively a single-threaded for loop over chunks (possibly two threads). that's why it is slow. I usedimport ncar_jobqueue cluster = ncar_jobqueue.NCARCluster(project="ncgd0011") import distributed client = distributed.Client(cluster) cluster.scale(4)
wk0 = ds.isel(lev=69).resample(time="1YS").mean() i.e. switch the order of subsetting and resampling. I think it's always better to subsample earlier in your pipelinetracer_cores.load().to_netcdf(output_file_name) this will load to memory and write from a single thread so there's no locking issues with netCDF (IIUC). This computation completes in under a minute for me. Jean-Francois Lamarque (Mar 25 2021 at 16:06):OK. This worked much better. Thanks!
BTW I couldn't get the following to work
import ncar_jobqueue
cluster = ncar_jobqueue.NCARCluster(project="ncgd0011")
import distributed
client = distributed.Client(cluster)
cluster.scale(4)
as I got the error message
"NameError: name 'ncar_jobqueue' is not defined"
Deepak Cherian (Mar 25 2021 at 16:08):Ah then it needs to be installed in your environment. It'll let you request Cheyenne/Casper/Hobart/Izumi resources: https://github.com/NCAR/ncar-jobqueue .
Jean-Francois Lamarque (Mar 25 2021 at 16:13):OK. Is there a way to make this part of the standard setup for users? Thanks!
Deepak Cherian (Mar 25 2021 at 16:21):it should be. pinging @xdev
Max Grover (Mar 25 2021 at 17:01):This issue/issues similar will be added to the https://ncar.github.io/esds/faq/ page! This is a great question and would be great to start with - thanks for asking these questions! Also, XDev will be holding a dask tutorial in the near future.
Isla Simpson (Mar 25 2021 at 17:14):A dask tutorial would be excellent. I have been wondering whether it's worth signing up for https://summit.dask.org/ as a beginner? It says there are tutorials on May 19th but it's not very clear whether they are for advanced users or beginners. Maybe the XDev tutorial will tell us everything we need to know! Thanks.
Jean-Francois Lamarque (Mar 26 2021 at 14:55):Well...got another very slow script. Even with a cluster and splitting the large chunks. It is about 3x the amount of data from the previous script but is taking forever (did not finish within 12 hour time window)
/glade/u/home/lamar/Python/CMIP6_analysis/Deposition/test_tracer.ipynb
BTW the setup to run the cluster is automatically included when opening a CMIP6 environment.
Jean-Francois Lamarque (Mar 26 2021 at 16:32):Actually job gets killed "KilledWorker: ("('where-62ac06e4071e1641b68e4d2585ce8cb3', 230, 21, 0, 0)", <Worker 'tcp://10.12.205.12:33362', name: 2, memory: 0, processing: 3926>)"
Deepak Cherian (Mar 26 2021 at 16:33):@Max Grover and I are looking at it now
Deepak Cherian (Mar 26 2021 at 16:59):There are some variables that are in one file but not others e.g. f107. Do you need all of them or just NH5?
Jean-Francois Lamarque (Mar 26 2021 at 17:00):just NH_5 and date/time
Jean-Francois Lamarque (Mar 26 2021 at 17:00):and lat/lon
Max Grover (Mar 26 2021 at 18:06):@Jean-Francois Lamarque here is a solution that @Deepak Cherian and I worked on, go ahead and replace the read in dataset portion with this
#
# open all files and concatenate along time dimension
#

def preprocess(ds):
    return ds[["NH_5"]]


ds = xr.open_mfdataset(
        files,
        concat_dim="time",
        combine="by_coords",
        chunks={"lev": 1, "time": 500},
        data_vars="minimal",
        coords="minimal",
        compat="override",
        parallel=True,
        preprocess=preprocess,
    )
And try setting the number of workers you have equal to the number of files (7 in this case)
A writeup of this FAQ will be posted on https://ncar.github.io/esds/faq/
Deepak Cherian (Mar 26 2021 at 18:07):actually data_vars=["NH_5"] should also work, instead of the whole preprocess thing?
Jean-Francois Lamarque (Mar 26 2021 at 18:12):Awesome! Let me try right away
Jean-Francois Lamarque (Mar 26 2021 at 18:19):Worked beautifully! But I had to use the "preprocess" step. Thank you Max and Deepak!
Katie Dagon (Jul 21 2021 at 23:20):Just wanted to say that reviewing this thread (and the #ESDS FAQ page - thank you @Max Grover, @Deepak Cherian ) was very helpful for me to debug a KilledWorker error I was getting when trying to read and analyze large datasets with xarray and dask. In particular, it was helpful for me to 1) use preprocess to subset spatially and select variables during xr.open_mfdataset, 2) save out some intermediate (regridded) results to disk, 3) read them back in with additional lat/lon chunks. This final step helped with memory issues related to data chunked in time when a function (quantile) wanted only 1 chunk in time. Hope this helps anyone else who is also having these issues, which often show up as a mysterious KilledWorker error which can be difficult to debug. I'm very much looking forward to the Dask tutorials to help solidfy some of these best practices!
Last updated: May 16 2025 at 17:14 UTC