Posts tagged unstructured grids
Analyzing and Visualizing CAM-SE Output in Python
- 15 August 2023
We demonstrate a variety of options for analyzing and visualizing output from the Community Atmosphere Model (CAM) with the spectral element (SE) grid in Python. This notebook was developed for the ESDS Collaborative Work Time on Unstructured Grids, which took place on April 17, 2023. A recap of the related CAM-SE discussion can be found here.
Regrid CAM-SE output using map file
Plotting CESM Data on an Unstructured Grid using Geoviews and Datashader
- 13 August 2021
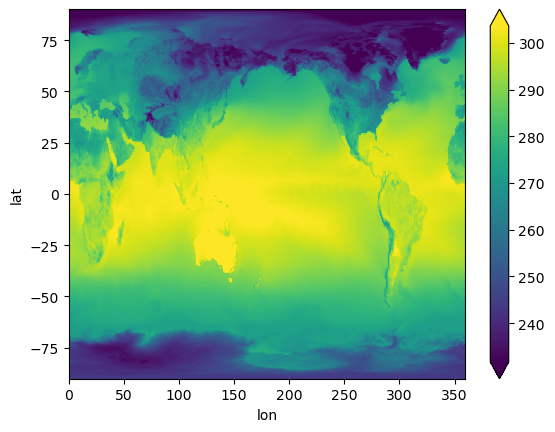
This week, during Xdev office hours, Steve Yeager raised a question regarding plotting unstructured grid data within Python. He was interested in plotting output from the Community Atmosphere Model, which supports unstructured grids, essentially a combination of triangles allowing for higher resolution in certain parts of the domain. This can be adventageous when wanting to achieve the benefits of high resolution within the primary domain, while maintaining the global scale of the model. This week, NCAR Science tweeted a great explanation of how revolutionary this capability is in the context of resolving processes over Greenland.
Unstructured grids can be difficult to plot directly within Python since they do not follow the typical lat, lon (x, y) convention. There is some preprocessing that needs to be applied before plotting.