Access SOCRATES Aircraft Campaign Data via GDEX Exchange
Required Packages
Please ensure the following packages are installed before proceeding.
| Category | Package | Purpose |
|---|---|---|
| Data Access & Analysis | fsspec | Open remote NetCDF files as a binary stream over HTTPS |
xarray | Load and manipulate NetCDF datasets | |
pandas | Datetime conversion utilities | |
numpy | Numerical operations and NaN masking | |
| Visualization (static) | matplotlib | Static scatter plot of the flight track |
| Visualization (interactive) | folium | Interactive Leaflet map |
Step 1 - Access the Data
The SOCRATES dataset is hosted on the NCAR GDEX Exchange portal. The file is a standard NetCDF served over plain HTTPS. Because xarray cannot pass an HTTPS URL directly to its file-reading backends, we use fsspec to open the remote file as a binary stream and hand that stream to xarray.open_dataset.
import fsspec
import xarray as xr

# the netcdf file is available to download at this URL, but xarray cannot read it directly.
# So we use fsspec to open the file as a binary stream through https, and then pass that stream to xarray.
# This works because the xarray can read from file-like objects created by the fsspec library.
url = "https://data.gdex.ucar.edu/exchange/RAF-Socrates-2018/FF01.20180108.161000_002845.PNI.nc"
f = fsspec.open(url, mode="rb").open()
ds = xr.open_dataset(f)
Step 2 - Plot the Flight Track (Static)
Plot the aircraft latitude (GGLAT) and longitude (GGLON) as a scatter plot with a connecting line ordered by time. Points are colored using the viridis colormap from earliest (purple) to latest (yellow). Start and end positions are highlighted with distinct markers.
import matplotlib.pyplot as plt
import matplotlib.dates as mdates
import numpy as np

lon = ds.GGLON.values
lat = ds.GGLAT.values
time = ds.Time.values.astype('datetime64[ms]').astype('O')  # convert to Python datetimes
time_num = mdates.date2num(time)

fig, ax = plt.subplots(figsize=(10, 6))

ax.plot(lon, lat, color='gray', linewidth=0.8, zorder=1)

sc = ax.scatter(lon, lat, c=time_num, cmap='viridis', s=10, zorder=2)

ax.scatter(lon[0], lat[0], color='#406093', s=80, zorder=3, label='Start')
ax.scatter(lon[-1], lat[-1], color='#FFC94D', s=80, zorder=3, label='End')

cbar = plt.colorbar(sc, ax=ax)
cbar.ax.invert_yaxis()
cbar.ax.yaxis.set_major_formatter(mdates.DateFormatter('%m-%d %H:%M'))
cbar.set_label('Time (UTC)')

ax.set_xlabel('Longitude')
ax.set_ylabel('Latitude')
ax.set_title('Flight Track (SOCRATES)')
ax.legend()
plt.tight_layout()
plt.show()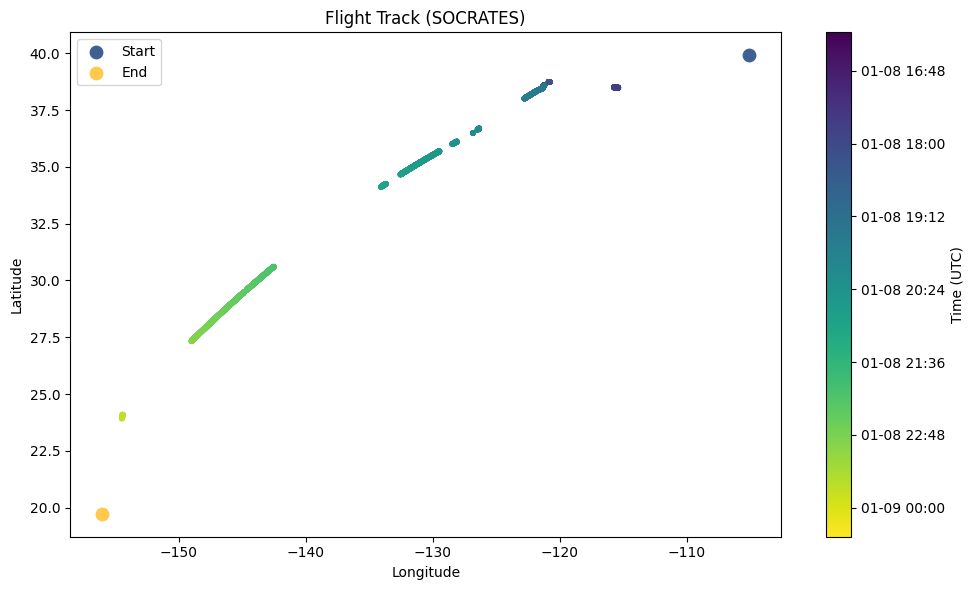
Step 3 - Interactive Map with Folium
Render the same flight track on an interactive Leaflet map using folium. NaN positions are removed before plotting. Points are subsampled every 30 seconds for performance; clicking any dot shows its exact UTC timestamp. The map is saved as a standalone HTML file that can be opened in any browser.
import folium
import numpy as np
import matplotlib.pyplot as plt
import matplotlib.colors as mcolors
import pandas as pd

lon = ds.GGLON.values
lat = ds.GGLAT.values
time = pd.to_datetime(ds.Time.values)

# Remove indices where either lon or lat is NaN
valid = ~(np.isnan(lon) | np.isnan(lat))
lon, lat, time = lon[valid], lat[valid], time[valid]

# Normalize time to [0,1] for colormap
t_norm = (time - time[0]) / (time[-1] - time[0])
cmap = plt.get_cmap('viridis')

def to_hex(val):
    return mcolors.to_hex(cmap(val))

# Subsample to keep map responsive (every 30s)
step = 30
lats = lat[::step]
lons = lon[::step]
t_vals = t_norm[::step]
times = time[::step]

# Center map on mean position
m = folium.Map(location=[lat.mean(), lon.mean()], zoom_start=5, tiles='CartoDB positron')

# Flight track line
coords = list(zip(lat.tolist(), lon.tolist()))
folium.PolyLine(coords, color='gray', weight=1.5, opacity=0.6).add_to(m)

# Colored circle markers
for la, lo, tv, t in zip(lats, lons, t_vals, times):
    folium.CircleMarker(
        location=[la, lo],
        radius=4,
        color=to_hex(float(tv)),
        fill=True,
        fill_color=to_hex(float(tv)),
        fill_opacity=0.85,
        popup=t.strftime('%Y-%m-%d %H:%M:%S UTC'),
    ).add_to(m)

# Start and end markers
folium.Marker([lat[0], lon[0]], tooltip='Start: ' + time[0].strftime('%H:%M UTC'),
              icon=folium.Icon(color='blue', icon='play')).add_to(m)
folium.Marker([lat[-1], lon[-1]], tooltip='End: ' + time[-1].strftime('%H:%M UTC'),
              icon=folium.Icon(color='orange', icon='stop')).add_to(m)

m.save('flight_track.html')
print('Saved to flight_track.html')
Saved to flight_track.html
m