

Climatology#
Overview#
The NCL climatology functions listed below can be replicated using xarray and/or geocat.comp
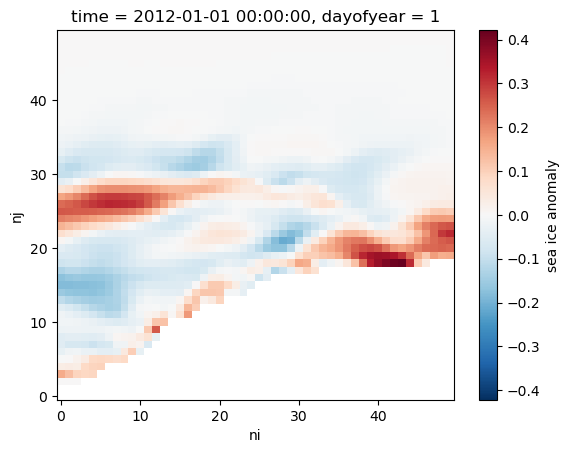
calcDayAnomTLL#
calcDayAnomTLL calculates daily anomalies from a daily data climatology
Grab and Go#
import xarray as xr
import geocat.datafiles as gdf
from matplotlib import pyplot as plt

ds = xr.open_dataset(gdf.get("applications_files/inputs/CMIP6_sea_ice_daily_subset.nc"))
aice = ds.aice_d
DayTLL = aice.groupby(aice.time.dt.dayofyear)
clmDayTLL = DayTLL.mean(dim="time")
calcDayAnomTLL = DayTLL - clmDayTLL

calcDayAnomTLL = calcDayAnomTLL.assign_attrs(long_name="sea ice anomaly")

calcDayAnomTLL[0, :, :].plot();
Downloading file 'applications_files/inputs/CMIP6_sea_ice_daily_subset.nc' from 'https://github.com/NCAR/GeoCAT-datafiles/raw/main/applications_files/inputs/CMIP6_sea_ice_daily_subset.nc' to '/home/runner/.cache/geocat'.
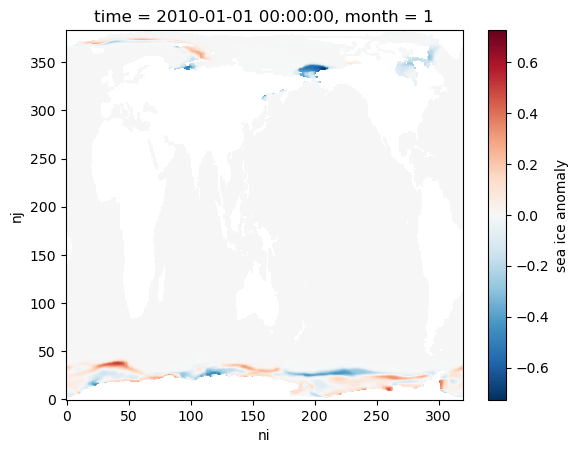
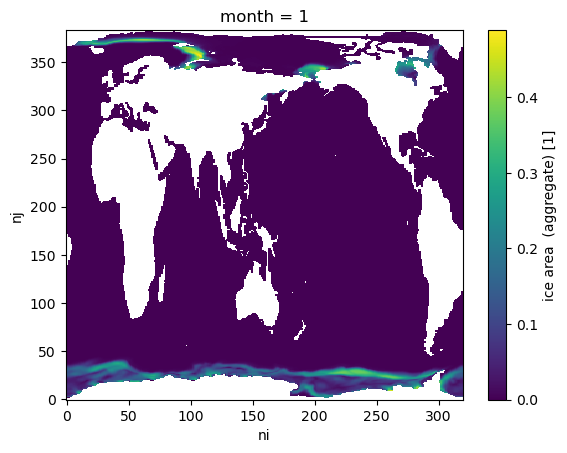
calcMonAnomTLL#
calcMonAnomTLL calculates monthly anomalies by subtracting the long-term mean from each point
Grab and Go#
import xarray as xr
import geocat.datafiles as gdf

ds = xr.open_dataset(
    gdf.get("applications_files/inputs/CMIP6_sea_ice_monthly_subset.nc")
)
aice = ds.aice
MonTLL = aice.groupby(aice.time.dt.month)
clmMonTLL = MonTLL.mean(dim="time")
calcMonAnomTLL = MonTLL - clmMonTLL

calcMonAnomTLL = calcMonAnomTLL.assign_attrs(long_name="sea ice anomaly")

calcMonAnomTLL[0, :, :].plot();
Downloading file 'applications_files/inputs/CMIP6_sea_ice_monthly_subset.nc' from 'https://github.com/NCAR/GeoCAT-datafiles/raw/main/applications_files/inputs/CMIP6_sea_ice_monthly_subset.nc' to '/home/runner/.cache/geocat'.
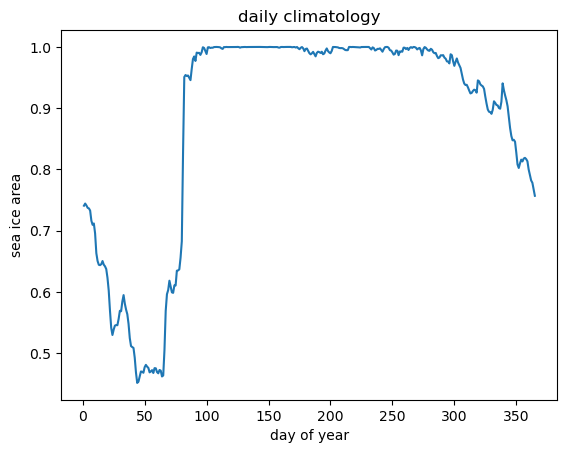
clmDayTLL#
clmDayTLL calculates long-term daily means (daily climatology) from daily data
Grab and Go#
import xarray as xr
import geocat.datafiles as gdf

ds = xr.open_dataset(gdf.get("applications_files/inputs/CMIP6_sea_ice_daily_subset.nc"))
aice = ds.aice_d
DayTLL = aice.groupby(aice.time.dt.dayofyear)
clmDayTLL = DayTLL.mean(dim="time")

clmDayTLL[:, 10, 10].plot()
plt.title("daily climatology")
plt.xlabel("day of year")
plt.ylabel("sea ice area");
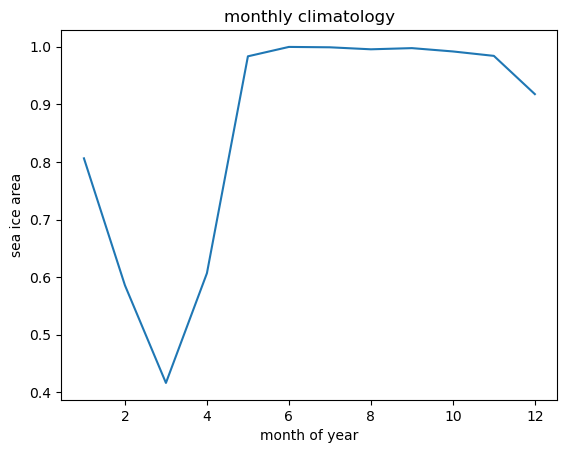
clmMonTLL#
clmMonTLL calculates long-term monthly means (monthly climatology) from monthly data
Grab and Go#
import xarray as xr
import geocat.datafiles as gdf

ds = xr.open_dataset(
    gdf.get("applications_files/inputs/CMIP6_sea_ice_monthly_subset.nc")
)
aice = ds.aice
MonTLL = aice.groupby(aice.time.dt.month)
clmMonTLL = MonTLL.mean(dim="time")

clmMonTLL[:, 10, 10].plot()
plt.title("monthly climatology")
plt.xlabel("month of year")
plt.ylabel("sea ice area");
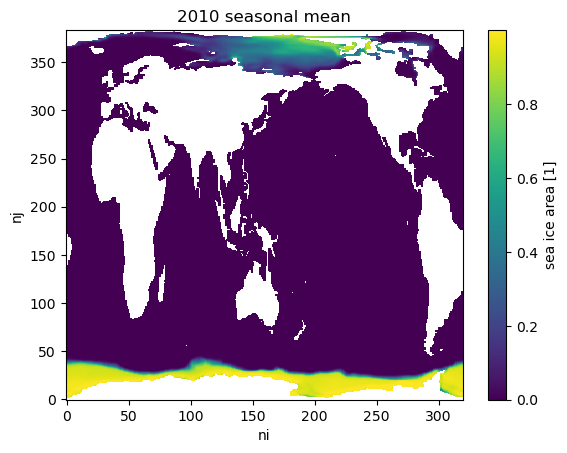
month_to_season#
month_to_season computes a user-specified three-month seasonal mean (DJF, JFM, FMA, MAM, AMJ, MJJ, JJA, JAS, ASO, SON, OND, NDJ)
Note
You can do something similar with directly with Xarray as shown in this example in the Xarray documentation. However, it requires substantially more code and doesn’t have as much flexibility with respect to how the seasons are defined.
Grab and Go#
import xarray as xr
import geocat.datafiles as gdf
from geocat.comp import month_to_season

ds = xr.open_dataset(
    gdf.get("applications_files/inputs/CMIP6_sea_ice_monthly_subset.nc")
)
aice = ds.aice
mon_to_season = month_to_season(aice, "ASO")

mon_to_season = mon_to_season.assign_attrs(long_name="sea ice area")

mon_to_season[0, :, :].plot()

plt.title("2010 seasonal mean");
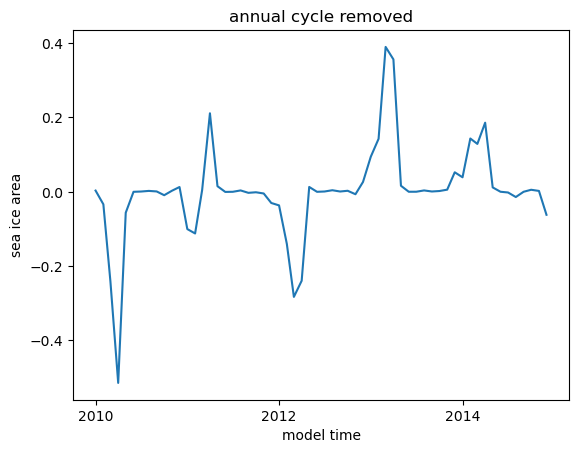
rmMonAnnCycTLL#
rmMonAnnCycTLL removes the annual cycle from monthly data
Grab and Go#
import xarray as xr
import geocat.datafiles as gdf

ds = xr.open_dataset(
    gdf.get("applications_files/inputs/CMIP6_sea_ice_monthly_subset.nc")
)
aice = ds.aice
MonTLL = aice.groupby(aice.time.dt.month)
clmMonTLL = MonTLL.mean(dim="time")
rmMonAnnCycTLL = MonTLL - clmMonTLL

rmMonAnnCycTLL[:, 10, 10].plot()
plt.title("annual cycle removed")
plt.ylabel("sea ice area");
stdMonTLL#
stdMonTLL calculates standard deviations of monthly means
Grab and Go#
import xarray as xr
import geocat.datafiles as gdf

ds = xr.open_dataset(
    gdf.get("applications_files/inputs/CMIP6_sea_ice_monthly_subset.nc")
)
aice = ds.aice
MonTLL = aice.groupby(aice.time.dt.month)
stdMonTLL = MonTLL.std(ddof=1)

stdMonTLL[0, :, :].plot();
Python Resources#
GeoCAT Applications climatology page
Climatematch Academy Xarray Data Analysis and Climatology tutorial
Project Pythia Foundations Computations and Masks with Xarray tutorial
Xarray User Guide section on time series data