Analytical uncertainty at CO2 measurement stations
Contents
Analytical uncertainty at CO2 measurement stations
%load_ext autoreload
%autoreload 2
from collections import OrderedDict
import numpy as np
import pandas as pd
import xarray as xr
xr.set_options(display_style='text')

import matplotlib.pyplot as plt

import figure_panels
import obs_surface
import util
Load the monthly data
Specify the records at each station to examine.
stn_records = dict(
    SPO=[
        'SPO_NOAA_insitu_CO2',
        'SPO_NOAA_flask_CO2',
        'SPO_SIO_O2_flask_CO2',
        'SPO_CSIRO_flask_CO2',
        'SPO_SIO_CDK_flask_CO2',
    ],
    CGO=[
        'CGO_CSIRO_insitu_CO2',
        'CGO_NOAA_flask_CO2',
        'CGO_CSIRO_flask_CO2',
        'CGO_SIO_O2_flask_CO2',
    ],
)
record_list = [ri for r in stn_records.values() for ri in r]
Read txt file containing the station data.
Make all records into a dataset for later plotting.
Compute mean across records at each station and generate “anomaly” columns.
# generate column names for the "anomaly" columns (minus station mean)
stn_records_a = dict()
for stn, records in stn_records.items():
    stn_records_a[stn] = [f'{rec}_mmedian' for rec in records]

# read monthly data
file = obs_surface.data_files('CO2', 'obs')
df = obs_surface.read_stndata(file)

# get dataset
stninfo = obs_surface.get_stn_info('CO2')
ds = obs_surface.to_dataset(
    stninfo, df, 'CO2',
    plot_coverage=False,
    dropna=False,
    unique_stn=False,
    gap_fill=False).to_dataset()

# keep only columns from stations specified above
df = df[filter(lambda s: '_CO2' in s and
               any(s in records for records in stn_records.values())
               or '_CO2' not in s, df.columns)]

# compute station median and add as new columns
for (stn, arecords), records in zip(stn_records_a.items(), stn_records.values()):
    df[stn] = df[records].median(axis=1)
    df[arecords] = df[records].sub(df[stn], axis=0)
df
| year | month | day | year_frac | polar_year | SPO_SIO_CDK_flask_CO2 | SPO_NOAA_insitu_CO2 | CGO_NOAA_flask_CO2 | CGO_CSIRO_insitu_CO2 | CGO_CSIRO_flask_CO2 | ... | SPO_NOAA_insitu_CO2_mmedian | SPO_NOAA_flask_CO2_mmedian | SPO_SIO_O2_flask_CO2_mmedian | SPO_CSIRO_flask_CO2_mmedian | SPO_SIO_CDK_flask_CO2_mmedian | CGO | CGO_CSIRO_insitu_CO2_mmedian | CGO_NOAA_flask_CO2_mmedian | CGO_CSIRO_flask_CO2_mmedian | CGO_SIO_O2_flask_CO2_mmedian | |
|---|---|---|---|---|---|---|---|---|---|---|---|---|---|---|---|---|---|---|---|---|---|
| date | |||||||||||||||||||||
| 1998-12-15 | 1998 | 12 | 15.5 | 1998.956164 | 1999 | 365.0013 | 365.0870 | 364.9250 | NaN | 364.8809 | ... | -0.00205 | 0.04095 | 0.00205 | NaN | -0.08775 | 364.88090 | NaN | 0.04410 | 0.00000 | -0.12380 |
| 1999-01-15 | 1999 | 1 | 15.5 | 1999.041096 | 1999 | 364.9615 | 365.0233 | 364.9575 | NaN | 364.9474 | ... | -0.06450 | 0.09930 | 0.00000 | 0.1202 | -0.12630 | 364.95750 | NaN | 0.00000 | -0.01010 | 0.02390 |
| 1999-02-14 | 1999 | 2 | 14.0 | 1999.123288 | 1999 | 364.7820 | 364.9477 | 365.0900 | NaN | 365.1991 | ... | -0.01380 | 0.08050 | 0.00000 | 0.1495 | -0.17950 | 365.09000 | NaN | 0.00000 | 0.10910 | -0.05870 |
| 1999-03-15 | 1999 | 3 | 15.5 | 1999.202740 | 1999 | 364.8418 | 364.8559 | 364.8880 | NaN | 364.8469 | ... | -0.01580 | 0.20000 | 0.00000 | 0.1283 | -0.02990 | 364.84690 | NaN | 0.04110 | 0.00000 | -0.15130 |
| 1999-04-15 | 1999 | 4 | 15.0 | 1999.287671 | 1999 | 365.0213 | 365.0247 | 364.9900 | NaN | 365.0387 | ... | 0.00000 | 0.11780 | 0.03150 | -0.0907 | -0.00340 | 364.99000 | NaN | 0.00000 | 0.04870 | -0.08340 |
| ... | ... | ... | ... | ... | ... | ... | ... | ... | ... | ... | ... | ... | ... | ... | ... | ... | ... | ... | ... | ... | ... |
| 2019-10-15 | 2019 | 10 | 15.5 | 2019.789041 | 2020 | 408.8537 | 408.8633 | 408.6825 | 408.8186 | 408.6942 | ... | 0.00960 | 0.00460 | -0.13460 | -0.1977 | 0.00000 | 408.68835 | 0.13025 | -0.00585 | 0.00585 | -0.20365 |
| 2019-11-15 | 2019 | 11 | 15.0 | 2019.873973 | 2020 | 408.8636 | 408.9070 | 408.8037 | 408.7658 | 408.7523 | ... | 0.04340 | 0.01640 | -0.10470 | -0.0246 | 0.00000 | 408.75905 | 0.00675 | 0.04465 | -0.00675 | -0.14465 |
| 2019-12-15 | 2019 | 12 | 15.5 | 2019.956164 | 2020 | 409.0132 | 408.8532 | 408.5017 | 408.5183 | 408.6873 | ... | -0.08780 | 0.05650 | -0.08230 | 0.0000 | 0.07220 | 408.51000 | 0.00830 | -0.00830 | 0.17730 | -0.08510 |
| 2020-01-15 | 2020 | 1 | 15.5 | 2020.040984 | 2020 | 408.8138 | NaN | NaN | NaN | NaN | ... | NaN | NaN | -0.04985 | NaN | 0.04985 | 408.02610 | NaN | NaN | NaN | 0.00000 |
| 2020-02-14 | 2020 | 2 | 14.5 | 2020.122951 | 2020 | 408.7241 | NaN | NaN | NaN | NaN | ... | NaN | NaN | -0.18450 | NaN | 0.18450 | 408.19060 | NaN | NaN | NaN | 0.00000 |
255 rows × 25 columns
Compute the long-term standard deviation of monthly records
print('Long-term std dev of monthly records:')
for stn, records in stn_records_a.items():
    print(f'{stn}: {np.nanstd(df[records].values):0.4f}')
Long-term std dev of monthly records:
SPO: 0.1269
CGO: 0.1077
Compute seasonal means
Loop over the seasons and generate seasonal averages.
Require at least 2 months to define a season.
seasons = OrderedDict([
    ('djf', [12, 1, 2]),
    ('mam', [3, 4, 5]),
    ('jja', [6, 7, 8]),
    ('son', [9, 10, 11]),
])
dfs_seasons = {}
for season, months in seasons.items():
    if season == 'djf':
        groupby_col = 'polar_year'
        drop_cols = ['month', 'day', 'year']
    else:
        groupby_col = 'year'
        drop_cols = ['month', 'day', 'polar_year']

    grouped = df.loc[df.month.isin(months)].groupby(groupby_col)

    dfs_seasons[season] = grouped.mean().where(grouped.count()>=2)
    dfs_seasons[season] = dfs_seasons[season].set_index('year_frac')
    dfs_seasons[season] = dfs_seasons[season].drop(drop_cols, axis=1)

dfs_seasons['son']
| SPO_SIO_CDK_flask_CO2 | SPO_NOAA_insitu_CO2 | CGO_NOAA_flask_CO2 | CGO_CSIRO_insitu_CO2 | CGO_CSIRO_flask_CO2 | SPO_CSIRO_flask_CO2 | CGO_SIO_O2_flask_CO2 | SPO_SIO_O2_flask_CO2 | SPO_NOAA_flask_CO2 | SPO | SPO_NOAA_insitu_CO2_mmedian | SPO_NOAA_flask_CO2_mmedian | SPO_SIO_O2_flask_CO2_mmedian | SPO_CSIRO_flask_CO2_mmedian | SPO_SIO_CDK_flask_CO2_mmedian | CGO | CGO_CSIRO_insitu_CO2_mmedian | CGO_NOAA_flask_CO2_mmedian | CGO_CSIRO_flask_CO2_mmedian | CGO_SIO_O2_flask_CO2_mmedian | |
|---|---|---|---|---|---|---|---|---|---|---|---|---|---|---|---|---|---|---|---|---|
| year_frac | ||||||||||||||||||||
| 1999.789954 | 366.546833 | 366.652033 | 366.485433 | NaN | 366.551133 | 366.622667 | 366.157433 | 366.636567 | 366.635833 | 366.622467 | 0.029567 | 0.013367 | 0.014100 | 0.000200 | -0.075633 | 366.485433 | NaN | 0.000000 | 0.065700 | -0.328000 |
| 2000.790528 | 367.783267 | 367.886567 | 367.676267 | NaN | 367.733767 | 367.693000 | 367.617033 | 367.929467 | 367.738800 | 367.781900 | 0.104667 | -0.043100 | 0.147567 | -0.057400 | 0.001367 | 367.676267 | NaN | 0.000000 | 0.057500 | -0.059233 |
| 2001.789954 | 369.528167 | 369.798500 | 369.552500 | NaN | 369.554000 | 369.600500 | 369.451733 | 369.716500 | 369.689367 | 369.693767 | 0.104733 | -0.004400 | 0.022733 | -0.093267 | -0.165600 | 369.536233 | NaN | 0.016267 | 0.017767 | -0.084500 |
| 2002.789954 | 371.808200 | 371.996267 | 371.783767 | NaN | 371.837167 | 371.861000 | 371.803200 | 371.917867 | 371.904767 | 371.876567 | 0.119700 | 0.028200 | 0.041300 | -0.015567 | -0.068367 | 371.800600 | NaN | -0.016833 | 0.036567 | 0.002600 |
| 2003.789954 | 373.815700 | 374.085800 | 373.887233 | NaN | 373.939467 | 373.976000 | 373.765833 | 374.045000 | 374.006367 | 374.013700 | 0.072100 | -0.007333 | 0.031300 | -0.037700 | -0.198000 | 373.891167 | NaN | -0.003933 | 0.048300 | -0.125333 |
| 2004.790528 | 375.593833 | 375.713767 | 375.600400 | 375.657567 | 375.692033 | 375.832500 | 375.218267 | 375.909600 | 375.782367 | 375.782883 | -0.069117 | -0.000517 | 0.126717 | 0.029450 | -0.189050 | 375.616933 | 0.040633 | -0.016533 | 0.075100 | -0.398667 |
| 2005.789954 | 377.834000 | 377.916767 | 377.713633 | 377.874400 | 377.910333 | 377.801500 | 377.662800 | 377.955333 | 377.895200 | 377.896867 | 0.019900 | -0.001667 | 0.058467 | -0.094300 | -0.062867 | 377.800133 | 0.074267 | -0.086500 | 0.110200 | -0.137333 |
| 2006.789954 | 379.322967 | 379.542000 | 379.468500 | 379.442533 | 379.405733 | 379.590500 | 379.266467 | 379.558933 | 379.597367 | 379.546483 | -0.004483 | 0.050883 | 0.012450 | 0.000000 | -0.223517 | 379.406117 | 0.036417 | 0.062383 | -0.000383 | -0.139650 |
| 2007.789954 | 381.619633 | 381.748333 | 381.553600 | 381.721733 | 381.596667 | NaN | 381.519933 | 381.835667 | 381.868867 | 381.775933 | -0.027600 | 0.092933 | 0.059733 | NaN | -0.156300 | 381.586500 | 0.135233 | -0.032900 | 0.010167 | -0.066567 |
| 2008.790528 | 383.354567 | 383.635400 | 383.582100 | 383.584767 | 383.613233 | NaN | 383.522433 | 383.575567 | 383.688867 | 383.617683 | 0.017717 | 0.071183 | -0.042117 | NaN | -0.263117 | 383.579400 | 0.005367 | 0.002700 | 0.033833 | -0.056967 |
| 2009.789954 | 384.973200 | 385.131367 | 385.073333 | 385.161800 | 385.063833 | NaN | 385.195867 | 385.059600 | 385.171400 | 385.071583 | 0.059783 | 0.099817 | -0.011983 | NaN | -0.098383 | 385.086333 | 0.075467 | -0.013000 | -0.022500 | 0.109533 |
| 2010.789954 | 387.313067 | 387.412467 | 387.400000 | 387.370700 | 387.334433 | 387.382000 | 387.246600 | 387.349067 | 387.444133 | 387.388483 | 0.023983 | 0.055650 | -0.039417 | -0.019850 | -0.075417 | 387.343083 | 0.027617 | 0.041525 | -0.008650 | -0.068775 |
| 2011.789954 | 388.991500 | 389.038333 | 388.994467 | 388.987867 | 388.984233 | 388.916333 | 388.850267 | 388.988167 | 389.018600 | 389.004767 | 0.033567 | 0.013833 | -0.016600 | -0.088433 | -0.013267 | 388.958333 | 0.029533 | 0.036133 | 0.025900 | -0.108067 |
| 2012.790528 | 391.231667 | 391.335700 | 391.220400 | 391.239667 | 391.290533 | NaN | 391.218333 | 391.239967 | 391.303600 | 391.278783 | 0.056917 | 0.024817 | -0.038817 | NaN | -0.047117 | 391.238433 | 0.001233 | -0.018033 | 0.052100 | -0.020100 |
| 2013.789954 | 393.986967 | 393.999967 | 393.814733 | 393.928567 | 393.901033 | 394.091000 | 393.837400 | 393.902167 | 394.021100 | 394.005300 | -0.005333 | 0.015800 | -0.103133 | 0.085700 | -0.018333 | 393.865400 | 0.063167 | -0.050667 | 0.035633 | -0.028000 |
| 2014.789954 | 395.954567 | 395.908433 | 395.725000 | 395.804000 | 395.841600 | 396.073667 | 395.490933 | 395.829900 | 395.935800 | 395.933733 | -0.025300 | 0.002067 | -0.103833 | 0.139933 | 0.020833 | 395.754033 | 0.049967 | -0.029033 | 0.087567 | -0.263100 |
| 2015.789954 | 398.563600 | 398.430967 | 398.469833 | 398.406500 | 398.446767 | 398.569667 | 398.309333 | 398.560333 | 398.534433 | 398.537433 | -0.106467 | -0.003000 | 0.022900 | 0.032233 | 0.026167 | 398.413400 | -0.006900 | 0.056433 | 0.033367 | -0.104067 |
| 2016.790528 | 401.810833 | 401.629667 | 401.493333 | 401.538233 | 401.521000 | 401.779333 | 401.320600 | 401.651300 | 401.664167 | 401.696833 | -0.067167 | -0.032667 | -0.045533 | 0.082500 | 0.114000 | 401.500933 | 0.037300 | -0.007600 | 0.020067 | -0.180333 |
| 2017.789954 | 403.589000 | 403.638500 | 403.447533 | 403.673933 | 403.625500 | 403.517000 | 403.538600 | 403.545800 | 403.665267 | 403.617300 | 0.021200 | 0.047967 | -0.071500 | -0.100300 | 0.000000 | 403.594267 | 0.079667 | -0.146733 | 0.031233 | -0.055667 |
| 2018.789954 | 406.291133 | 406.126200 | 406.021667 | 405.938500 | 405.995100 | 406.003000 | 405.752733 | 405.997000 | 406.063500 | 406.046200 | 0.080000 | 0.017300 | -0.049200 | -0.043200 | 0.244933 | 405.933317 | 0.005183 | 0.088350 | 0.061783 | -0.180583 |
| 2019.789954 | 408.820433 | 408.828767 | 408.737400 | 408.761267 | 408.726200 | 408.712333 | 408.527933 | 408.685833 | 408.813867 | 408.806867 | 0.021900 | 0.007000 | -0.121033 | -0.094533 | 0.013567 | 408.720033 | 0.041233 | 0.017367 | 0.006167 | -0.192100 |
Long-term seasonal means
# make list of *all* records
records = [record for stn, records in stn_records_a.items() for record in records]

# dimension dictionary with lists
df_mean = {'season': list(seasons.keys())}
df_mean.update({r: [] for r in records})

# loop over seasons, compute long-term mean
for season in seasons:
    for r in records:
        df_mean[r].append(dfs_seasons[season][r].mean(axis=0))
df_mean = pd.DataFrame(df_mean).set_index('season')
df_mean
| SPO_NOAA_insitu_CO2_mmedian | SPO_NOAA_flask_CO2_mmedian | SPO_SIO_O2_flask_CO2_mmedian | SPO_CSIRO_flask_CO2_mmedian | SPO_SIO_CDK_flask_CO2_mmedian | CGO_CSIRO_insitu_CO2_mmedian | CGO_NOAA_flask_CO2_mmedian | CGO_CSIRO_flask_CO2_mmedian | CGO_SIO_O2_flask_CO2_mmedian | |
|---|---|---|---|---|---|---|---|---|---|
| season | |||||||||
| djf | -0.017290 | 0.024567 | -0.004355 | 0.106728 | -0.056947 | 0.004599 | 0.027571 | 0.007436 | -0.068187 |
| mam | 0.039309 | 0.006748 | -0.035228 | -0.040449 | -0.001835 | 0.061413 | -0.005066 | -0.009310 | -0.039366 |
| jja | 0.067344 | -0.003321 | -0.036373 | -0.078673 | 0.015745 | 0.032955 | 0.004226 | -0.000957 | -0.056112 |
| son | 0.021917 | 0.021340 | -0.005043 | -0.016149 | -0.058767 | 0.043461 | -0.004791 | 0.037020 | -0.118329 |
SD of the long-term mean at each station
error = {'season': list(seasons.keys())}
error.update({stn: [] for stn in stn_records.keys()})
for stn, arecords in stn_records_a.items():
    for season in seasons:
        error[stn].append(df_mean.loc[season][arecords].std(ddof=1))

df_error = pd.DataFrame(error).set_index('season')
df_error
| SPO | CGO | |
|---|---|---|
| season | ||
| djf | 0.061237 | 0.041960 |
| mam | 0.032685 | 0.042500 |
| jja | 0.054904 | 0.037213 |
| son | 0.033189 | 0.074899 |
Median across records at SPO and CGO
ds_mSPO_med = (ds.sel(record=stn_records['SPO']) - ds.sel(record=stn_records['SPO']).median('record', skipna=True))
ds_mCGO_med = (ds.sel(record=stn_records['CGO']) - ds.sel(record=stn_records['CGO']).median('record', skipna=True))
ds_m_med = xr.concat((ds_mSPO_med, ds_mCGO_med), 'record')
ds_m_med.record
<xarray.DataArray 'record' (record: 9)>
array(['SPO_NOAA_insitu_CO2', 'SPO_NOAA_flask_CO2', 'SPO_SIO_O2_flask_CO2',
       'SPO_CSIRO_flask_CO2', 'SPO_SIO_CDK_flask_CO2', 'CGO_CSIRO_insitu_CO2',
       'CGO_NOAA_flask_CO2', 'CGO_CSIRO_flask_CO2', 'CGO_SIO_O2_flask_CO2'],
      dtype=object)
Coordinates:
  * record       (record) object 'SPO_NOAA_insitu_CO2' ... 'CGO_SIO_O2_flask_...
    institution  (record) object 'NOAA' 'NOAA' 'SIO_O2' ... 'CSIRO' 'SIO_O2'
    lat          (record) float64 -89.98 -89.98 -89.98 ... -40.68 -40.68 -40.68
    lon          (record) float64 -24.8 -24.8 -24.8 -24.8 ... 144.7 144.7 144.7
    stncode      (record) object 'SPO' 'SPO' 'SPO' 'SPO' ... 'CGO' 'CGO' 'CGO'
Seasonal means of the medians
ds_djf = util.ann_mean(ds_m_med, season='DJF', time_bnds_varname=None, n_req=2,)
ds_jja = util.ann_mean(ds_m_med, season='JJA', time_bnds_varname=None, n_req=2,)

ds_djf.time
<xarray.DataArray 'time' (time: 22)>
array([1999, 2000, 2001, 2002, 2003, 2004, 2005, 2006, 2007, 2008, 2009, 2010,
2011, 2012, 2013, 2014, 2015, 2016, 2017, 2018, 2019, 2020])
Coordinates:
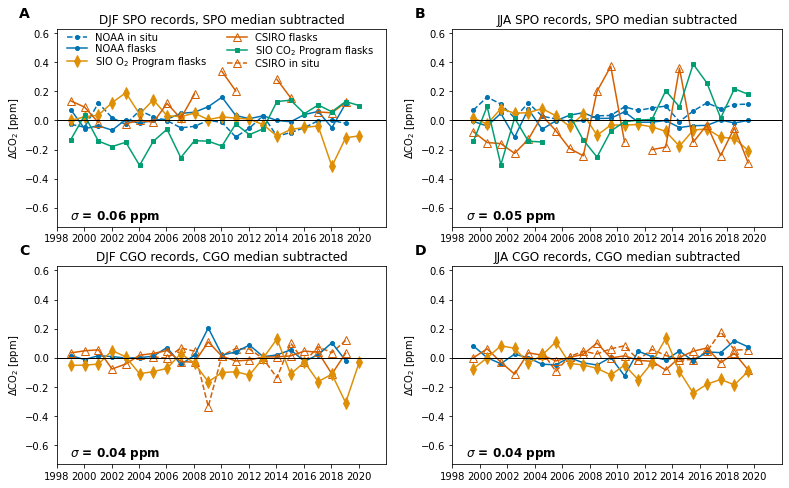
* time (time) int64 1999 2000 2001 2002 2003 ... 2016 2017 2018 2019 2020Time series of SPO and CGO records
fig = plt.figure(figsize=(6, 8))

ncol = 2
nrow = 2
fig, axs = plt.subplots(nrow, ncol, figsize=(6.5*ncol, 4*nrow))

marker_spec = figure_panels.marker_spec_co2_inst()

labels = dict(
    SPO_NOAA_insitu_CO2='NOAA in situ',
    SPO_NOAA_flask_CO2='NOAA flasks',
    SPO_SIO_O2_flask_CO2='SIO O$_2$ Program flasks',
    SPO_SIO_CDK_flask_CO2='SIO CO$_2$ Program flasks',
    SPO_CSIRO_flask_CO2='CSIRO flasks',
    CGO_NOAA_flask_CO2='NOAA flasks',
    CGO_SIO_O2_flask_CO2='SIO O$_2$ Program flasks',
    CGO_CSIRO_flask_CO2='CSIRO flasks',
    CGO_CSIRO_insitu_CO2='CSIRO in situ',
)

def ammendments(ax):
    ax.axhline(0, color='k', lw=1);
    ax.set_ylabel('$\Delta$CO$_2$ [ppm]')
    ax.set_xticks(np.arange(1998, 2022, 2));
    ax.set_xlim([1998, 2022])
    ax.set_ylim([-0.73, 0.63]);

plotted_elements = []
legend_elements = []


dset = ds_djf.CO2.sel(record=record_list).copy()
# for stn in ['SPO', 'CGO']:
#     idx = np.where(dset.stncode == stn)[0]
#     dset[:, idx] = dset[:, idx]


x = dset.time + util.season_yearfrac['DJF']
for i, record in enumerate(dset.record.values):
    ax = axs[0, 0] if 'SPO' in record else axs[1, 0]
    y = dset.sel(record=record)
    ls = '--' if 'insitu' in record else '-'

    inst = str(dset.sel(record=record).institution.values)
    p = ax.plot(x, y, linestyle=ls, label=labels[record], **marker_spec[inst])
    if labels[record] not in plotted_elements:
        legend_elements.append(p[0])
        plotted_elements.append(labels[record])


dset = ds_jja.CO2.sel(record=record_list).copy()
# for stn in ['SPO', 'CGO']:
#     idx = np.where(dset.stncode == stn)[0]
#     dset[:, idx] = dset[:, idx]


x = dset.time + util.season_yearfrac['JJA']
for i, record in enumerate(dset.record.values):
    ax = axs[0, 1] if 'SPO' in record else axs[1, 1]
    y = dset.sel(record=record)
    ls = '--' if 'insitu' in record else '-'
    inst = str(dset.sel(record=record).institution.values)
    p = ax.plot(x, y, linestyle=ls, label=labels[record], **marker_spec[inst])
    if labels[record] not in plotted_elements:
        legend_elements.append(p[0])
        plotted_elements.append(labels[record])

for ax in axs.ravel():
    ammendments(ax)


xoff = 1
yoff = 0.05
str_text = f'$\sigma$ = {df_error.loc["djf"].SPO:0.2f} ppm'
axs[0, 0].text(ax.get_xlim()[0]+xoff, ax.get_ylim()[0]+yoff,
        str_text, fontsize=12, fontweight='bold',
       )

str_text = f'$\sigma$ = {df_error.loc["djf"].CGO:0.2f} ppm'
axs[1, 0].text(ax.get_xlim()[0]+xoff, ax.get_ylim()[0]+yoff,
        str_text, fontsize=12, fontweight='bold',
       )

str_text = f'$\sigma$ = {df_error.loc["jja"].SPO:0.2f} ppm'
axs[0, 1].text(ax.get_xlim()[0]+xoff, ax.get_ylim()[0]+yoff,
        str_text, fontsize=12, fontweight='bold',
       )

str_text = f'$\sigma$ = {df_error.loc["jja"].CGO:0.2f} ppm'
axs[1, 1].text(ax.get_xlim()[0]+xoff, ax.get_ylim()[0]+yoff,
        str_text, fontsize=12, fontweight='bold',
       )

axs[0, 0].set_title('DJF SPO records, SPO median subtracted')
axs[1, 0].set_title('DJF CGO records, CGO median subtracted')


axs[0, 1].set_title('JJA SPO records, SPO median subtracted')
axs[1, 1].set_title('JJA CGO records, CGO median subtracted')

util.label_plots(fig, [ax for ax in axs.ravel()])

axs[0, 0].legend(handles=legend_elements, ncol=2, loc=(0.02, 0.78), frameon=False, labelspacing=0.1)

util.savefig('SPO-CGO-record-discrepancies')
<Figure size 432x576 with 0 Axes>