The ocean model prints running diagnostics to its log file. x4c.Logs parses the
compressed logs and turns them into a table, which is the fastest way to see whether
a run is drifting without post-processing anything.
import os
import numpy as np
import xarray as xr
import matplotlib.pyplot as plt
import nc_time_axis  # registers the cftime axis converter for matplotlib
import x4c

x4c.set_style('journal')

# after set_style: it resets rcParams from matplotlibrc defaults, which includes the
# backend, so assert the inline backend last or figures are never captured
%matplotlib inline

# The tutorial runs against a reduced copy of a real CESM case. It is published as a
# GitHub Release asset rather than committed, so the first call downloads it into
# ~/.cache/x4c (override with $X4C_CACHE_DIR) and later calls reuse it. Set
# $X4C_SAMPLE_DIR to point at a copy you already have.
case_dir = x4c.fetch_sample_data(case='cesm1', verbose=False)
casename = os.path.basename(case_dir)
print('x4c', x4c.__version__)
x4c 2026.6.11
log_dir = os.path.join(case_dir, 'logs')
logs = x4c.Logs(log_dir, comp='ocn')
>>> Logs.dirpath: ~/.cache/x4c/sample_data/cesm1_sample_data/b.e13.B1850C5.ne16_g16.icesm131_d18O_fixer.Miocene.3xCO2.005/logs
>>> 8 Logs.paths:
Start: ocn.log.2682906.desched1.231221-232436.gz
End: ocn.log.2689679.desched1.231224-030444.gz
Extracting variables
get_vars scans for the diagnostics you name. The default list covers most POP
diagnostics; anything not present in the logs is skipped with a note rather than
failing.
logs.get_vars(vn=['TEMP', 'SALT', 'SSH', 'HBLT'])
logs.df.head(12)df is monthly and df_ann is the annual mean, both indexed so you can plot
directly.
print('monthly rows:', len(logs.df))
print('annual rows :', len(logs.df_ann))
logs.df_ann.head()
monthly rows: 1919
annual rows : 160
fig, ax = logs.plot_vars(vn=['TEMP', 'SALT'], figsize=(11, 3.2), ncol=2)
x4c.showfig(fig)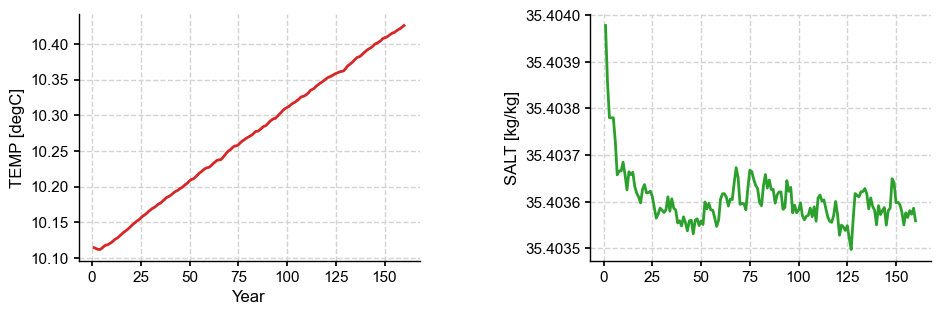
Comparing two runs
compare_vars overlays a reference case in black, which is the usual way to check a
branch run against its parent. Here the sample is compared against itself, so the
curves coincide.
logs_ref = x4c.Logs(log_dir, comp='ocn')
logs_ref.get_vars(vn=['TEMP', 'SALT'])

fig, ax = logs.compare_vars(logs_ref, vn=['TEMP', 'SALT'], figsize=(11, 3.2), ncol=2)
x4c.showfig(fig)
>>> Logs.dirpath: ~/.cache/x4c/sample_data/cesm1_sample_data/b.e13.B1850C5.ne16_g16.icesm131_d18O_fixer.Miocene.3xCO2.005/logs
>>> 8 Logs.paths:
Start: ocn.log.2682906.desched1.231221-232436.gz
End: ocn.log.2689679.desched1.231224-030444.gz
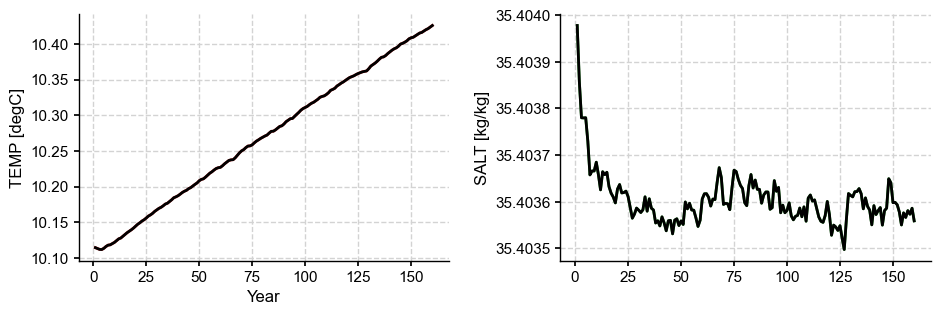
The sample ships only the first eight ocean logs, so the series is short. On a real case this is the quickest drift check available — no timeseries generation needed.