plt.figure(figsize=(20,8))
#Define projection
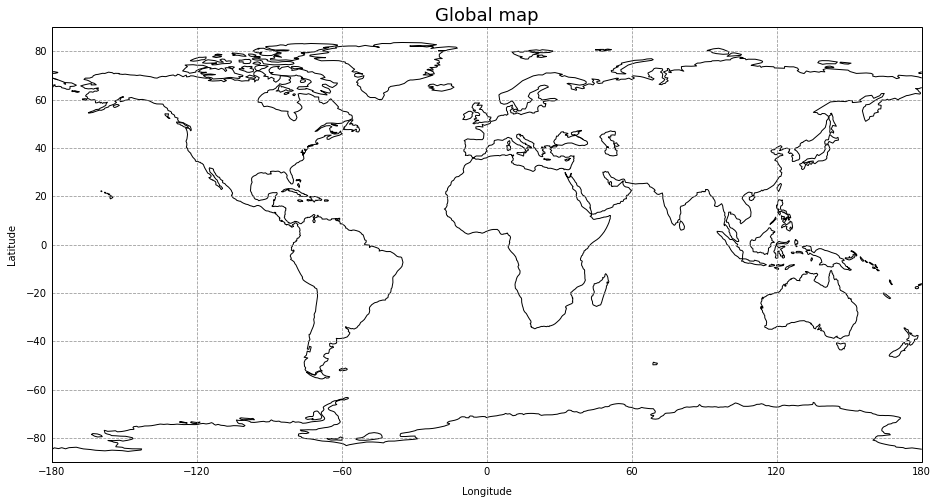
ax = plt.axes(projection=ccrs.PlateCarree())
# add coastlines
ax.add_feature(cfeature.COASTLINE)
#add lat lon grids
gl = ax.gridlines(draw_labels=True, color='grey', alpha=0.8, linestyle='--')
gl.xlabels_top = False
gl.ylabels_right = False
# Titles
# Main
plt.title("Global map",fontsize=18)
# y-axis
ax.text(-0.04, 0.5, 'Latitude', va='bottom', ha='center',
rotation='vertical', rotation_mode='anchor',
transform=ax.transAxes)
# x-axis
ax.text(0.5, -0.08, 'Longitude', va='bottom', ha='center',
rotation='horizontal', rotation_mode='anchor',
transform=ax.transAxes)
plt.show()