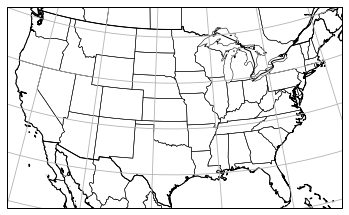
# projections-conus.py
# Carl Drews
# July 2020
# Added Lambert Conformal CONUS and Mexican states to Cartopy example 5 at:
# https://scitools.org.uk/cartopy/docs/latest/crs/projections.html#lambertconformal

import cartopy.crs as ccrs
import cartopy.feature as cfeature
import matplotlib.pyplot as plt
import cartopy.io.shapereader


#plt.figure(figsize=(4.2897, 3))
myLambert = ccrs.LambertConformal(central_longitude=-97.0,
   central_latitude=(30.0 + 60.0)/2)
ax = plt.axes(projection=myLambert)
ax.set_extent([-119.90, -73.50, 23.08, 50.00])

# set up line width
width = 1.0

ax.coastlines(resolution='50m', linewidth=width)
ax.add_feature(cfeature.BORDERS.with_scale("50m"), linewidth=width)
ax.add_feature(cfeature.STATES.with_scale("50m"), linewidth=width/2)

# States of Mexico
# download from: https://www.naturalearthdata.com/downloads/10m-cultural-vectors/
shapeFilename = "./ne_10m_admin_1_states_provinces/ne_10m_admin_1_states_provinces.shp"
print("Reading states provinces from {}\n".format(shapeFilename))
reader = cartopy.io.shapereader.Reader(shapeFilename)
statesProvinces = reader.records()

mexicoStates = []
for stateProvince in statesProvinces:
   if (stateProvince.attributes["admin"] == "Mexico"):
      print("State province {}".format(stateProvince.attributes["name"]))
      mexicoStates.append(stateProvince.geometry)

ax.add_geometries(mexicoStates, ccrs.PlateCarree(),
   edgecolor="black", facecolor='none', linewidth=width/2)

ax.gridlines()

savePath = "./images/projection-conus.png"

try:
    print("Saving image to {}\n".format(savePath))
    # trim whitespace but leave a narrow margin
    plt.savefig(savePath,
        bbox_inches="tight", pad_inches=0.04)

except RuntimeError as oops:
    print("{}\n".format(traceback.format_exc()))
