Example Map Plotting
[1]:
# By line: RRB 2020-07-20
# Script aims to:
# - Load a netCDF file
# - Extract one variable: CO
# - Create contour plot as a world map with coastlines
# - Add axes labels
# - Add grid lines
At the start of a Jupyter notebook you need to import all modules that you will use.
[2]:
import matplotlib.pyplot as plt
import cartopy.crs as ccrs                 # For plotting maps
import cartopy.feature as cfeature         # For plotting maps
from pathlib import Path                   # System agnostic paths
import xarray as xr                        # For loading the data arrays
Define the directories and file of interest for your results.
[3]:
result_dir = Path("../../data/")
file = "CAM_chem_merra2_FCSD_1deg_QFED_monthoutput_CO_201801.nc"
file_to_open = result_dir / file
#the netcdf file is now held in an xarray dataset named 'nc_load' and can be referenced later in the notebook
nc_load = xr.open_dataset(file_to_open)
#to see what the netCDF file contains, call the file read variable
nc_load
[3]:
xarray.Dataset
- ilev: 57
- lat: 192
- lev: 56
- lon: 288
- nbnd: 2
- time: 1
- lat(lat)float64-90.0 -89.06 -88.12 ... 89.06 90.0
- long_name :
- latitude
- units :
- degrees_north
array([-90. , -89.057592, -88.115183, -87.172775, -86.230366, -85.287958, -84.34555 , -83.403141, -82.460733, -81.518325, -80.575916, -79.633508, -78.691099, -77.748691, -76.806283, -75.863874, -74.921466, -73.979058, -73.036649, -72.094241, -71.151832, -70.209424, -69.267016, -68.324607, -67.382199, -66.439791, -65.497382, -64.554974, -63.612565, -62.670157, -61.727749, -60.78534 , -59.842932, -58.900524, -57.958115, -57.015707, -56.073298, -55.13089 , -54.188482, -53.246073, -52.303665, -51.361257, -50.418848, -49.47644 , -48.534031, -47.591623, -46.649215, -45.706806, -44.764398, -43.82199 , -42.879581, -41.937173, -40.994764, -40.052356, -39.109948, -38.167539, -37.225131, -36.282723, -35.340314, -34.397906, -33.455497, -32.513089, -31.570681, -30.628272, -29.685864, -28.743455, -27.801047, -26.858639, -25.91623 , -24.973822, -24.031414, -23.089005, -22.146597, -21.204188, -20.26178 , -19.319372, -18.376963, -17.434555, -16.492147, -15.549738, -14.60733 , -13.664921, -12.722513, -11.780105, -10.837696, -9.895288, -8.95288 , -8.010471, -7.068063, -6.125654, -5.183246, -4.240838, -3.298429, -2.356021, -1.413613, -0.471204, 0.471204, 1.413613, 2.356021, 3.298429, 4.240838, 5.183246, 6.125654, 7.068063, 8.010471, 8.95288 , 9.895288, 10.837696, 11.780105, 12.722513, 13.664921, 14.60733 , 15.549738, 16.492147, 17.434555, 18.376963, 19.319372, 20.26178 , 21.204188, 22.146597, 23.089005, 24.031414, 24.973822, 25.91623 , 26.858639, 27.801047, 28.743455, 29.685864, 30.628272, 31.570681, 32.513089, 33.455497, 34.397906, 35.340314, 36.282723, 37.225131, 38.167539, 39.109948, 40.052356, 40.994764, 41.937173, 42.879581, 43.82199 , 44.764398, 45.706806, 46.649215, 47.591623, 48.534031, 49.47644 , 50.418848, 51.361257, 52.303665, 53.246073, 54.188482, 55.13089 , 56.073298, 57.015707, 57.958115, 58.900524, 59.842932, 60.78534 , 61.727749, 62.670157, 63.612565, 64.554974, 65.497382, 66.439791, 67.382199, 68.324607, 69.267016, 70.209424, 71.151832, 72.094241, 73.036649, 73.979058, 74.921466, 75.863874, 76.806283, 77.748691, 78.691099, 79.633508, 80.575916, 81.518325, 82.460733, 83.403141, 84.34555 , 85.287958, 86.230366, 87.172775, 88.115183, 89.057592, 90. ]) - lon(lon)float640.0 1.25 2.5 ... 356.2 357.5 358.8
- long_name :
- longitude
- units :
- degrees_east
array([ 0. , 1.25, 2.5 , ..., 356.25, 357.5 , 358.75])
- lev(lev)float641.868 2.353 2.948 ... 977.5 992.5
- long_name :
- hybrid level at midpoints (1000*(A+B))
- units :
- hPa
- positive :
- down
- standard_name :
- atmosphere_hybrid_sigma_pressure_coordinate
- formula_terms :
- a: hyam b: hybm p0: P0 ps: PS
array([ 1.86788 , 2.352591, 2.948321, 3.676501, 4.561686, 5.631801, 6.918321, 8.456392, 10.284921, 12.46015 , 15.05025 , 18.124349, 21.761005, 26.04911 , 31.088909, 36.99271 , 43.909661, 52.01591 , 61.495658, 72.557859, 85.439015, 100.51436 , 118.250001, 139.114998, 163.661499, 192.541018, 226.513538, 266.479053, 312.791578, 356.2501 , 393.750101, 431.250103, 468.750104, 506.250106, 543.750107, 581.250146, 618.750192, 656.250164, 687.500123, 712.500099, 737.50009 , 762.499966, 787.500035, 810.000211, 827.500168, 842.500124, 857.500048, 872.499948, 887.499958, 902.499918, 917.499923, 932.500084, 947.499983, 962.499803, 977.4999 , 992.500011]) - ilev(ilev)float641.651 2.085 2.62 ... 985.0 1e+03
- long_name :
- hybrid level at interfaces (1000*(A+B))
- units :
- hPa
- positive :
- down
- standard_name :
- atmosphere_hybrid_sigma_pressure_coordinate
- formula_terms :
- a: hyai b: hybi p0: P0 ps: PS
array([ 1.65079 , 2.08497 , 2.620211, 3.276431, 4.076571, 5.046801, 6.216801, 7.619842, 9.292942, 11.2769 , 13.6434 , 16.457099, 19.791599, 23.73041 , 28.36781 , 33.810008, 40.175412, 47.643911, 56.387909, 66.603407, 78.512311, 92.365719, 108.663 , 127.837002, 150.392994, 176.930004, 208.152032, 244.875044, 288.083062, 337.500095, 375.000104, 412.500098, 450.000107, 487.500101, 525.00011 , 562.500104, 600.000188, 637.500197, 675.000131, 700.000115, 725.000083, 750.000097, 774.999835, 800.000235, 820.000187, 835.00015 , 850.000098, 864.999998, 879.999898, 895.000018, 909.999818, 925.000029, 940.000139, 954.999827, 969.999779, 985.000021, 1000. ]) - time(time)datetime64[ns]2018-02-01
- long_name :
- time
- bounds :
- time_bnds
array(['2018-02-01T00:00:00.000000000'], dtype='datetime64[ns]')
- hyam(lev)float64...
- long_name :
- hybrid A coefficient at layer midpoints
array([1.867880e-03, 2.352591e-03, 2.948321e-03, 3.676501e-03, 4.561686e-03, 5.631801e-03, 6.918321e-03, 8.456392e-03, 1.028492e-02, 1.246015e-02, 1.505025e-02, 1.812435e-02, 2.176100e-02, 2.604911e-02, 3.108891e-02, 3.699271e-02, 4.390966e-02, 5.201591e-02, 6.149566e-02, 7.255786e-02, 8.543902e-02, 1.005144e-01, 1.182500e-01, 1.391150e-01, 1.636615e-01, 1.890610e-01, 2.090285e-01, 2.206140e-01, 2.241305e-01, 2.213370e-01, 2.154630e-01, 2.077045e-01, 1.981780e-01, 1.873580e-01, 1.756140e-01, 1.629345e-01, 1.495850e-01, 1.358030e-01, 1.238273e-01, 1.140702e-01, 1.042735e-01, 9.423257e-02, 8.396707e-02, 7.472810e-02, 6.749231e-02, 6.120792e-02, 5.487466e-02, 4.851756e-02, 4.216051e-02, 3.577641e-02, 2.933141e-02, 2.285256e-02, 1.637395e-02, 9.864276e-03, 3.320900e-03, 2.402413e-05]) - hybm(lev)float64...
- long_name :
- hybrid B coefficient at layer midpoints
array([0.000000e+00, 0.000000e+00, 0.000000e+00, 0.000000e+00, 0.000000e+00, 0.000000e+00, 0.000000e+00, 0.000000e+00, 0.000000e+00, 0.000000e+00, 0.000000e+00, 0.000000e+00, 0.000000e+00, 0.000000e+00, 0.000000e+00, 0.000000e+00, 0.000000e+00, 0.000000e+00, 0.000000e+00, 0.000000e+00, 0.000000e+00, 0.000000e+00, 0.000000e+00, 0.000000e+00, 4.087707e-09, 3.480017e-03, 1.748503e-02, 4.586505e-02, 8.866108e-02, 1.349131e-01, 1.782871e-01, 2.235456e-01, 2.705721e-01, 3.188921e-01, 3.681361e-01, 4.183156e-01, 4.691652e-01, 5.204472e-01, 5.636729e-01, 5.984299e-01, 6.332266e-01, 6.682674e-01, 7.035330e-01, 7.352721e-01, 7.600079e-01, 7.812922e-01, 8.026254e-01, 8.239824e-01, 8.453394e-01, 8.667235e-01, 8.881685e-01, 9.096475e-01, 9.311260e-01, 9.526355e-01, 9.741790e-01, 9.924760e-01]) - P0()float64...
- long_name :
- reference pressure
- units :
- Pa
array(100000.)
- hyai(ilev)float64...
- long_name :
- hybrid A coefficient at layer interfaces
array([1.650790e-03, 2.084970e-03, 2.620211e-03, 3.276431e-03, 4.076571e-03, 5.046801e-03, 6.216801e-03, 7.619842e-03, 9.292942e-03, 1.127690e-02, 1.364340e-02, 1.645710e-02, 1.979160e-02, 2.373041e-02, 2.836781e-02, 3.381001e-02, 4.017541e-02, 4.764391e-02, 5.638791e-02, 6.660341e-02, 7.851231e-02, 9.236572e-02, 1.086630e-01, 1.278370e-01, 1.503930e-01, 1.769300e-01, 2.011920e-01, 2.168650e-01, 2.243630e-01, 2.238980e-01, 2.187760e-01, 2.121500e-01, 2.032590e-01, 1.930970e-01, 1.816190e-01, 1.696090e-01, 1.562600e-01, 1.429100e-01, 1.286959e-01, 1.189586e-01, 1.091817e-01, 9.936521e-02, 8.909992e-02, 7.883422e-02, 7.062198e-02, 6.436264e-02, 5.805321e-02, 5.169611e-02, 4.533901e-02, 3.898201e-02, 3.257081e-02, 2.609201e-02, 1.961311e-02, 1.313480e-02, 6.593752e-03, 4.804826e-05, 0.000000e+00]) - hybi(ilev)float64...
- long_name :
- hybrid B coefficient at layer interfaces
array([0.000000e+00, 0.000000e+00, 0.000000e+00, 0.000000e+00, 0.000000e+00, 0.000000e+00, 0.000000e+00, 0.000000e+00, 0.000000e+00, 0.000000e+00, 0.000000e+00, 0.000000e+00, 0.000000e+00, 0.000000e+00, 0.000000e+00, 0.000000e+00, 0.000000e+00, 0.000000e+00, 0.000000e+00, 0.000000e+00, 0.000000e+00, 0.000000e+00, 0.000000e+00, 0.000000e+00, 0.000000e+00, 8.175413e-09, 6.960025e-03, 2.801004e-02, 6.372006e-02, 1.136021e-01, 1.562241e-01, 2.003501e-01, 2.467411e-01, 2.944031e-01, 3.433811e-01, 3.928911e-01, 4.437402e-01, 4.945902e-01, 5.463042e-01, 5.810415e-01, 6.158184e-01, 6.506349e-01, 6.858999e-01, 7.211660e-01, 7.493782e-01, 7.706375e-01, 7.919469e-01, 8.133039e-01, 8.346609e-01, 8.560180e-01, 8.774290e-01, 8.989080e-01, 9.203870e-01, 9.418650e-01, 9.634060e-01, 9.849520e-01, 1.000000e+00]) - date(time)int32...
- long_name :
- current date (YYYYMMDD)
array([20180201], dtype=int32)
- datesec(time)int32...
- long_name :
- current seconds of current date
array([0], dtype=int32)
- time_bnds(time, nbnd)datetime64[ns]...
- long_name :
- time interval endpoints
array([['2018-01-01T00:00:00.000000000', '2018-02-01T00:00:00.000000000']], dtype='datetime64[ns]') - CO(time, lev, lat, lon)float32...
- mdims :
- 1
- units :
- mol/mol
- long_name :
- CO concentration
- cell_methods :
- time: mean
[3096576 values with dtype=float32]
- PDELDRY(time, lev, lat, lon)float32...
- mdims :
- 1
- units :
- Pa
- long_name :
- Dry pressure difference between levels
- cell_methods :
- time: mean
[3096576 values with dtype=float32]
- PS(time, lat, lon)float32...
- units :
- Pa
- long_name :
- Surface pressure
- cell_methods :
- time: mean
array([[[ 68832.46,  68832.46, ...,  68832.46,  68832.46],
        [ 69867.44,  69843.71, ...,  69915.56,  69891.61],
        ...,
        [102027.04, 102027.11, ..., 102026.87, 102026.95],
        [102149.8 , 102149.8 , ..., 102149.8 , 102149.8 ]]], dtype=float32)
- Conventions :
- CF-1.0
- source :
- CAM
- case :
- fmerra.2.1003.FCSD.f09.qfedcmip.56L.001.branch02
- logname :
- buchholz
- host :
- cheyenne6
- initial_file :
- /glade/p/cesmdata/cseg/inputdata/atm/cam/inic/fv/f.e20.FCSD.f09_f09_mg17.cesm2.1-exp002.001.cam.i.2005-01-01-00000_c180801.nc
- topography_file :
- /glade/p/cesmdata/cseg/inputdata/atm/cam/met/MERRA2/0.9x1.25/fv_0.9x1.25_nc3000_Nsw042_Nrs008_Co060_Fi001_ZR_sgh30_24km_GRNL_MERRA2_c171218.nc
- model_doi_url :
- https://doi.org/10.5065/D67H1H0V
- time_period_freq :
- month_1
- history :
- Thu Jul 9 13:07:01 2020: ncrcat -O -v date,datesec,time,lat,lon,P0,hyam,hybm,hyai,hybi,PS,PDELDRY,CO /glade/scratch/buchholz/archive/fmerra.2.1003.FCSD.f09.qfedcmip.56L.001.branch02/atm/hist/fmerra.2.1003.FCSD.f09.qfedcmip.56L.001.branch02.cam.h0.2018-01.nc /glade/work/buchholz/CAM_chem_output/for_Janyl/CAM_chem_merra2_FCSD_1deg_QFED_monthoutput_201801.nc
- NCO :
- netCDF Operators version 4.7.9 (Homepage = http://nco.sf.net, Code = http://github.com/nco/nco)
Extract the variable of choice at the time and level of choice
[4]:
#extract variable
var_sel = nc_load['CO']
#to see the dimensions and metadata of the variable, uncomment below
#print(var_sel)

#select the surface level and convert to ppbv from vmr
var_srf = var_sel.isel(time=0,lev=55)
var_srf = var_srf*1e09 # 10-9 to ppb
print(var_srf.shape)

#extract grid variables
lat = var_sel.coords['lat']
lon = var_sel.coords['lon']
(192, 288)
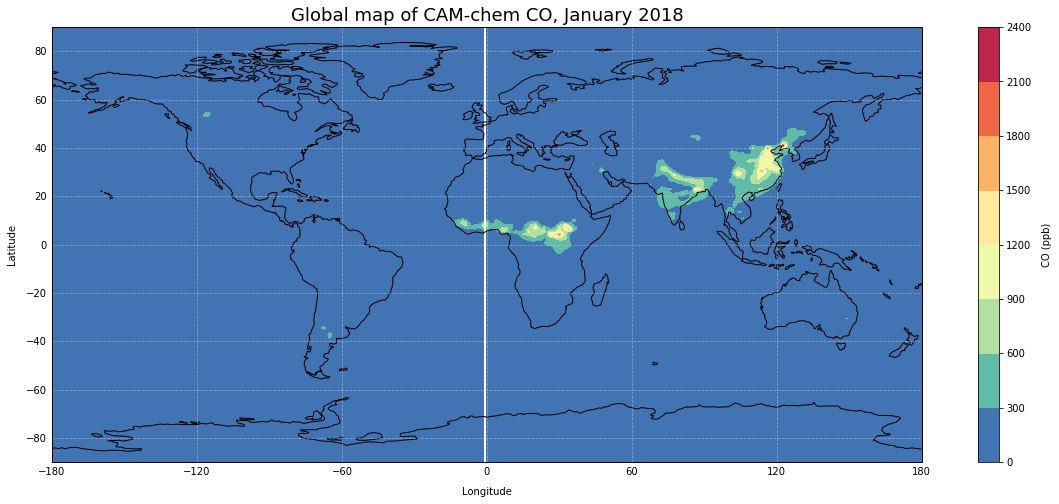
Plot the value over a specific region
[5]:
plt.figure(figsize=(20,8))

#Define projection
ax = plt.axes(projection=ccrs.PlateCarree())

#plot the data
plt.contourf(lon,lat,var_srf,cmap='Spectral_r')

# add coastlines
ax.add_feature(cfeature.COASTLINE)

#add lat lon grids
gl = ax.gridlines(draw_labels=True, color='lightgrey', alpha=0.5, linestyle='--')
gl.xlabels_top = False
gl.ylabels_right = False

# Titles
# Main
plt.title("Global map of CAM-chem CO, January 2018",fontsize=18)

# y-axis
ax.text(-0.04, 0.5, 'Latitude', va='bottom', ha='center',
        rotation='vertical', rotation_mode='anchor',
        transform=ax.transAxes)
# x-axis
ax.text(0.5, -0.08, 'Longitude', va='bottom', ha='center',
        rotation='horizontal', rotation_mode='anchor',
        transform=ax.transAxes)
# legend
ax.text(1.15, 0.5, 'CO (ppb)', va='bottom', ha='center',
        rotation='vertical', rotation_mode='anchor',
        transform=ax.transAxes)

plt.colorbar()
plt.show()
[ ]: