
2D Plots#
Users can generate two-dimensional line lots of their variables using the Plot Utility. Line plots can be done either through two points in space at a s ingle timestep, or through a single point across a timespan.
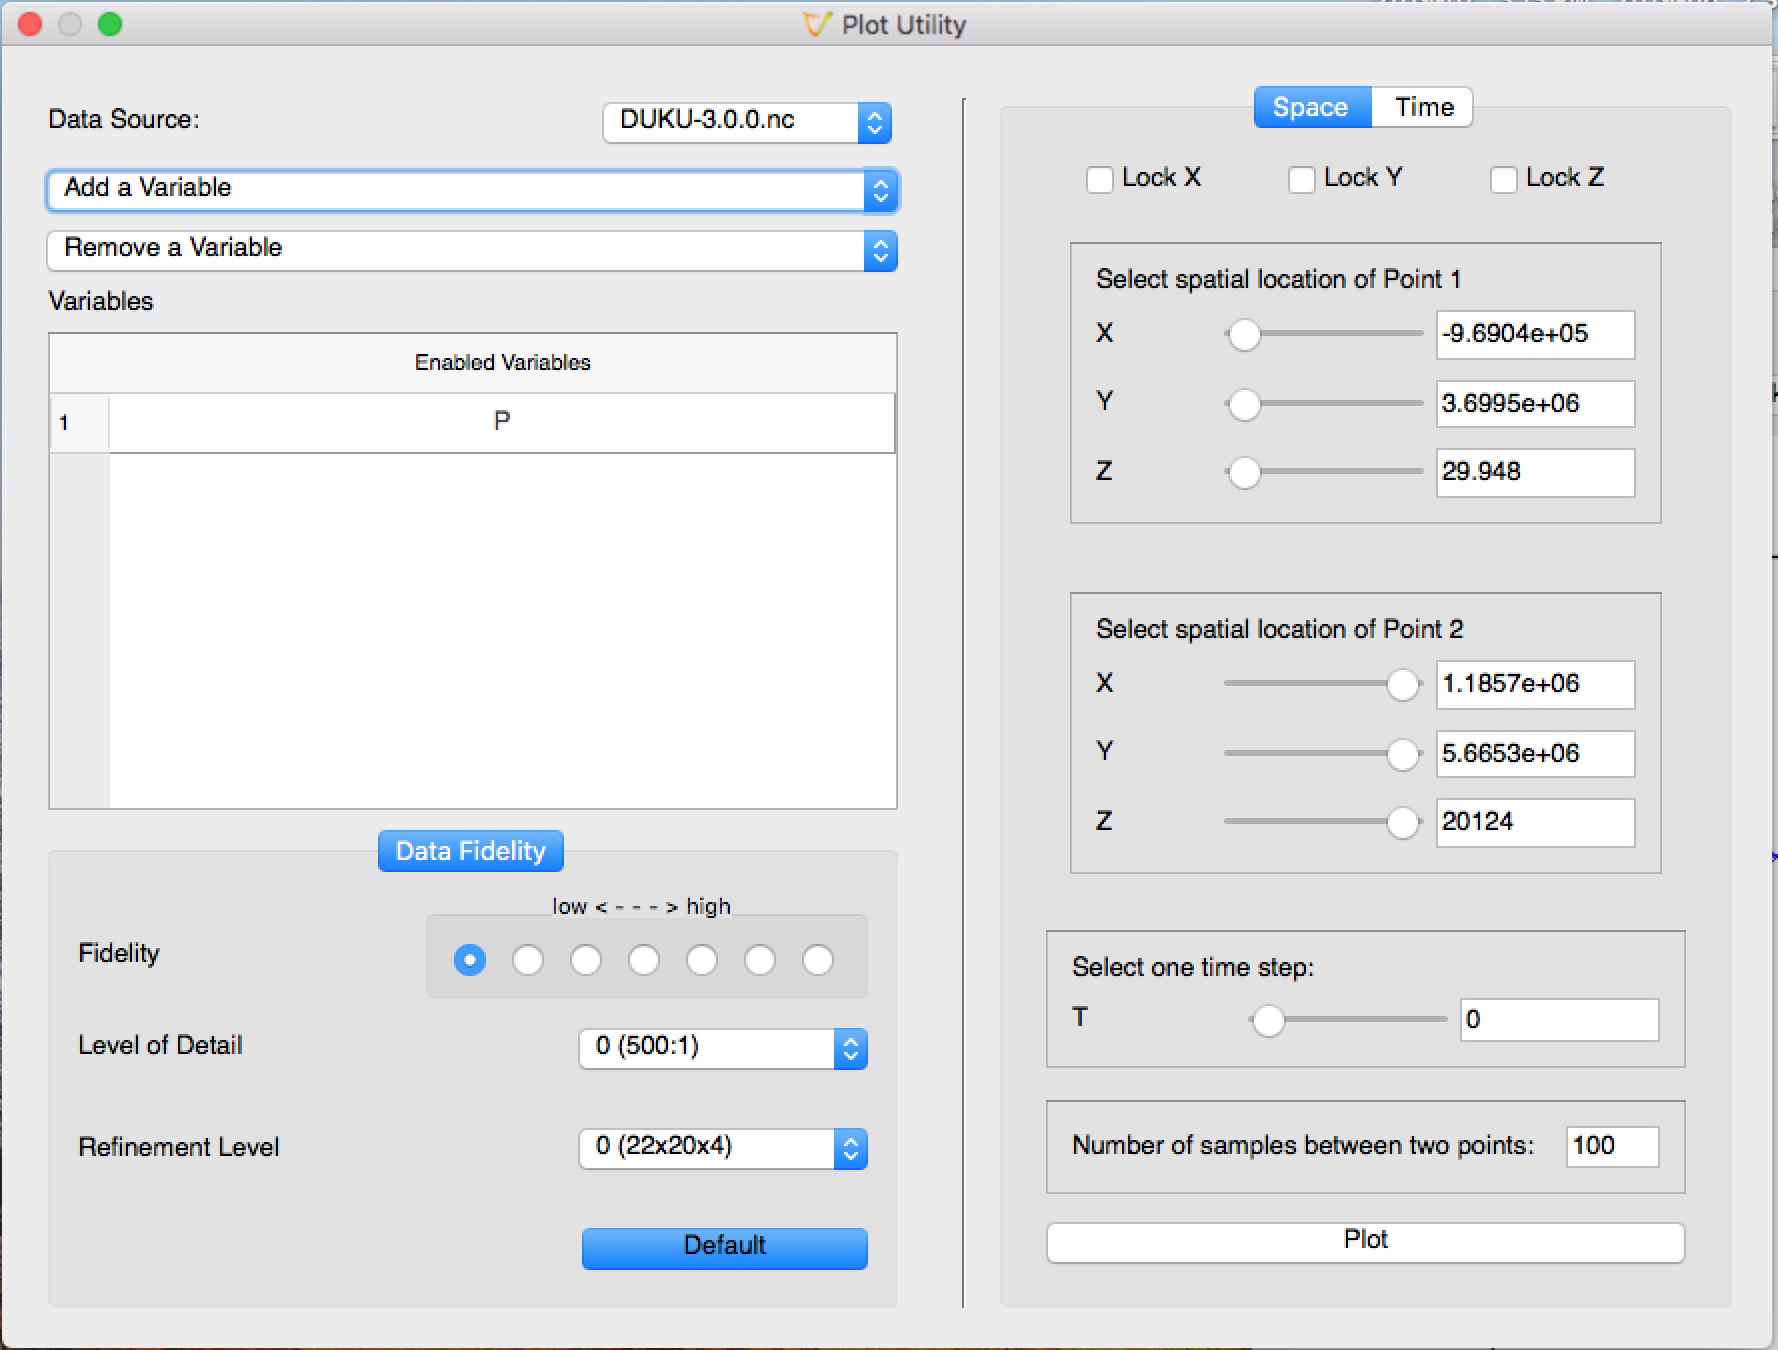
The user interface for hte Plot Utility#
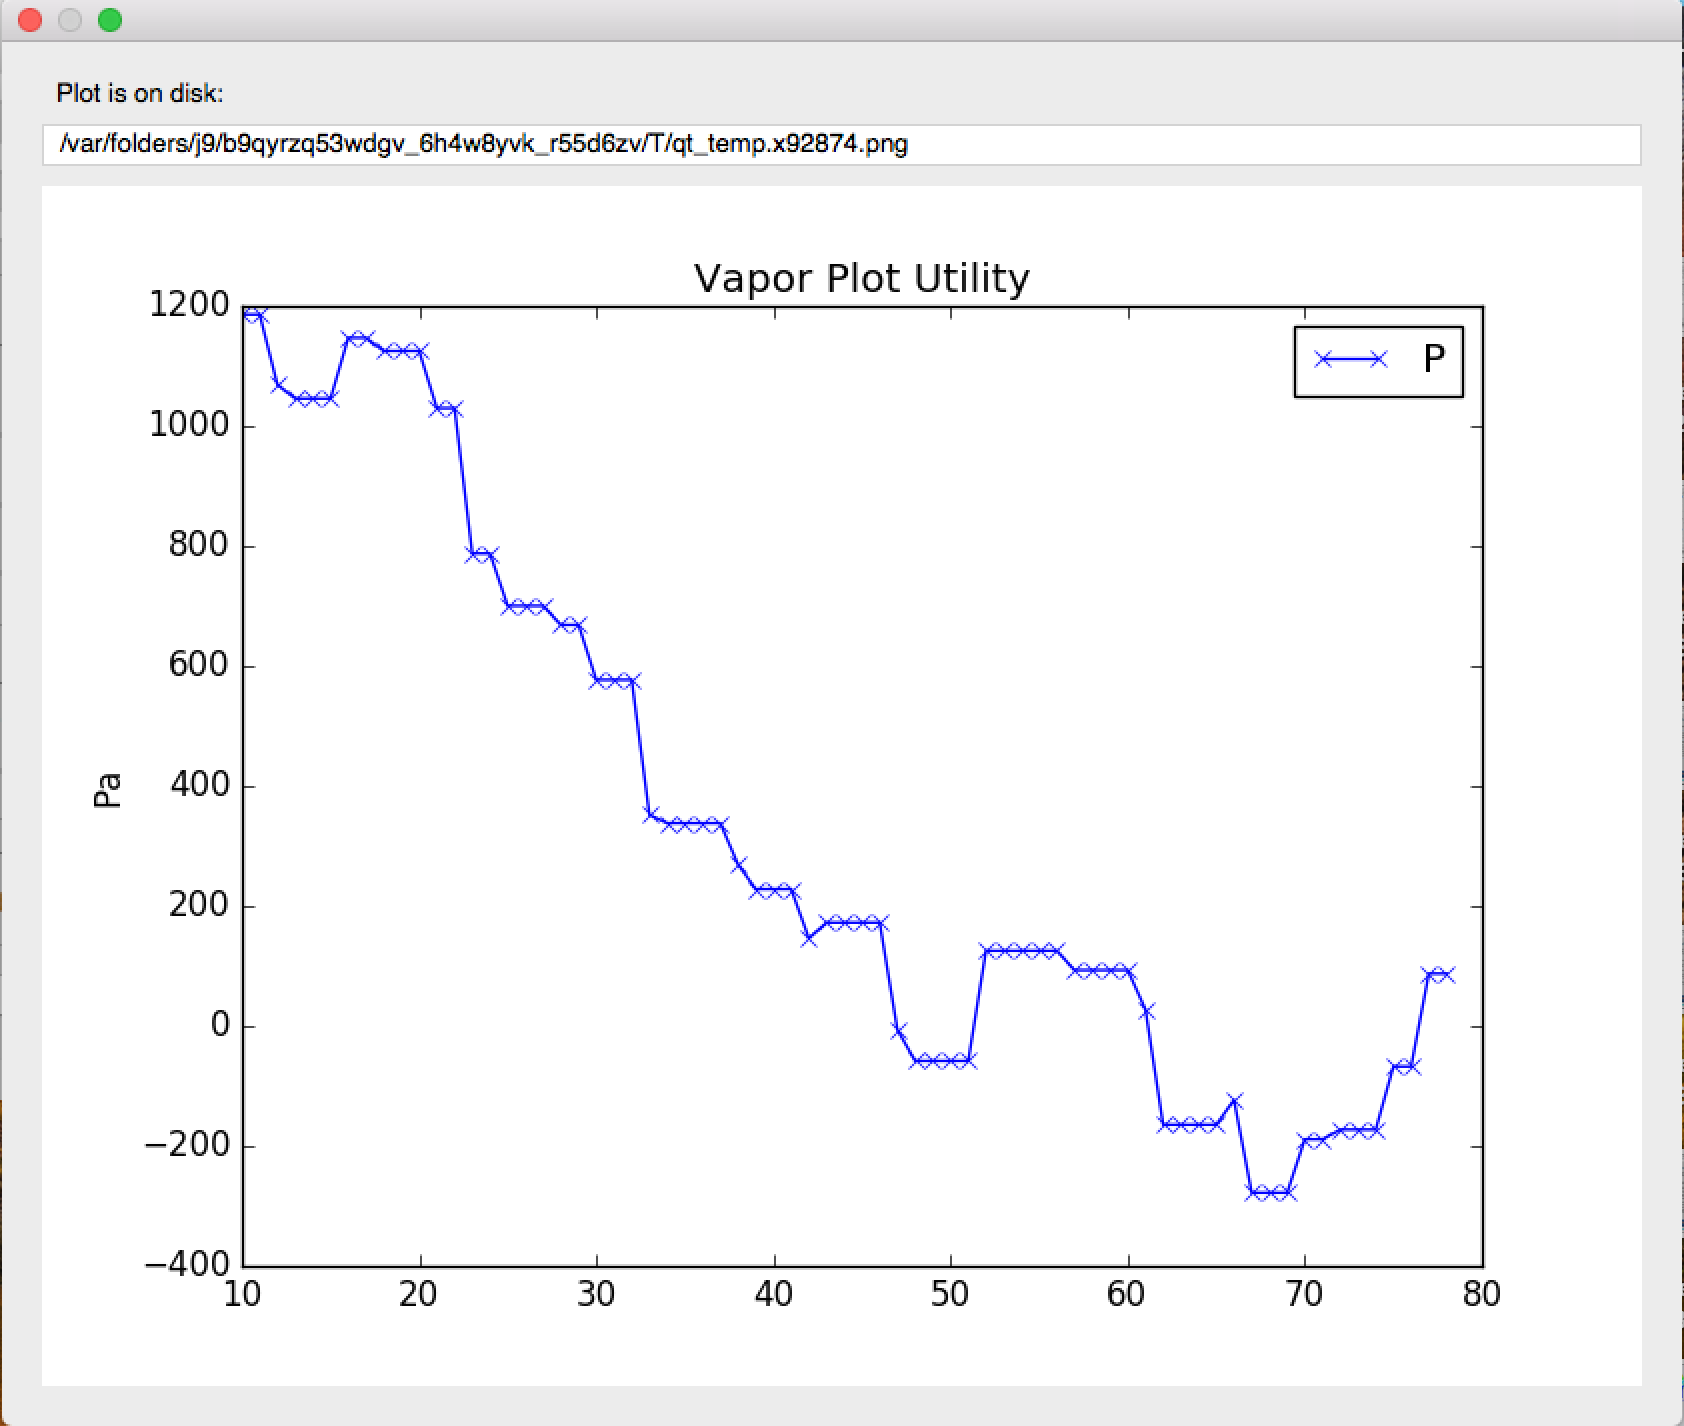
An example of a line plot of Pressure through the spatial domain, at timestep 0#