VAPOR3 Beta currently supports four renderers that all operate on 2D variables. These are the TwoDData, Image, Barb, and Contourrenderers. While the previously linked documentation on these renderers refers to VAPOR2, the same principles apply in VAPOR3; however the properties of these renderers have been rearragned in a new GUI, which is described below. New renderers will become available in future releases, and 3D variables will be gradually supported as well.
To create a new instance of one of these renderers, load a VDC or import a supported dataset (File -> Open VDC, or File -> Import -> [Dataset type]). Then, click the "New" button in the left side of the GUI, select your renderer, and the dataset that it will pertain to.
VAPOR3's new GUI
For consistency, better organization, and code reuse, VAPOR3's Beta release has rearranged the properties of each renderer to fall under one of three tabs.
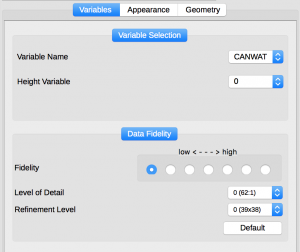
The Variables Tab allows the user to select all parameters relevant to the primary rendered variable, field variables, height variables, and color mapped variables for a given renderer. If VDC data has been loaded, relevant compression parameters are also presented to the user.
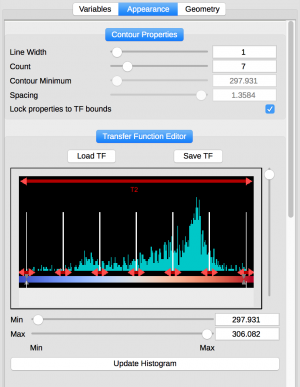
The Appearance tab contains the renderer's Transfer Function, if applicable. Use this to apply color and opacity to your rendering. Secondary parameters that are specific to a given renderer are also kept here, such as the number of barbs to render on each axis. Colorbar annotations are kept here as well.
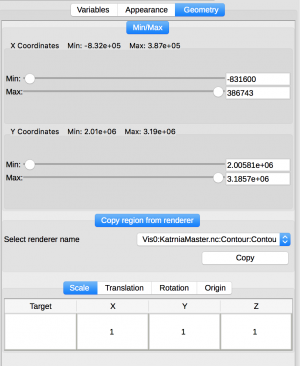
The Geometry tab allows the user to specify the region that the current renderer is drawing to. This region can be reduced to alleviate memory constraints, or to simply highlight an observable feature of interest. Also avalible is a copy-region tool, where regions of different renderers can be copied to one another; and a Transform tool, where users can translate, rotate, and scale their individual renderers.
VAPOR3 supports the visualization of multiple data sets properly registered within the scene with respect to their respective spatial and temporal coordinates. The intended use of this capability is to explore data sets that are related, but may have been produced by different numerical models. For example, a coupled ocean-atmosphere model where each model component (atmosphere and ocean) produces separate outputs. Thus while any combination of datasets may be simultaneously loaded into vapor, this capability is most useful when the datasets overlap in both space and time.
Exploring multiple datasets simultaneously generally requires two steps: