latlon_range=[lat_min, lat_max, lon_min, lon_max] crops the map to a box, and
cbar_kwargs['ticks'] sets the colorbar ticks independently of the contour levels.
x4c.savefig() creates missing directories and trims whitespace on the way out.
import os
import numpy as np
import xarray as xr
import matplotlib.pyplot as plt
import nc_time_axis  # registers the cftime axis converter for matplotlib
import x4c

x4c.set_style('journal')

# after set_style: it resets rcParams from matplotlibrc defaults, which includes the
# backend, so assert the inline backend last or figures are never captured
%matplotlib inline

# The tutorial runs against a reduced copy of a real CESM case. It is published as a
# GitHub Release asset rather than committed, so the first call downloads it into
# ~/.cache/x4c (override with $X4C_CACHE_DIR) and later calls reuse it. Set
# $X4C_SAMPLE_DIR to point at a copy you already have.
case_dir = x4c.fetch_sample_data(case='cesm1', verbose=False)
casename = os.path.basename(case_dir)
print('x4c', x4c.__version__)
x4c 2026.6.11
temp_path = os.path.join(
    case_dir, 'ocn', 'proc', 'tseries', 'month_1',
    f'{casename}.pop.h.TEMP.000101-000112.nc',
)
ds_temp = x4c.open_dataset(temp_path, comp='ocn', grid='g16', vn='TEMP', shift_time=True)
sst = ds_temp.x.da.isel(z_t=0).x.regrid().mean('time')
sst.attrs["long_name"] = "Sea Surface Temperature"
x4c.set_style('journal_spines', font_scale=1.2)
fig, ax = sst.x.plot(
levels=np.linspace(5, 35, 21),
cbar_kwargs={'ticks': np.linspace(5, 35, 7)},
add_gridlines=True,
latlon_range=[-50, 50, 30, 160],
title='Sea-surface temperature (year 1, Indo-Pacific)',
)
x4c.showfig(fig)
x4c.savefig(fig, './figs/SST_ann_regional.pdf')
x4c.set_style('journal') # restore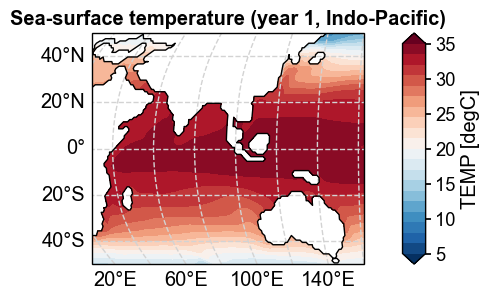
Figure saved at: "figs/SST_ann_regional.pdf"