Posts tagged diagnostics
Correctly Calculating Annual Averages with Xarray
- 19 November 2021
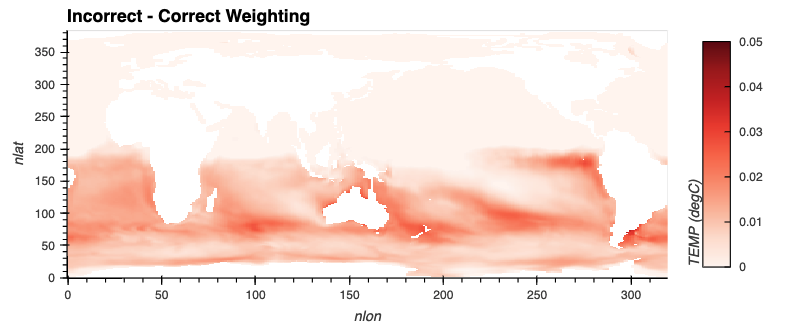
A common component of people’s workflows is calculating annual averages, which helps reduce the frequency of datasets, making them easier to work with. Two of the data frequencies you may be looking to convert to annual include:
Daily (365 days in each year)
Using Intake-ESM's New Derived Variable Functionality
- 22 October 2021
Last week, Anderson Banihirwe added a new feature to intake-esm, enabling users to add “derived variables” to catalogs! This is an exciting addition, and although this has not been included in a release yet, you are welcome to test out the functionality!
Keep in mind that this is an initial prototype and the API is likely to change.
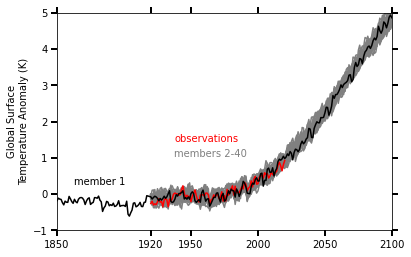
CESM2-Large Ensemble Reproduction of a Figure from Kay et al. 2015 Using Intake-ESM and hvPlot
- 08 October 2021
This Jupyter Notebook demonstrates how one might use the NCAR Community Earth System Model v2 (CESM2) Large Ensemble (CESM2-LE) data hosted on AWS S3. The notebook shows how to reproduce figure 2 from the Kay et al. (2015) paper describing the CESM LENS dataset (doi:10.1175/BAMS-D-13-00255.1), with the LENS2 dataset.
There was a previous notebook which explored this use case, put together by Joe Hamman and Anderson Banihirwe, accessible on the Pangeo Gallery using this link. The specific figure we are replicating is shown below.
Reimagining Diagnostics Through the Use of the Jupyter Ecosystem
- 24 September 2021
Typically, diagnostics packages are written with following structure, using script-based workflows
Read files and do some preprocessing
Regridding High Resolution Observations to a High Resolution Model Grid
- 10 September 2021
In this example, we will cover how to leverage a useful package from the Pangeo Ecosystem, xESMF. One important note when using this package, is make sure you are using the most up-to-date documentation/version, a few years ago, development moved to the pangeo-data branch of the package, installable using the following:
For this example, we will download a file from the World Ocean Atlas, which includes a variety of ocean observations assembled from the World Ocean Database.
Examining Diagnostics Using Intake-ESM and hvPlot
- 20 August 2021
In previous weeks, we have looked at building Intake-ESM catalogs from history files and visualizing CESM output using Holoviews and Datashader, but this week we are putting together a few of those pieces to visualize a comparison between model runs.
One of the first ESDS blog posts looked at building an interactive dashboard to look at plots, using high resolution ocean model output as the dataset. One of the limitations of that approach is that the images are static - we are pulling in pngs, and rending on the page, as opposed to more interactive options. In this example, we will read in data generated from ecgtools, from a directory only accessible via NCAR’s high performance computing center.
CESM Diagnostics Discussion
- 17 June 2021
Every year, NCAR holds the Community Earth System Model (CESM) Workshop which brings together the CESM community to discuss relavant updates from the working groups as well as featured speakers and cross-working group discussions.
During the Software Engineering Working Group (SEWG) session, following a variety of talks, there was an open discussion regarding the current state of CESM diagnostics and future plans for collaboration.
