Monthly precipitation across the contiguous US (CONUS404)
This notebook illustrates how to make diagnostic plots using the CONUS404 dataset hosted on NCAR’s Geoscience Data Exchange (GDEX).
CONUS404 is a 4-km, hourly, 43-year hydroclimate reanalysis of the contiguous United States, produced by NCAR and the USGS by dynamically downscaling ERA5 with the Weather Research and Forecasting (WRF) model in a convection-permitting configuration. The dataset is described in Rasmussen et al. (2023, BAMS).
The native data are hourly NetCDF files — roughly 377,000 files for the
full 1979–2022 record — which would be awkward to stream individually. GDEX
provides a kerchunk reference layer on
top of those NetCDFs that exposes the entire record as a single virtual
xarray.Dataset. With it, we can slice 43 years of 4-km hourly data using a single xarray call and only stream the bytes we actually need.
What this notebook does
Using one calendar year of CONUS404, we produce a 12-panel map of monthly precipitation totals over CONUS. This is a scaled-down version of Figure 3 in Rasmussen et al. (2023), which averages 35 water years to build the published climatology. Here we focus on a single year so the workflow stays tractable and the seasonal march of precipitation across the country is visible in one figure.
# Imports
import intake
import numpy as np
import pandas as pd
import xarray as xr
import seaborn as sns
import matplotlib.pyplot as plt
import os
import shutil
import cartopy.crs as ccrs
import cartopy.feature as cfeature
from matplotlib.colors import BoundaryNorm

# Dask imports
import dask
from dask_jobqueue import PBSCluster
from dask.distributed import Client, LocalCluster# Auto-select the intake-ESM catalog: POSIX where /gdex/data is mounted (NCAR
# HPC, CIRRUS Binder), otherwise the OSDF catalog over the network.
posix_catalog = "/gdex/data/d559000/catalogs/d559000-posix.json"
cat_url = posix_catalog if os.path.exists(posix_catalog) else "https://data.gdex.ucar.edu/d559000/catalogs/d559000-osdf.json"
print(cat_url)https://data.gdex.ucar.edu/d559000/catalogs/d559000-https.json
# Set up your scratch folder path
username       = os.environ["USER"]
glade_scratch  = "/glade/derecho/scratch/" + username
print(glade_scratch)
/glade/derecho/scratch/harshah
Create a PBS cluster
def get_pbs_cluster(n_workers=12):
    """PBSCluster on NCAR HPC (Casper/Derecho)."""
    scratch = f"/glade/derecho/scratch/{os.environ.get('USER', '')}"
    cluster = PBSCluster(
        job_name        = "conus404-precip",
        cores           = 1,
        memory          = "4GiB",
        processes       = 1,
        local_directory = f"{scratch}/dask/spill/",
        log_directory   = f"{scratch}/dask/logs/",
        resource_spec   = "select=1:ncpus=1:mem=4GB",
        queue           = "casper",
        walltime        = "1:00:00",
        interface       = "ext",
    )
    cluster.scale(n_workers)
    return cluster


def get_local_cluster():
    """LocalCluster for a laptop or a CIRRUS Binder pod (no PBS scheduler)."""
return LocalCluster()# Auto-detect the environment: a `qsub` on PATH means a PBS scheduler is present
# (Casper/Derecho) -> PBSCluster; otherwise fall back to LocalCluster (CIRRUS
# Binder or a laptop). No editing needed to move between environments.
on_hpc = bool(shutil.which("qsub"))
cluster = get_pbs_cluster() if on_hpc else get_local_cluster()
client = Client(cluster)
if on_hpc:
client.wait_for_workers(n_workers=12)
print(f"Detected {'NCAR HPC -> PBSCluster' if on_hpc else 'no PBS -> LocalCluster'}")
clusterLoad CONUS 404 data from GDEX using an intake catalog
col = intake.open_esm_datastore(cat_url)
colcol.df turns the catalog object into a pandas dataframe!
(Actually, it accesses the dataframe attribute of the catalog)
Select data and plot
What if you don’t know the variable names ?
Use pandas logic to print out the short_name and long_name
col.df[['variable','long_name']]Find the precipitation variable in the catalog
CONUS404 WRF output stores grid-scale accumulated precipitation per hourly
output step as PREC_ACC_NC (units: mm). Because the output step is hourly,
this is also the hourly precipitation rate in mm hr⁻¹.
# Sanity check — list precip-like variables present in the catalog
precip_like = col.df[col.df["variable"].str.contains("PREC|RAIN", case=False, na=False)]
precip_like[["variable", "long_name"]].drop_duplicates()# Search the catalog for our variable of interest and inspect the paths.
cat_pr = col.search(variable="PREC_ACC_NC")
kerchunk_url = cat_pr.df["path"].iloc[0]
print('kerchunk url is :', kerchunk_url)kerchunk url is : https://data.gdex.ucar.edu/d559000/kerchunk/wrf2d-remote-https.parq
Choosing how to access CONUS404
CONUS404 is published as hourly NetCDF files — one file per hour, roughly 377,000 files for the full 1979–2022 record. Streaming hundreds of thousands of small files over the network would be slow and brittle.
GDEX adds a kerchunk reference layer
on top of those NetCDFs. A kerchunk reference is a small parquet file that
tells xarray which byte range of which NetCDF holds each chunk. From the
reader’s perspective it looks like a single virtual xarray.Dataset, and you
only stream the bytes you actually request.
GDEX publishes two such references for CONUS404, aggregating across all water years and all variables in each group:
| File | Coverage |
|---|---|
wrf2d | All 2D variables — precipitation, 2-m temperature, surface energy fluxes, snow water equivalent, … |
wrf3d | All 3D variables — temperature, humidity, wind on model levels |
We want hourly precipitation (PREC_ACC_NC), which is a 2D variable, so we
pick the wrf2d reference from the catalog paths returned in the previous
cell and open it with xarray’s kerchunk engine. The result is the full
43-year hourly record of every 2D variable in a single Dataset — ready to
slice with .sel(Time=...).
Load data into xarray
%%time
# One kerchunk reference → 43 years of hourly 2D output.
# First open is slow (~15 s) because kerchunk parses the parquet index; subsequent slicing is fast and lazy.
ds = xr.open_dataset(kerchunk_url, engine="kerchunk")

pr    = ds["PREC_ACC_NC"]          # (Time: 376944, south_north: 1015, west_east: 1367)
lat2d = ds["XLAT"].isel(Time=0)    # 2D static lat/lon for plotting + masking
lon2d = ds["XLONG"].isel(Time=0)
pr
CPU times: user 10.8 s, sys: 1.45 s, total: 12.3 s
Wall time: 13.5 s
Data Analysis
Part A: Monthly precipitation climatology
We sum hourly precipitation to monthly totals over WY 2020 and lay them out as a 12-panel map. This is one water year — Fig. 3 of Rasmussen et al. (2023) averages 35 water years. To reproduce the published climatology, loop this reduction over water years 1986–2020 and average.
%%time
# Slice to calendar year 2020 — xarray accepts partial date strings.
pr_2020 = pr.sel(Time="2020")

# Monthly totals — 12 groups over an already-in-cluster array.
pr_monthly = pr_2020.groupby("Time.month").sum()
pr_monthly
CPU times: user 1.71 s, sys: 61.6 ms, total: 1.77 s
Wall time: 1.76 s
Compute the monthly totals and plot
The next cell triggers the reduction: streaming hourly precipitation chunks from GDEX for all of 2020 and summing into 12 monthly grids.
%%time
# Materialize once: 12 × 1015 × 1367 float32 ≈ 65 MB, fits comfortably.
pr_monthly_local = pr_monthly.compute()

# Cartopy projections: CONUS404 sits on a Lambert Conformal grid.
proj  = ccrs.LambertConformal(central_longitude=-97.5, central_latitude=38.5)
trans = ccrs.PlateCarree()
CPU times: user 2min 32s, sys: 6.83 s, total: 2min 39s
Wall time: 10min 42s
%%time
import calendar
from matplotlib.colors import ListedColormap, BoundaryNorm

# Colormap matched to Rasmussen et al. (2023) Fig. 4(a): NCL precip3_16lev (RGB 0–255)
_rgb255 = [
    (255,255,255), (214,226,255), (181,201,255), (142,178,255),
    (127,150,255), (114,133,248), ( 99,112,248), (  0,158, 30),
    ( 60,188, 61), (179,209,110), (185,249,110), (255,249, 19),
    (255,163,  9), (229,  0,  0), (189,  0, 31), (165,  0, 33),
]
cmap_pr = ListedColormap(np.array(_rgb255) / 255, name="precip3_16lev")
levels  = np.arange(0, 301, 20)                       # 0, 20, …, 300 mm
norm    = BoundaryNorm(levels, ncolors=cmap_pr.N, extend="max")

# Coarsen by 4× for plotting only (~16× fewer cells; saves cartopy memory)
COARSEN  = 4
pr_plot  = pr_monthly_local.coarsen(south_north=COARSEN, west_east=COARSEN, boundary="trim").mean()
lat_plot = lat2d.coarsen(south_north=COARSEN, west_east=COARSEN, boundary="trim").mean()
lon_plot = lon2d.coarsen(south_north=COARSEN, west_east=COARSEN, boundary="trim").mean()

fig, axes = plt.subplots(
    3, 4, figsize=(16, 9),
    subplot_kw={"projection": proj},
    constrained_layout=True,
)

for i, ax in enumerate(axes.flat):
    month_int = int(pr_plot.month.values[i])
    im = ax.pcolormesh(
        lon_plot.values, lat_plot.values, pr_plot.isel(month=i).values,
        transform=trans, cmap=cmap_pr, norm=norm, shading="auto",
    )
    ax.add_feature(cfeature.COASTLINE, lw=0.4)
    ax.add_feature(cfeature.BORDERS, lw=0.4)
    ax.add_feature(cfeature.STATES, lw=0.2)
    ax.set_extent([-125, -66, 24, 50], crs=trans)
    ax.set_title(calendar.month_name[month_int], fontsize=10)

cbar = fig.colorbar(
    im, ax=axes, shrink=0.7, orientation="vertical",
    ticks=levels, extend="max",
    label="Monthly precipitation (mm)",
)
fig.suptitle("CONUS404 monthly precipitation — Calendar Year 2020", fontsize=14)
plt.show()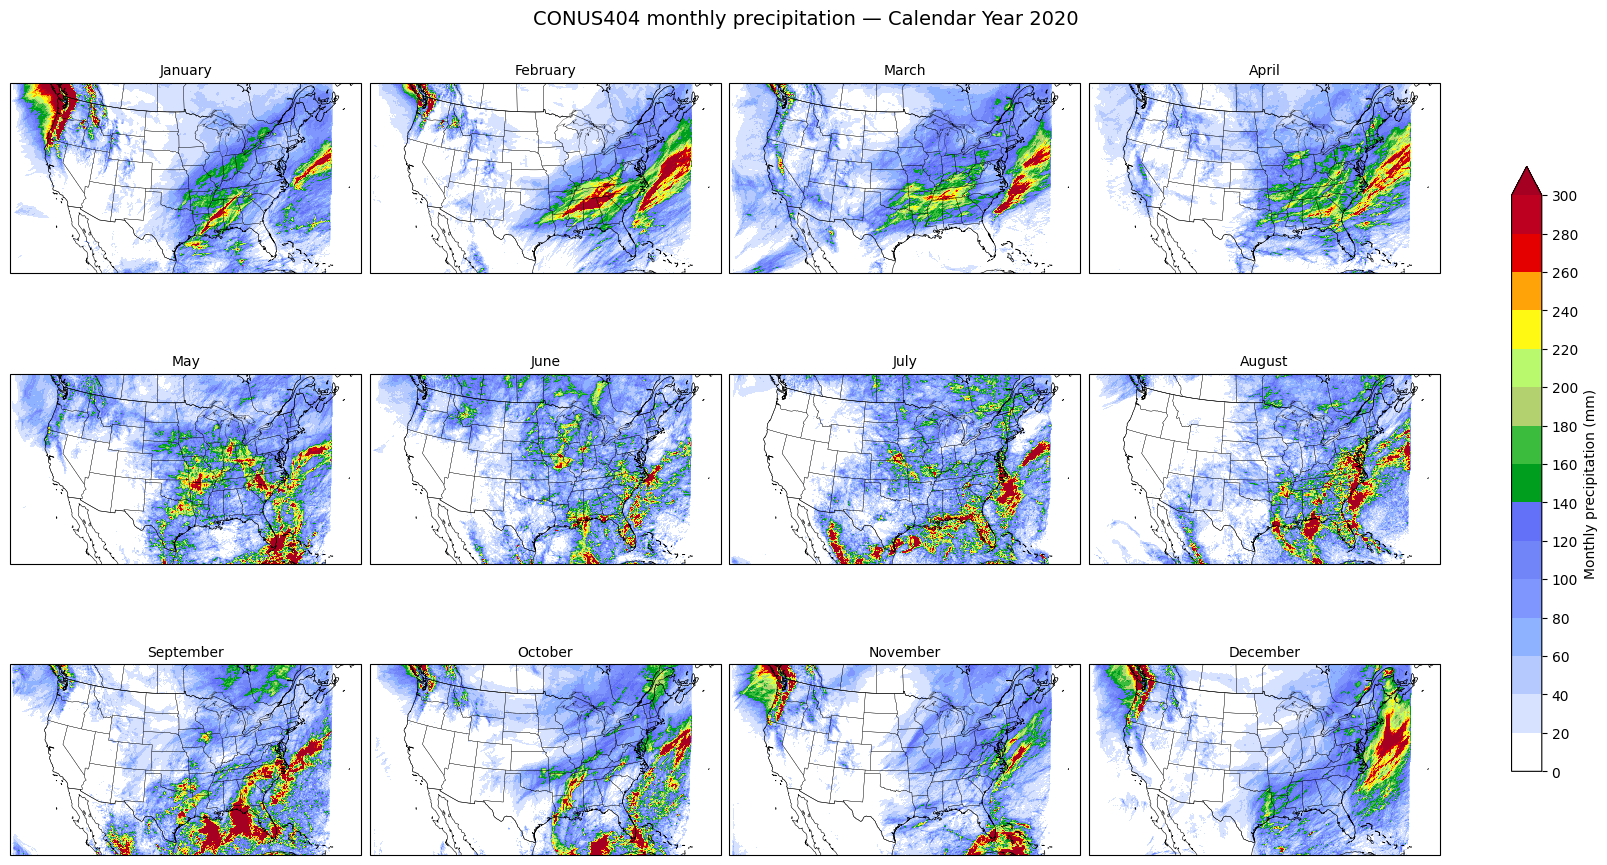
CPU times: user 28.1 s, sys: 1.2 s, total: 29.4 s
Wall time: 1min 1s
cluster.close()