Vapor’s Plot Utility provides a way for users to quickly and easily find trends in their data through either space or time. Multiple variables can be compared to one another through these plots; and the plots can be generated at either native or compressed fidelity, depending on the makeup of their VDC. If data is directly imported into Vapor, only native fidelity is available. This tool can be run under the Data->Plot Utility menu.
Users can further customize their generated plots by making a copy of an installed script called plot1D.py, located within their installed directory (<installed_dir>/share/python/plot1D.py). Move your own copy into your home directory, and prefix it with a '.', and Vapor will use that script instead of the packaged one. You can make any modificaiton you'd like to from there. This script utilizes the matplotlib library (http://matplotlib.org/).
The following diagrams outline the controls of the Plot Utility.
.png)
Dependent Variable Controls - This section of the GUI allows users to select which variables will be plotted across either space or time. After selecting a variable from the “Add Variable” combo box, it may be enabled (default), disabled, or removed from the list entirely.
Fidelity Controls - If the currently loaded data is a VDC that utilizes Vapor’s compression schema, the user may select the the Refinement and Level of Detail criteria on which the plot will be generated.
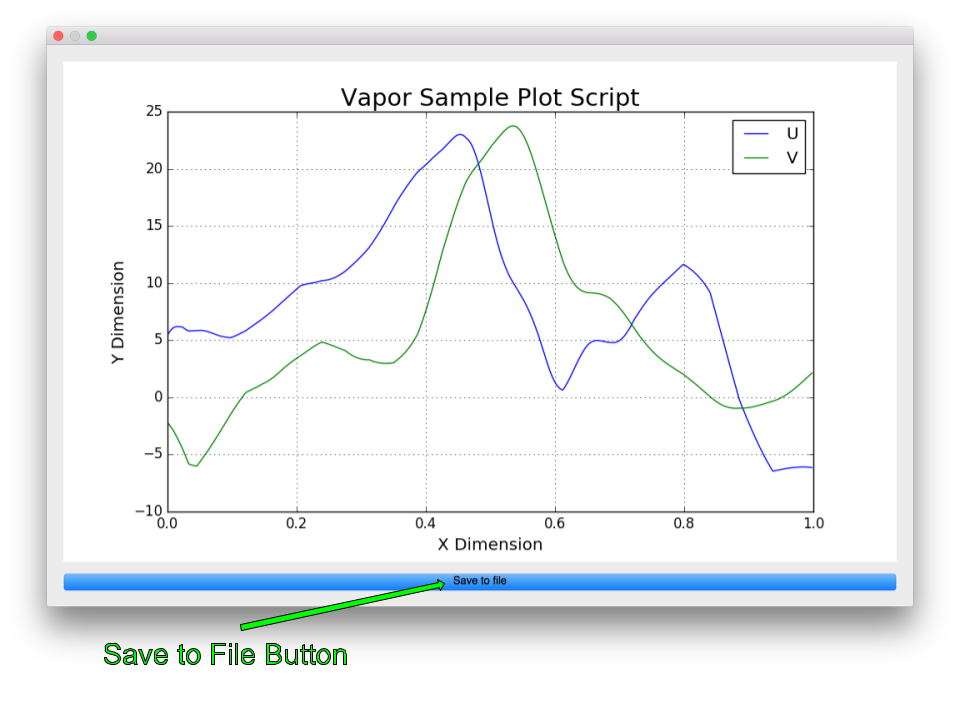
Plot Button - This executes the generation of a plot according to the parameters set by the user. It will appear in a new window, with the option to save the image to disk.
Space/Time Selector - These two tabs control whether the plot will be generated through space, or through time. Spatial plots sample the data between two points at a single timestep. Temporal plots sample space at a single point, through multiple timesteps.
Selected Coordinate Display - A matrix that displays the user’s currently selected spatial and temporal coordinates to plot. The rightmost column contains a “Const” checkbox, which will keep coordinates constant on whatever axis has it enabled. By default, the X, Y, and Z axes are “Const” when plotting through time. Similarly, the Time axis is “Const” when plotting through space.
Temporal Coordinate Selector - Used to select the time(s) that data will be sampled from. If the user is plotting across time, they will be able to select a range of timesteps to sample. If plotting across space, they will be able to select a single timestep.
Spatial Coordinate Selector - Used to select the point(s) that data will be sampled from. If the user is plotting across space, they will be able to select two points to sample between. If plotting across time, they will be able to select a single point that will be plotted across their designated time range. Additionally, users have the option to copy a selected point from an enabled renderer if that point is of particular interest.
Save to File Button - After a user has generated a plot of their specified variables, they have the option to save the plot to disk for later use.