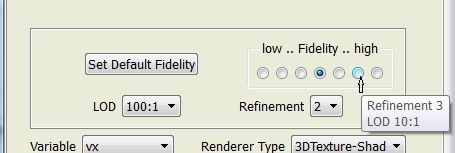
In each of the VAPOR GUI renderer tabs there is a selector for Data Fidelity, Refinement level and a selector for LOD (level of detail). These selectors are in a box near the top of each renderer tab, just below the Renderer Control, such as in the portion of the DVR tab illustrated below:

The Data Fidelity selection is a single quality setting that sets both Refinement level and Compression level, and is intended to provide users with a simple way to control the quality of the visualization. Holding the mouse over any of the radio buttons in the Data Fidelity control will result in a tool-tip that indicates the Refinement and LOD levels that will be set if that button is clicked. Note in the above illustration a cursor arrow indicates that the mouse is placed over one of the Fidelity radio buttons, resulting in a tooltip indicating Refinement 3 and LOD 10:1.
The default Fidelity setting is based on the size of the data being visualized, and is initially intended to facilitate interactivity: Loading a very large data set will initially use very low Fidelity settings; a large dataset will initially use high Fidelity. Users can control the default setting, selecting a default Fidelity level while visualizing one data set, by clicking on the "Set Default Fidelity" button. If that setting is saved (in the user preferences file), then loading other data sets of similar size from the same computer will result in a similar default Fidelity setting.
Users may bypass the Fidelity setting by just clicking on either the LOD or refinement selectors, and the Fidelity setting will be ignored until the user again clicks on a Fidelity radio button.
LOD and refinement selectors affect both the size of the data that will be read from disk, and the size of the volume that it will occupy in memory. After a new dataset has been loaded, these selectors can be set to any of the valid choices that are available in the current dataset.
The LOD selector will indicate the available compression ratios, which typically can go from 500:1 to 1:1. If the data is VDC type I, there is no compression, so only 1:1 will be available, and the Fidelity control will only affect the Refinement level.
For both VDC type 1 and 2 data the refinement level controls the size of the data in memory. For VDC type 1 data it also affects the amount of I/O required to load that data. The data can be visualized at its full (original) size, or it can be reduced by powers of two in each dimension. At the highest refinement level, the data is loaded in its original size. At the lowest refinement level, 0, the data is reduced by a factor of factor of 2N on each side, where N is the highest refinement level. Refinement level 1 is reduced by 2N-1, level 2 is reduced by 2N-2, etc.
For effective visualization of VDC I data, the refinement level directly controls the amount of I/O required. The user must consider the tradeoffs of visualization time and accuracy and weight this against the size of the region being displayed. Preliminary visualization can be performed on large volumes at the lowest refinement level, or on smaller subregions at higher refinement level. The time to render will increase as the refinement level or the region size is increased, primarily because of the I/O required to load the data.
When visualizing VDC type II data, the LOD can be used to limit the amount of I/O, and will directly affect the time needed to read the data from disk, while also reducing the visualization accuracy. Regardless of the LOD chosen, the refinement level will determine how much memory space will be occupied by the data, so the refinement level must be kept low enough to ensure that the data does not exceed the available memory.
The refinement level controls the amount of data that is sent to the renderer whenever it is displayed, so there is no value in choosing a refinement level that results in higher resolution than the pixels resolution of the display, and doing so will make the rendering slow. For example, if the display resolution is 1024x1024, then when visualizing a full 4Kx4Kx4K grid of data, one should always use a refinement level at least two levels below the maximum.
The refinement level can affect the vertical extents of the data (especially with layered and stretched grids). When displaying a low refinement level, the highest vertical layers of the data will not be shown in the visualization.