Chapter 3: Characterize baseline quantities of interest, uncertainties
This Chapter provides an overview and guidance on the following topics:
Observation-based water-cycle datasets for North America and their strengths and weaknesses
Table of Contents
Key takeaways from the chapter
Introduction
Observational datasets and their strengths and weaknesses
References
Attribution
Much of the material and images used in this chapter are derived from the following MetEd Lessons: Understanding the Hydrologic Cycle; Precipitation Estimates, Part 1: Measurement; Precipitation Estimates, Part 2: Analysis. The source of this material is the COMET® Website at http://meted.ucar.edu/ of the University Corporation for Atmospheric Research (UCAR), sponsored in part through cooperative agreement(s) with the National Oceanic and Atmospheric Administration (NOAA), U.S. Department of Commerce (DOC). ©1997-2024 University Corporation for Atmospheric Research. All Rights Reserved.
Chapter 3 Key Takeaways
We need observational datasets to:
Understand the natural variability of the system of interest
Provide a baseline reference useful for future model projections in:
Removing biases
Downscaling
Making the results physically-realistic (e.g.incorporating temporal and spatial sequencing)
When assessing observational datasets it is important to consider their spatial, temporal and distributional climate-data characteristics as this will impact their ability to capture local-impact phenomena.
An alternative to strictly observational-based datasets are climate reanalyses which is often used to reconstruct past climate conditions by combining historical observational data with modern climate models.
As a general rule of thumb, datasets are more useful if they:
Provide estimates of their uncertainty
Are derived from multiple data sets, sensors, algorithms, since their errors can partially cancel, making them more robust
For climate change analyses, data sets that accurately capture the distributional characteristics of the system under study are more important than those that capture specific historic events and their sequencing in time and space
3.1 Introduction
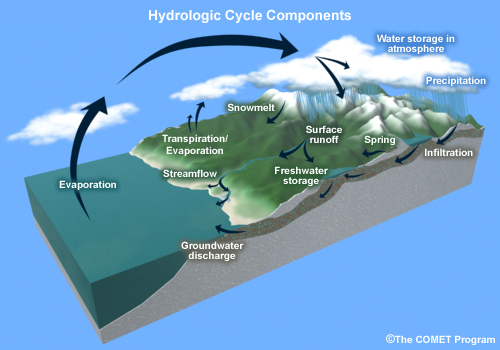
In any study on future impacts of climate change, it is essential to first characterize and quantify the baseline or starting point of the study area of interest, which includes understanding the natural variability of the water system being studied, independent of anthropogenic impacts (e.g. due to, say, changes in radiative forcing due to changes in CO2 emissions, land-use changes, etc.). In addition, when using future numerical-based climate modeling outputs, some form of bias correction using local observations is also essential for making the results physically-relevant, as well as making the climate model outputs applicable as inputs into local impact models. This chapter discusses observational data sources that would be relevant for both of these topics. Note that our coverage of climate variables in this primer is primarily on the atmospheric “flux” terms into and out of the surface (see figure below) of the hydrologic cycle components: precipitation and the climate variables that impact evapotranspiration (temperature, solar insolation, long wave radiation, wind speed, relative humidity); this is in contrast to those variables that are subsurface variables, and those that are more “point-based” and diagnosed through local impact model research (e.g. streamflow, sediment transport, storage, etc.).
The components of the hydrologic cycle
3.2 Observational datasets and their uncertainties
Climate-sensitive terrestrial water-related research and impact studies can take many forms, often examining very specific, localized phenomena (e.g.,climate impacts on seasonal lake mixing). The intent of this section is to offer guidance on data sources of larger spatial-scale atmospheric flux terms that can provide what are termed hydrologic cycle “forcings” to more localized impact models, divided in the context of this chapter into precipitation and components of evapotranspiration. In this section, we begin by discussing the theoretical ideal for obtaining a “localized,” dense observational dataset, along with practical needs and considerations. We follow this with a discussion of considerations for supplementing these datasets with larger spatial-scale and longer temporal-scale datasets, concluding this section by providing links to useful observational datasets and resources.
Before we begin this discussion, it is helpful to keep some questions in mind related to the spatial, temporal, and distributional climate-data attributes required to capture the local-impact phenomena being studied, and when assessing the adequacy of observational datasets.
Is the phenomenon highly variable in space such that only localized sampling is sufficient (e.g.,often occurring in regions of strong topographical gradients)?
Is the phenomenon more likely related to specific weather events or year-by-year changes in climate averages?
Are temporal averages of the variables sufficient (e.g., monthly, daily, hourly, etc.) and/or is the phenomenon critically dependent on extremes in intensity, frequency, and duration?
If extremes are the primary focus, are there historical records long enough to capture these extremes at sufficient temporal/spatial resolution to drive local impact models?
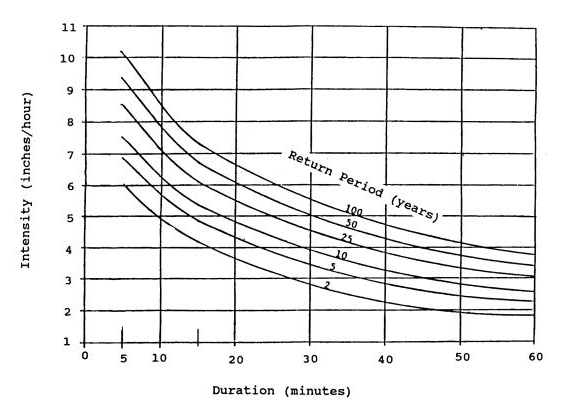
Figure: one of the most monitored attributes of local rainfall are changes in its Intensity-Duration-Frequency (IDF) relationship.
These questions often highlight the need for datasets developed from a combination of different data sources and meteorological tools and approaches to ensure a comprehensive understanding of the weather and climatological conditions of interest, which we talk about next.
3.2.1 Ideal local datasets.
Arguably the ideal data for researchers who are interested in obtaining variables and datasets that can then provide or force detailed and localized ecosystem and impact models (e.g., storage, surface water flows, stream temperatures, etc.) would be to have gauge-derived instrumented measurements of all climate variables of interest at high enough density, sampling frequency, and historical record to capture all dominant scales of spatial and temporal heterogeneity across the study domain of interest, which are more often than not, unattainable. In this context, weather gauges are often considered the best source of truthful weather information for several reasons. Accuracy and precision: if properly calibrated and maintained, weather gauges provide accurate and precise measurements of temperature, precipitation, wind speed, humidity; fluxes of energy, momentum, and moisture; and long- and shortwave radiation. Direct measurement: Unlike other methods that might rely on indirect indicators or modeled inputs, weather gauges collect direct, empirical data from the environment. Localized information: These instruments provide data specific to their location, particularly useful for research purposes where understanding microclimates or specific local phenomena is crucial. Extremes: As opposed to other measurement techniques and approaches that often implicitly represent spatial or temporal averages, gauges are point-based in nature, allowing them to capture the widest range of temporal and spatial variability, given sufficient spatial and temporal resolution. Long-term data collection, standardization and calibration: Many gauging approaches have remained consistent for many decades (or can be easily cross-compared to modernized techniques), along with universally accepted and consistent standardization and calibration approaches, means weather gauges are often resource for long-term archives of meteorological data, essential for studying climate change, weather patterns, and long-term trends. Sufficient for climatologies: even if sparsely-located gauges may be insufficient to represent a time-series of weather across a region, they may be sufficient to represent the long-term climatology if the region is largely homogenous in its weather patterns (note: a weather climatology refers to the statistical representation of the long-term weather conditions at a particular location or over a specific region, typically involving the analysis of weather data over extended periods, typically 30 years or more, to understand the typical weather patterns and variations of an area).
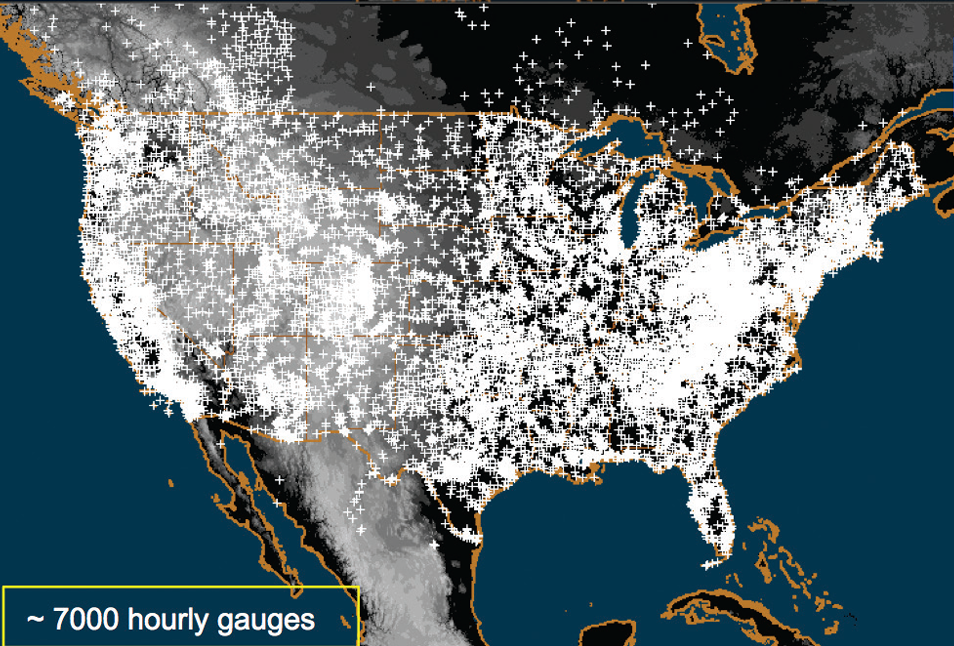
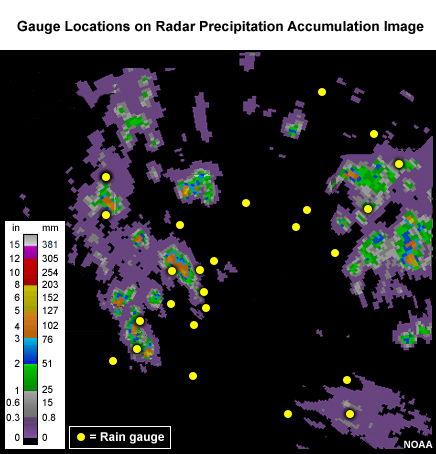
However, weather gauges also have certain drawbacks. Representativeness: Point observations are rarely sufficient to represent spatial patterns of precipitation; this is especially true in regions with sharp changes in elevation and/or nearby large bodies of water. Wind and turbulence-dependent errors for precipitation gauges: The wind over and around raised gauges can distort the measurement of the flux of hydrometeors falling to the ground. Typically, the higher the wind speed, the higher the distortion. Susceptibility to local interferences: Weather gauges can be affected by local environmental factors such as buildings, trees, and other obstructions that can alter wind patterns or create microclimates. This can lead to data that may not accurately represent broader weather conditions. Maintenance and calibration needs: These instruments require regular maintenance and calibration to ensure accuracy. This can lead to data gaps that degrade the reliability of any dataset based on consistent measurements. Ideally, quality-control records would be kept and available for quality confirmation. Limited range: A single weather gauge provides data only for its immediate location. While this is also considered a strength, it does require siting of multiple gauges to obtain a comprehensive view of weather over a larger area, if required. See figure below of the density of rain gauges used for observation quality control of the U.S. National Centers for Environmental Prediction Multi-Radar Multi-Sensor (MRMS) system (Zhang et al., 2016).
Figure: the MRMS locations of rain gauge sites, with the white plus signs indicating locations of the ~7000 hourly gauges. (Source: Zhang et al., 2016)
Even where these local data may not in and of themselves be sufficient to cover project needs and provide a sufficient observational baseline, they can still provide an important (local) evaluation of the supplemental (larger scale) datasets that are being used.
Further resources
Further information on the strengths and limitations of snow measurements can be found under (“How Well Are We Measuring Snow Post-SPICE?”, Kochendorfer et al., 2022) https://doi.org/10.1175/BAMS-D-20-0228.1.
Also more detailed information on the estimation of precipitation and the strengths and deficiencies of rain gauges is found in the following pop-out:
Rain gauge QPE
As long as humans have kept weather records, there has been a need to capture precipitation in some sort of collection device.
Today’s precipitation gauges, hereafter referred to as rain gauges, are the current version of those collection devices.
Rain gauges come in a variety of styles, both manual and automated…
and are used to measure rain as well as the liquid equivalent of frozen precipitation.
In this section we will discuss the reality of the term “ground truth.” By doing so, we will discuss the impact on gauge measurement, or “gauge catch,” from wind, the physical characteristics and location of the gauge, and the characteristics of the precipitation. We will offer some perspective on these issues with respect to whether the gauge is automated or manual.
Rain Gauge QPE » Are they really ground truth?
Often referred to as “ground truth,” rain gauges are subject to errors from a variety of sources. Although gauges often provide excellent point measurements, at times the error in those measurements can be quite large. Sources of error include the construction and exposure of the gauge itself, the characteristics of the precipitation, and the weather conditions.
Even a perfectly accurate rain-gauge network, if such a thing exists, may not be representative of the areal variations in the precipitation accumulation. Because they are point measurements, gauges are only representative of the immediate vicinity where they are located.
Rain Gauge QPE » Exercise: Gauges, Wind, and Fall Angle
In still air the hydrometeors that make up precipitation fall vertically downward to the gauge.
Wind causes precipitation to fall at an angle with respect to the vertical. In addition, the gauge itself presents an obstacle to the flow. This results in altered wind patterns near the gauge.
The effects of the wind will vary depending on hydrometeor phase and size.
No wind: precipitation falls vertically downward
Wind causes precipitation to fall at an angle
Wind causes altered wind patterns near gauge
Wind effects vary with hydrometeor phase and size
Download Video
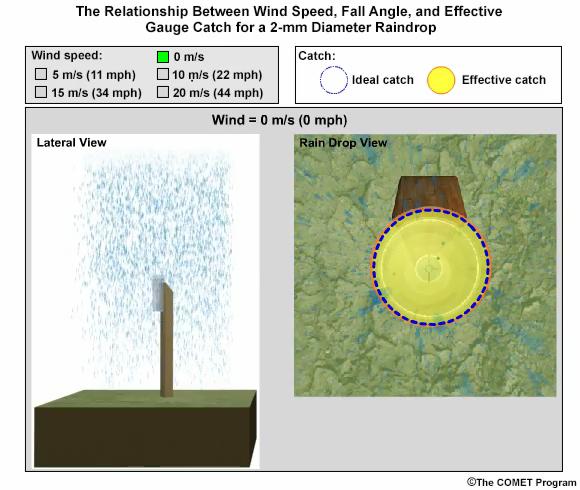
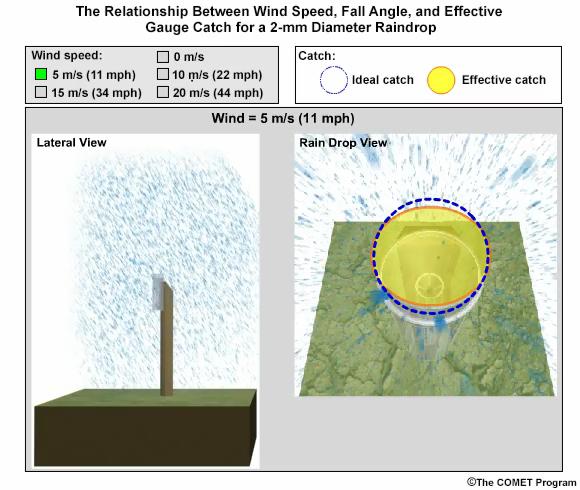
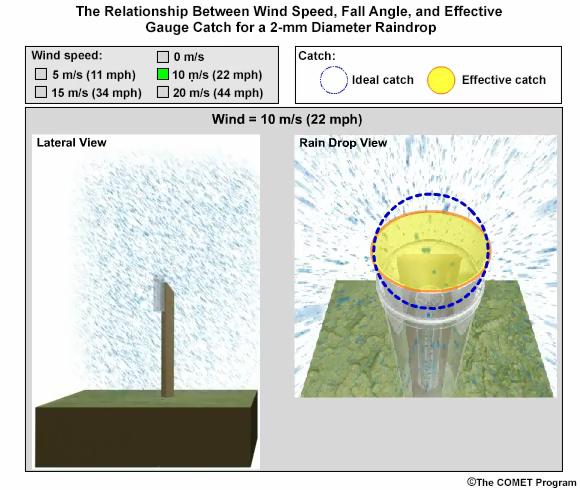
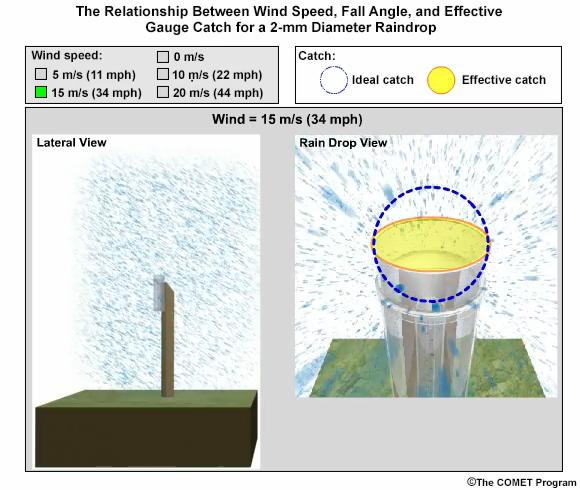
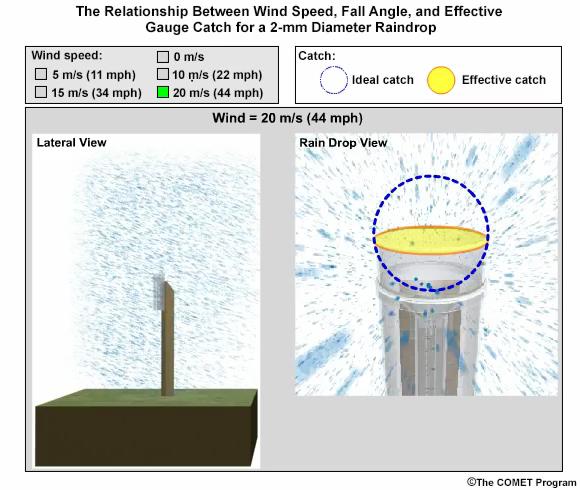
In this exercise we will consider typical 2-mm-diameter raindrop. We will take the perspective of 2-mm drops falling toward the gauge opening. Consider a 0° fall angle to be that of rain falling perfectly vertical, and a 90° fall angle is rain blowing perpendicular to the gauge.
Compare how the fall angle changes in the following figures, along with the effective collection area of the gauge, as wind speed changes. For each wind speed, you can compare the ideal catch area of the gauge with the effective catch area that is determined by the fall angle. When you are ready, answer the questions provided.
Download Video
Download Video
Download Video
Download Video
Of course there is a great deal of variability controlling the fall angle. Influences on the angle include the steadiness of the wind, disruption to the flow, and very importantly, the size and phase of the hydrometeor.
Download Video
Rain Gauge QPE » Gauges, Wind, and Turbulence
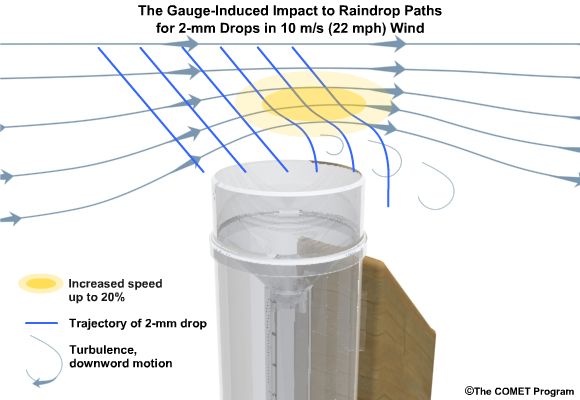
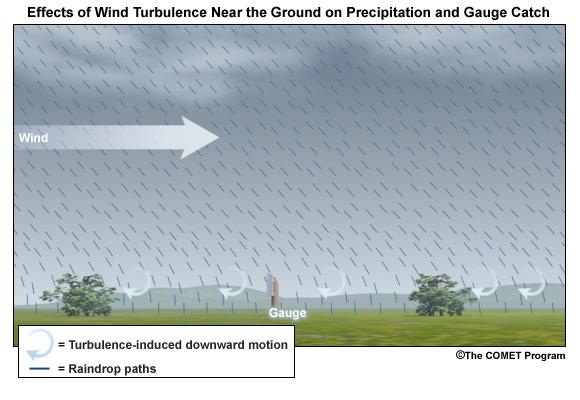
The exercise that you just completed showed a simplified view of the impact of wind on gauge catch. The fall-angle considerations represent a worst-case scenario. But in addition to fall-angle considerations, turbulence in the flow may influence the trajectory of hydrometeors. This may partially offset errors caused by the wind. Spacing between hydrometeors may also change due to wind effects, possibly offsetting some of the wind-induced errors.
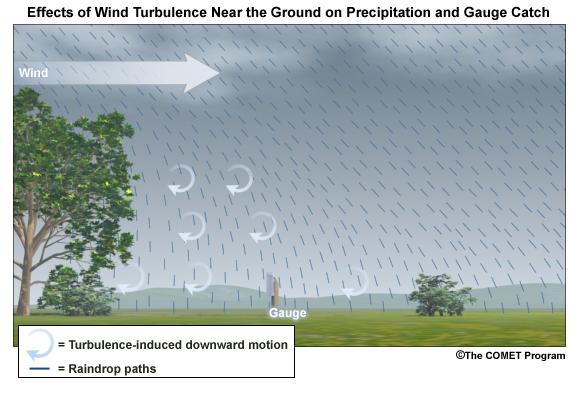
Here we see an increase in wind speed over the gauge, but we also see turbulence-induced downward motion. Note from the trajectories that this may increase catch, although sometimes the primary gauge-induced downward motion may be downwind of the gauge.
Download Video
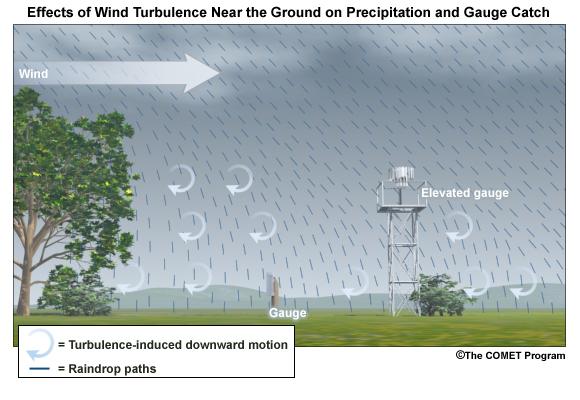
Ground-induced turbulence in the vicinity of the gauge may be much more important for improving gauge catch than turbulence induced by the gauge itself.
As long as the ground objects are not tall enough to intercept incoming precipitation, the turbulence-induced downward motion has the effect of steering the hydrometeors vertically toward the ground.
Elevated gauges are less likely to benefit from ground-induced turbulence.
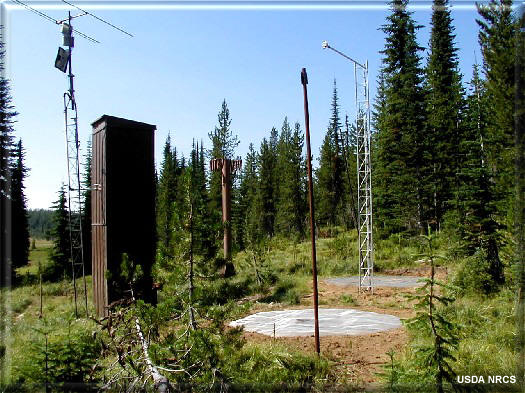
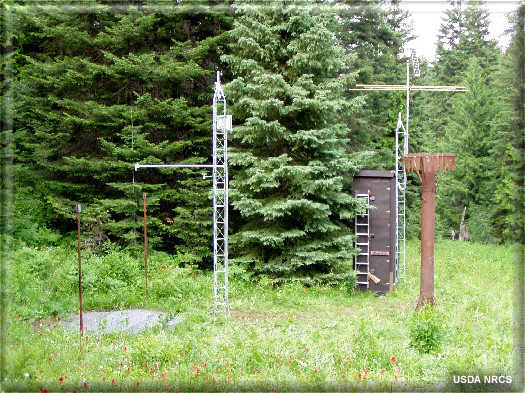
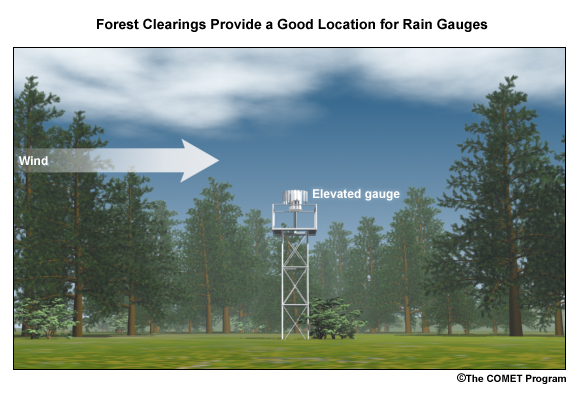
A clearing within the trees may provide the best balance between reducing wind speed but not altering precipitation distribution too much. Remember that the effects from deciduous trees are seasonal.
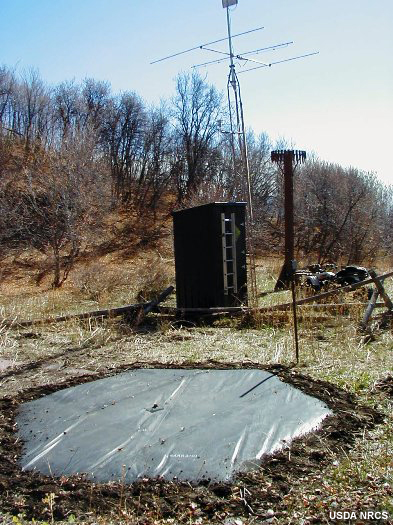
(Note: This measurement station also includes a snow pillow used to measure the weight of accumulated snow. Snow pillows will be discussed in more detail later. )
Rain Gauge QPE » Rain, Gauge Catch, and Wind
In summary, gauge catching rain is influenced by both the fall angle and the turbulence in the vicinity of the gauge.
Fall angles that depart from the verical will result in a reduction of the gauge’s effective collection area. Turbulence partially offsets this problem by inducing downward motion around the gauge.
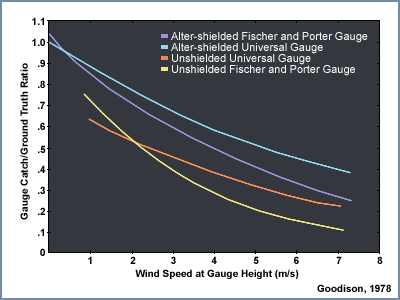
This graphic shows the generalized relationship between wind speed and gauge catch for liquid hydrometeors. The gauge catch is expressed as the ratio of the gauge measurement to what actually fell, so values less than 1.0 are measures of underestimation by the gauge.
For a typical size raindrop of 2-2.5 mm, a general rule of thumb is to expect a 1% loss of precipitation for every 1 mph increment in wind speed. This converts to 2.2% for every 1 m/s.
Therefore, a 9 m/s (20 mph) wind speed may be expected to result in an underestimation factor of 0.80, or a 20% underestimation of the rainfall.
There is a large envelope of uncertainty due to the variability in drop sizes, the steadiness of the wind, and the gauge location. Here are a few main points to remember. The best measurements in windy conditions will be in situations with large raindrops, gauges near ground level, and shielded gauges. The poorest measurements will be with small raindrops and drizzle drops, and when gauges are directly exposed to the wind.
Rain Gauge QPE » Snow, Gauge Catch, and Wind
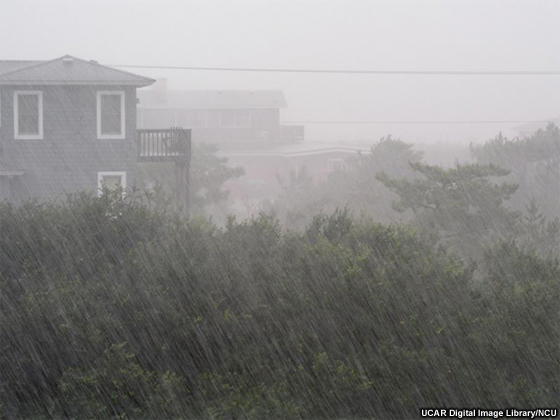
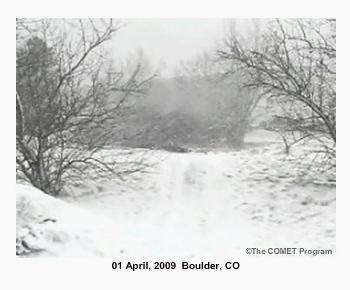
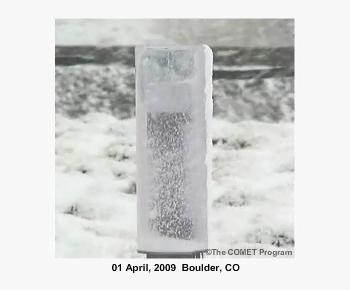
As demonstrated in the exercise, snow is more severely impacted by wind.
Download Video
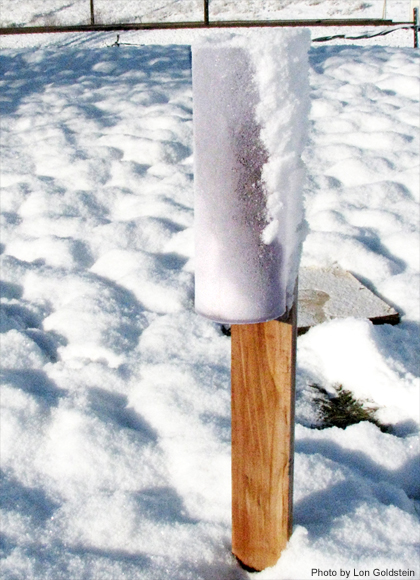
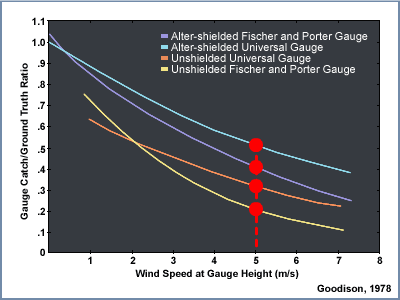
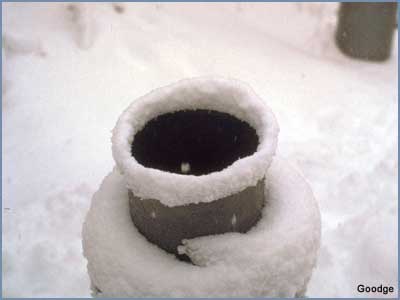
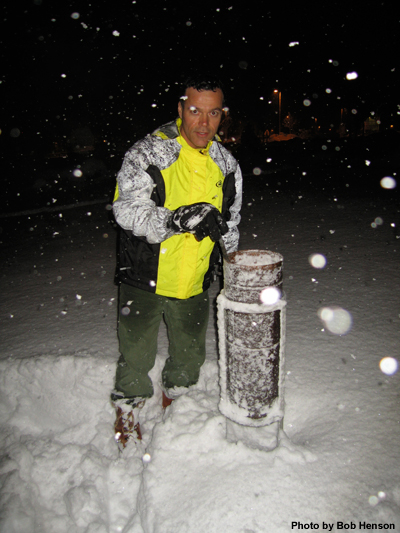
This photograph shows the typical collection of snow in a rain gauge with relatively light winds of 5 m/s (11 mph). The snow is drifted up on one side illustrating that only a portion of the opening, on the downwind side, was effectively collecting the snow.
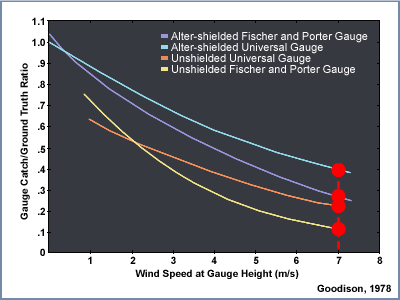
A 5 m/s (11 mph) wind will result in gauge undercatch for snowflakes on the order of tens of percent. The studies plotted on this graph show that at a wind speed of 7 m/s (15 mph) the gauge may be catching only 10-50% of what actually falls! Even in the two studies where the gauge catch was improved through use of wind shields, the gauge catch at 7 m/s is still 50% or less. The magnitude of the problem will vary with snowflake characteristics. Denser crystals will have fewer gauge catch errors than low density crystals.
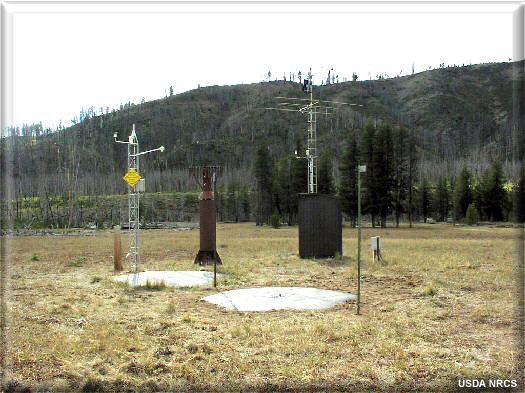
Snow pillows are a technology used at SNOTEL sites in the western United States. These weigh the snow on the ground to get a liquid equivalent. Users in the NWS generally find that these data are superior to those provided by automated gauges.
More information can be found at the United States Department of Agriculture, Natural Resources Conservation Service (NRCS) site: http://www.wcc.nrcs.usda.gov/snow/.
Rain Gauge QPE » Effects from Gauge Characteristics
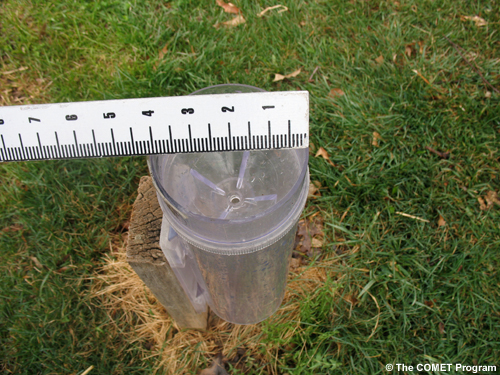
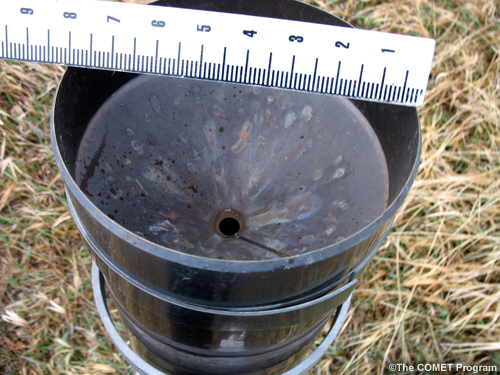
A gauge aperture of at least 102 mm (4 in) in diameter is desirable. These NOAA-approved clear plastic gauges have 4-inch diameter apertures. Smaller openings will increase the likelihood of under catch.
The NWS cooperative climate station manual gauges have a 203-mm (8-inch) aperture.
As mentioned earlier, gauge catch is sometimes improved when nearby vegetation disrupts the wind. A good location may be a forest clearing where the trees are not close enough to directly intercept the precipitation.
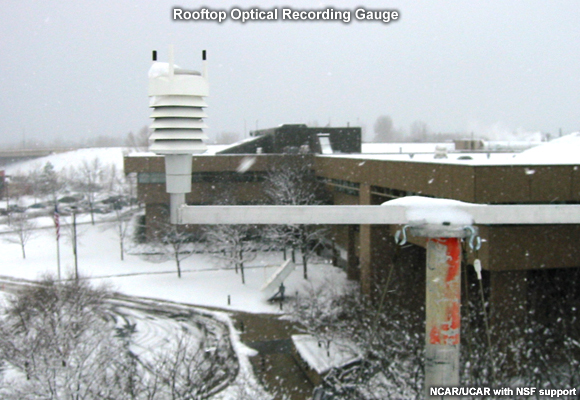
The reason to elevate gauges or place them on rooftops is often driven by security concerns rather than science. This increases the likelihood of wind-induced errors.
Rain Gauge QPE » Measurements from Automated Gauges
Automated rain gauges are preferred by many professional users such as the NWS. Automation allows for the assimilation of numerous reports from remote regions.
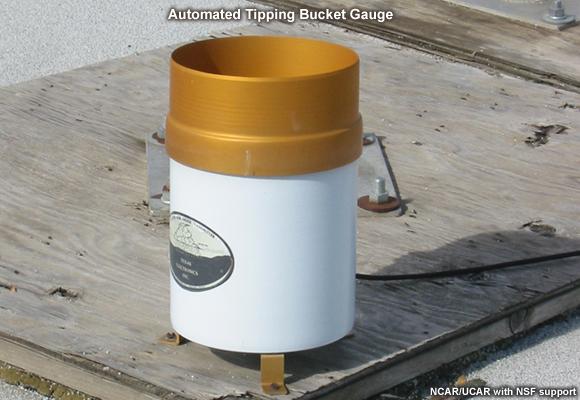
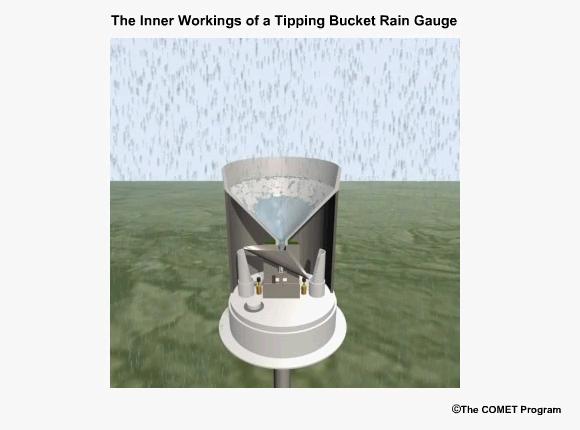
A widely used type of automated gauge in the United States is the tipping bucket style. These allow for high temporal resolution.
Download Video
Problems associated with automated gauge measurements are often a function of precipitation rate and precipitation phase.
Precipitation phase refers to whether the hydrometeors are liquid, liquid, and below freezing such as freezing rain, or frozen, such as hail or snow.
Download Video
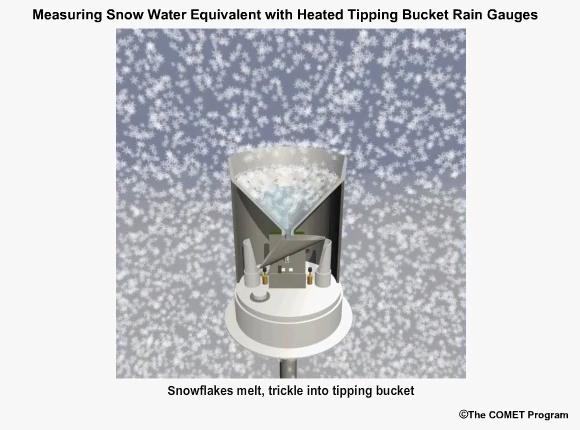
Freezing and frozen precipitation present a difficult problem for gauge measurement. This is particularly true for the popular automated tipping bucket gauge. To obtain a liquid-equivalent measurement, the gauge must be heated to melt the frozen precipitation. This can and often does lead to sublimation or evaporation of precipitation without measuring it, resulting in underestimates. In addition, if the snowfall rate is very great, the melting will not occur fast enough to prevent gauge overflow, again leading to underestimation.
Precipitation rate can also impact the accuracy of the gauge measurement. Although this varies with gauge design, the problem has been primarily with the tipping-bucket-style gauge as described in the rain-gauge webcast referred to earlier.
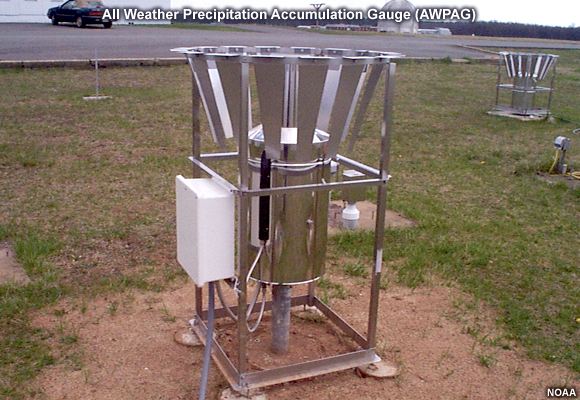
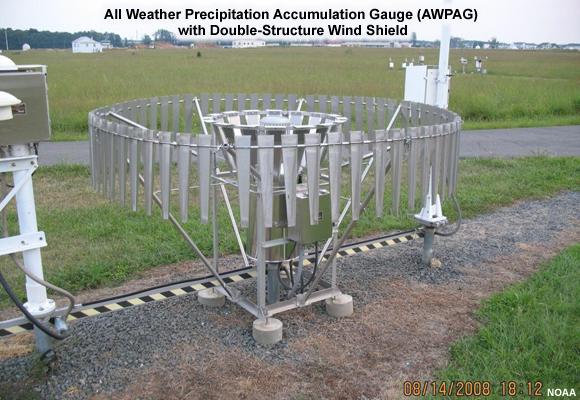
The NWS is testing an automated “weighing” gauge known as the all weather precipitation accumulation gauge (AWPAG). There is still some heating of the rim to help direct snow into the gauge where a weight will determine the liquid equivalent. However, the heated area is not nearly as large as that in the tipping bucket gauges used by the NWS. Therefore, the errors with evaporation and sublimation should be reduced.
Initial testing showed disappointing results in snow, perhaps due mainly to wind effects.
A new double wind shield version of the AWPAG gauge being deployed may help reduce the problems with measuring snow.
As mentioned earlier, “snow pillow” estimates at SNOTEL sites are often used instead of gauges where they are available.
Rain Gauge QPE » Measurements from Manual Gauges
Manual gauge reports suffer from the lack of high temporal resolution. This makes manual reports less suitable for software programs that need fast access to high-resolution gauge reports.
However, manual gauges are visited routinely and therefore problems that affect gauge measurement may be identified more promptly. These problems can include insect or bird nests, leakage, overflow, blockage from rapidly growing vegetation, and vandalism.
Provided that gauge overflow does not occur during intense hail or snowfall, manual gauges may allow more accurate liquid-equivalent measurements with frozen precipitation. Snow and hail are melted and measured manually.
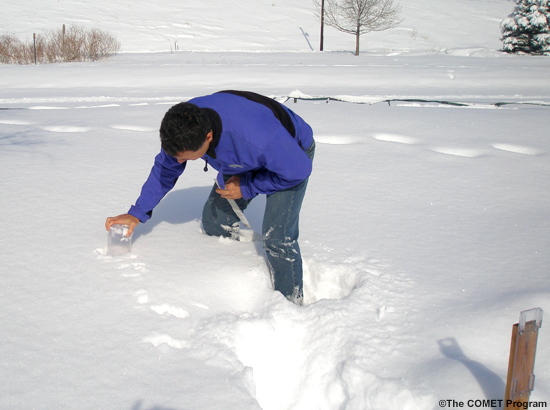
In addition, the observer may collect a “core” measurement of snow from the ground if they determine that this will provide a more representative sample than the snow that was collected by the gauge. Core measurements are intended to minimize the errors caused by the wind. A well trained observer may therefore provide improved liquid-equivalent readings.
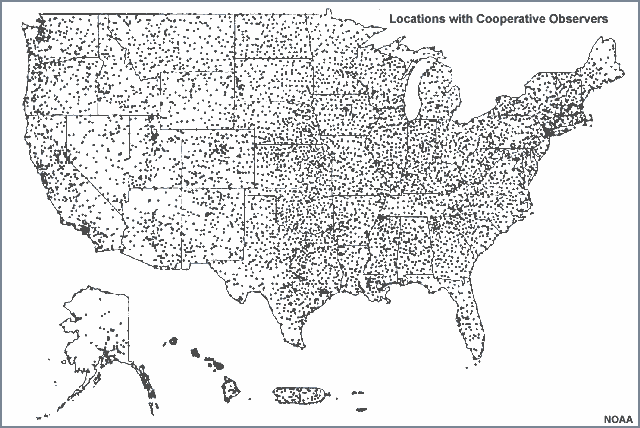
There are numerous manual gauge networks. Two well known ones are the cooperative observing network and the Community Collaborative Rain, Hail, and Snow observing network (CoCoRaHS).
The cooperative observing network, which is sponsored by NOAA’s National Weather Service, has observers in every state. Roughly 80% of the network still uses manual gauges.
The CoCoRaHS network is nationwide in the United States: http://www.cocorahs.org/.
Rain Gauge QPE » Rain Gauge QPE Key Points
Rain gauges can provide excellent information if they are well maintained, optimally located, and the wind is light.
Rain gauges are point estimates and will not necessarily provide good spatial resolution.
Wind causes significant errors in the gauge catch resulting in underestimation errors. These errors are greatest in strong wind, for exposed gauges, and for snowflakes and small liquid drops.
Wind-induced fall angles reduce the effective catch area of the gauge. Turbulence can induce downward motion that partially offsets the fall angle problem.
In situations where good radar coverage exists, radar may incur less uncertainty in high-wind situations than the gauges. A user of multiple precipitation sensors may want to consider the possibility that under such conditions it may not be wise to adjust the radar with the rain gauge data.
Reference https://www.meted.ucar.edu/hydro/precip_est/part1_measurement/
3.2.2 Beyond gauges - alternative precipitation datasets
Given the spatial coverage limitations of rain-gauge networks (including wind-speed sampling error, etc., see popout above for details), a primary source for alternative precipitation estimates are gauge-adjusted radar estimates, in regions where radar-beam coverage is sufficient. The strengths of these derived estimates are as follows. High spatial resolution: outside of point-based rain gauges, radar systems provide some of the highest-resolution data on precipitation patterns, allowing for detailed mapping of rainfall and storm structures while still providing coverage over broad areas. Wide coverage: Radar can cover large geographical areas that might be difficult to monitor using ground-based instruments alone. This wide coverage is particularly useful in remote or inaccessible regions (as long as there is no beam-blockage). Detection of precipitation type: Advanced radar systems can differentiate between types of precipitation (rain, snow, hail).
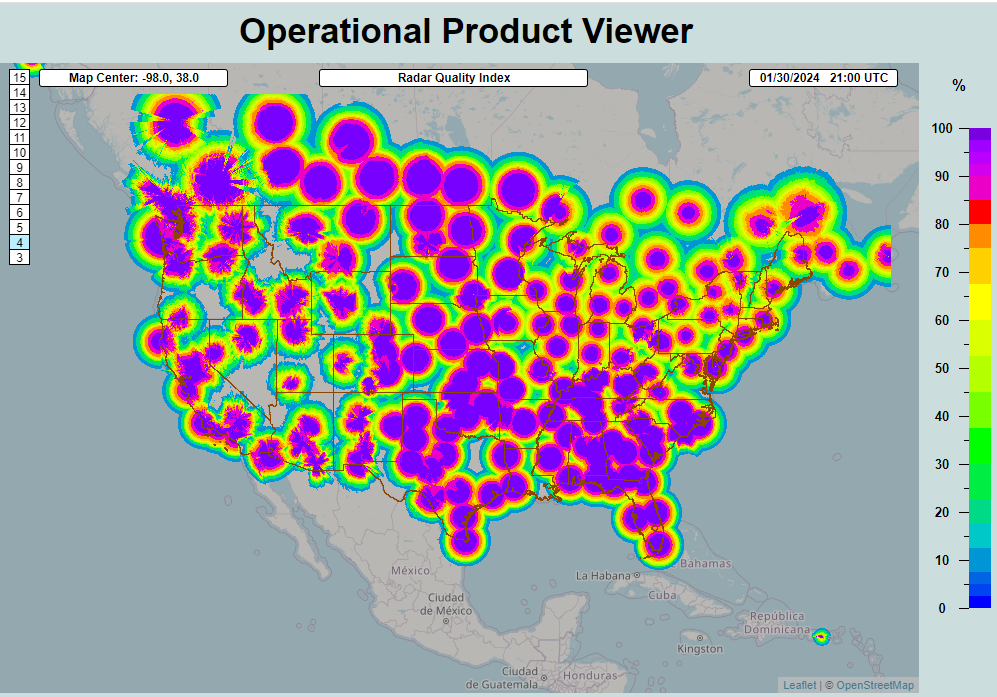
However, gauge-adjusted radar estimates also have the following limitations. Attenuation: Radar signals can be attenuated by heavy precipitation, especially in convective storms. This attenuation can lead to underestimations of rainfall intensity at greater distances from the radar site. Ground (or other) clutter: Objects on or near the ground (buildings, hills, trees) can reflect radar signals, resulting in ground clutter that obscures or mimics precipitation signals, leading to inaccuracies. Most operational radar systems including the WSR-88D effectively filter out the ground echoes, limiting the impact of stationary clutter. However non-stationary clutter including vehicle and train traffic, sea-surface clutter and clutter from wind farms cannot be filtered effectively leading to errors. It is important to note that above-ground flying insects, birds, and bats can also cause similar problems. Elevation angle limitations: The radar beam travels in a nearly straight line (it is typically refracted slightly towards the surface by the atmosphere), while the Earth curves away from it. At longer distances, this can cause the radar to overshoot lower-altitude precipitation, leading to errors in estimated rainfall close to the ground due to evaporation and the horizontal advection of the measured precipitation. Also, at long ranges, part or all of the radar beam may be located above the 0 deg C level, so it is measuring the ice or melting ice above the rain and not the rain itself. Range degradation: The quality and accuracy of radar data decrease with distance due to the spreading of the radar beam and increasing altitude of observation. This makes long-range precipitation estimates less reliable. Dependence on reflectivity: Radar traditionally estimates precipitation by measuring the reflectivity of water particles in the air. This method assumes a relationship between the size and type of particles and the intensity of precipitation, which has its own inaccuracies. The introduction of dual-polarization measurements has reduced, but not eliminated, these issues. Calibration and maintenance: Radar systems require regular calibration and maintenance to ensure their accuracy. Calibration must often be adjusted locally to account for regional climatic and environmental conditions, adding complexity to their operation. Spatial representation: radar beams are a certain width, and as such, the measurements implicitly are a type of representative average over the region of coverage. This can be a strength or a weakness depending on whether the implicit sampling area corresponds to that of the researcher’s interest. Note that this spatial discretization also dampens extremes that would be captured through point-based gauge measurements. Length of historical record and changes in estimation quality through time: some of the most significant radar technologies did not become operational until the 1990s or later (with dual-polarization and doppler capabilities), so care should be taken when using radar-based precision estimates preceding this time period. However, note that over the U.S. it is possible to assess the level of uncertainty in derived radar-precipitation estimates for a given location, as shown in the figure below of the Radar Quality Index (RQI), which shows the impact of non-uniform coverage of radar related to the elevation of the radar sample, distance from the radar, and the impact of mountains.
Figure: the Radar Quality Index (RQI) provides a measure for how useful radar might be for precipitation estimates based on the amount of unblocked radar sampling below the freezing level. The scale is 0 to 100%, with the high end indicating good radar coverage, and the low end indicating poor coverage, typically due to terrain blocking or increasing distance from the radar. This image is from February. The distance that high RQI values extend from the radar is typically better during summer when there is more convective precipitation and higher freezing levels.
Taken together, gauge-adjusted radar estimates provide some of the most dependable and accurate estimates of precipitation over the contiguous U.S. (CONUS) with the following caveats: use outside of CONUS (e.g. insufficient radar coverage), in mountainous areas (e.g.,beam blockage), variability in the quality of the estimates in space (e.g.,range degradation) and time (e.g.,changes in coverage and technologies used over the last 60 years).
Below we provide a brief overview of some of the changes in radar estimates since their first operational use by the National Weather Service in 1957.
Radar technology changes
Radar technology and coverage used for precipitation observations has evolved significantly since its inception. Here are key milestones and changes in radar’s use for weather observation:
Early Developments and WSR-57 (1950s)
Initial Use: Radar technology that was initially developed for military purposes during World War II was adapted for weather observation.
WSR-57: The first dedicated weather-radar network, Weather Surveillance Radar-1957 (WSR-57), was deployed. It provided basic reflectivity data, showing areas of precipitation.
WSR-74 (1970s)
Improved Technology: The WSR-74 was an upgraded version of the WSR-57, with better resolution and reliability.
Increased Coverage: More radar units were installed across the United States, providing broader national coverage.
NEXRAD (WSR-88D) (1990s)
Next Generation Radar (NEXRAD): The WSR-88D, implemented in the early 1990s, marked a significant leap forward. It provided Doppler capabilities, enabling the measurement of precipitation velocity (indicating wind speeds and direction within storms). The WSR-88Ds were also double the wavelength (10 cm S-band versus 5 cm C-band) resulting in dramatically reduced attenuation.
Dual Polarization: In the 2010s, NEXRAD radars were upgraded with dual-polarization technology, which sends out both horizontally and vertically polarized pulses. This enhancement allowed for better differentiation between types of precipitation (rain, snow, hail) and improved estimates of precipitation rates and quantities.
Phased Array Radar (2000s - Present)
Phased-Array Technology: Research and development into phased-array radar technology, which allows for faster and more flexible scanning of the atmosphere, began. Phased-array radars can rapidly switch between different observation modes and provide more timely data.
Enhanced Detection: This technology offers potential improvements in detecting severe weather phenomena, such as tornadoes and microbursts, more quickly and accurately.
Advances in Data-Processing and Integration
Improved Algorithms: Advances in data-processing algorithms have led to more accurate and detailed precipitation estimates and forecasts. For example the automated detection and removal of ground clutter and transmitting advanced waveforms that are used to extend the unambiguous range.
Integration with Other Data Sources: Modern systems integrate data from radars, satellites, weather stations, and other sensors, providing a more comprehensive understanding of weather systems.
Future Developments
Continued Innovation: Ongoing research aims to further enhance radar technology with even faster data acquisition, higher resolution, and better predictive capabilities.
These advancements have greatly enhanced the accuracy, reliability, and detail of precipitation observations, significantly improving weather and precipitation estimation and severe-weather warning systems.
Below we provide additional introductory details on the derivation, strengths, and limitations of quantitative precipitation estimates (QPE) derived from radar, including limits due to beam blockage and mountainous regions (which also pose problems for gauges), quality-control methods, and a brief discussion of satellite-derived QPE.
Radar QPE
I. Introduction » What is Quantitative Precipitation Estimation (QPE)?
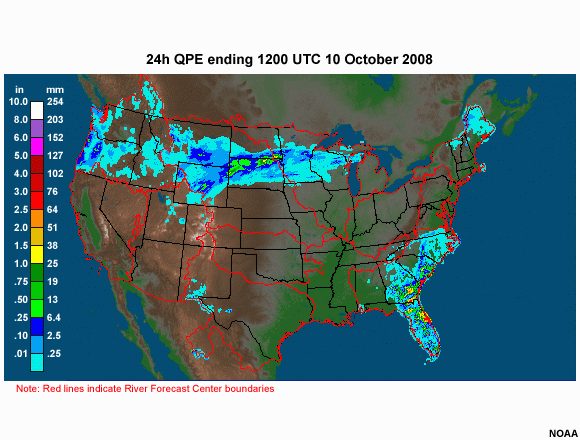
The term Quantitative Precipitation Estimation, or QPE, refers to the estimation of observed precipitation.
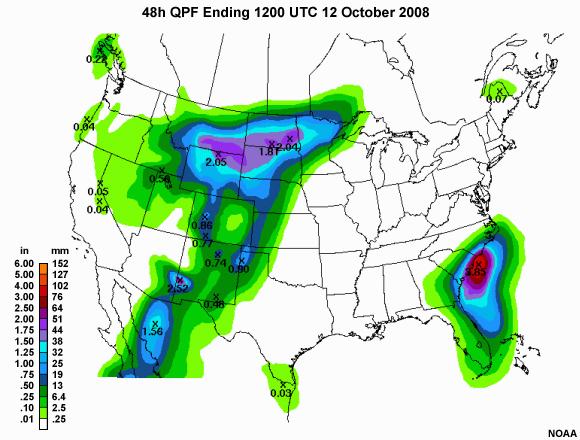
This is different than a forecast of precipitation which is referred to as a Quantitative Precipitation Forecast, or QPF.
You may wonder why precipitation is only an estimate if it is “observed.” Observed precipitation is only an estimate because the tools used provide inexact approximations of the actual magnitude and distribution of precipitation.
I. Introduction » QPE Methods and Tools
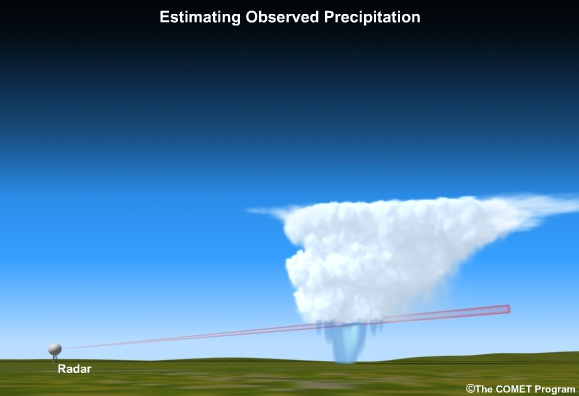
Radar is a remote-sensing QPE tool with excellent spatial and temporal resolution. However, radar coverage may be inconsistent from place to place and from storm to storm.
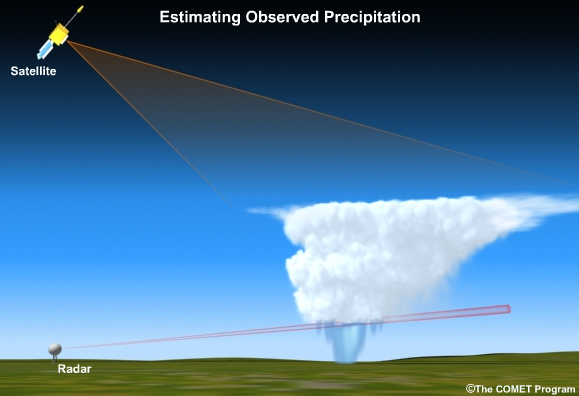
Satellite is another remote sensing QPE tool, but with much coarser resolution than radar.
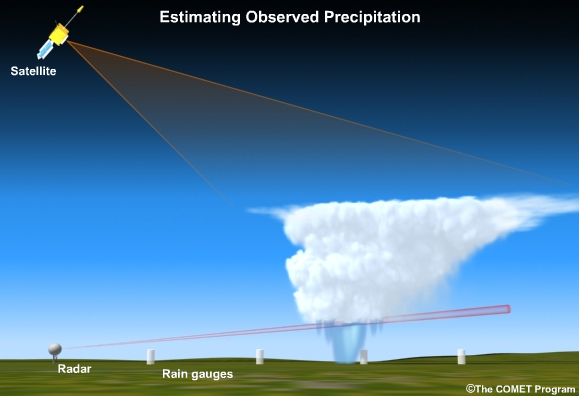
Even rain gauges, which are ground-based measurements, are subject to errors and cannot resolve the spatial detail of precipitation patterns.
A precipitation climatology is sometimes used to augment the estimates of observed precipitation. This can be very useful in regions where precipitation distribution, and the ability to observe it, is greatly affected by terrain features.
II. Remote Sensing of QPE
Precipitation accumulation is routinely derived from radar and satellite observations. Despite the inconsistencies in radar-derived precipitation from location to location and from season to season, radar guidance is considered superior to satellite guidance of QPE in many areas. This is mainly due to the superior resolution in both space and time and often better quantitative guidance.
Topics in this section include the relationship between drop-size distribution, the Z-R relationship, and derived rainfall; the impact of snow on radar-derived estimates, the potential QPE improvement with polarimetric radar, radar coverage issues, and the concept of radar climatology. A brief summary of issues regarding satellite-derived QPE will follow the radar sections.
II. Remote Sensing of QPE » Reflectivity-Rainfall Rate (Z-R) and Drop Size Distribution (DSD)
Radar reflectivity (Z), expressed in units of dBZ, is used to compute rainfall rates (R) in mm/h using a reflectivity to rainfall rate relationship. This is known as the Z-R relationship. Rainfall rates then get integrated over time to produce accumulation for various time periods.
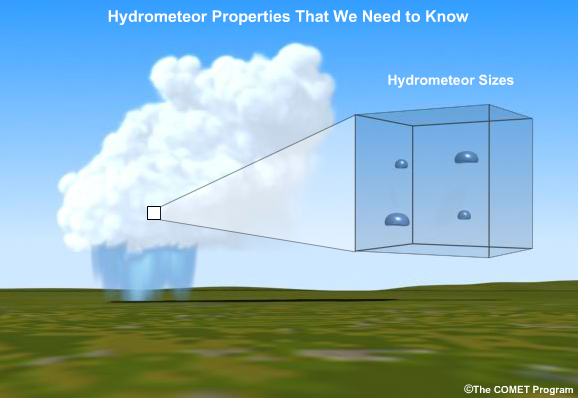
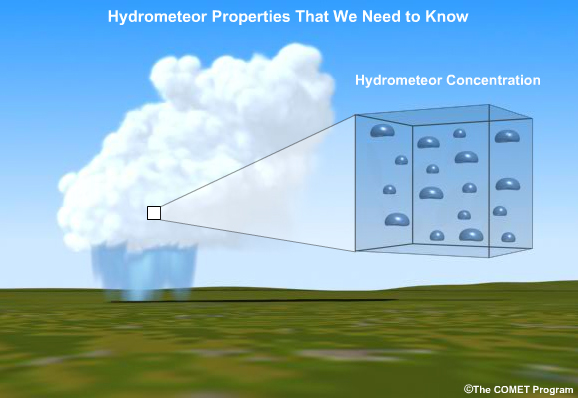
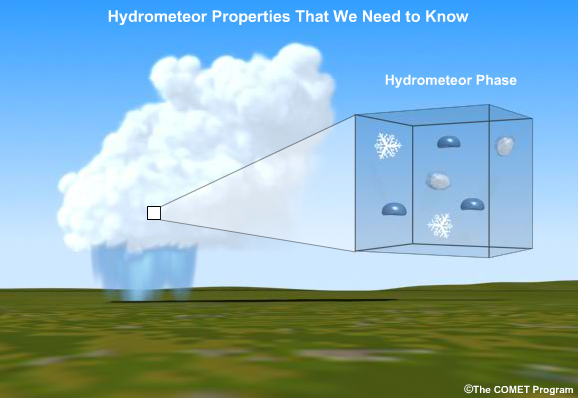
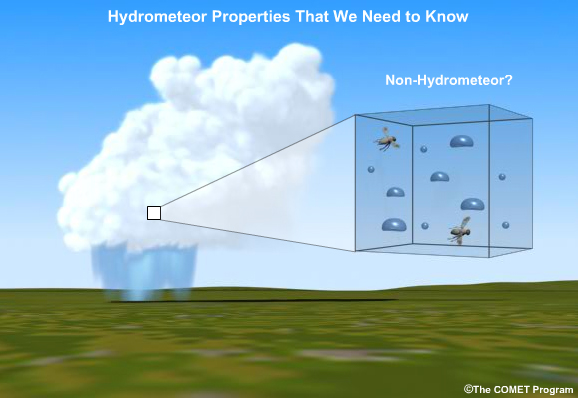
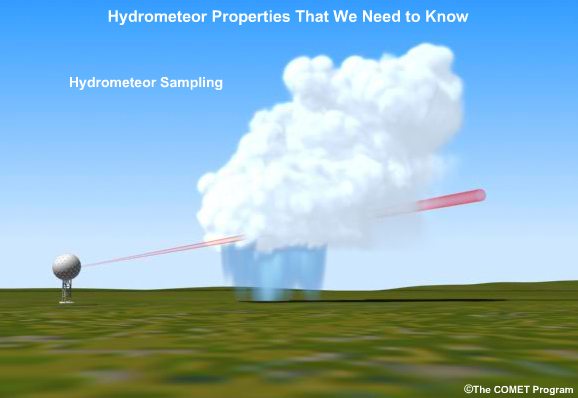
The relationship between reflectivity and rainfall rate, and thus the Z-R relationship, varies with time, location, and season. Hydrometeor properties that influence the Z-R relationship include size, concentration, and phase. Accuracy of derived rainfall rates is further impacted by the presence of non-hydrometeors, and whether the radar is sampling a region that is representative of precipitation reaching the ground.
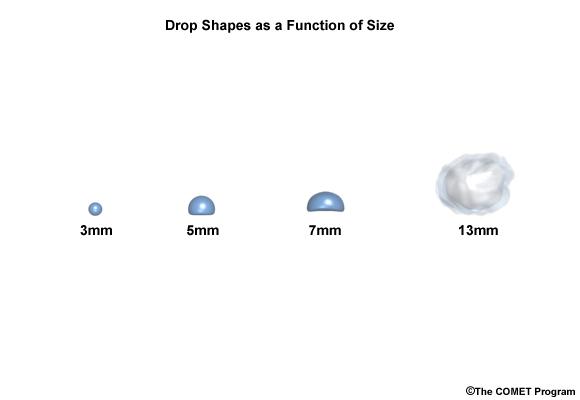
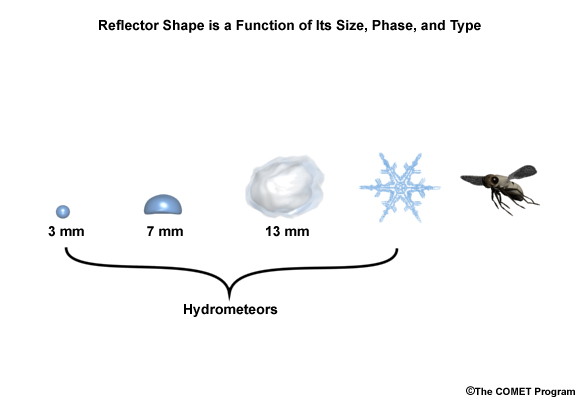
Hydrometeor shape, which is related to hydrometeor size and phase, is also important information for understanding the relationship between reflectivity and precipitation rates. Large liquid drops are more oblate in shape than smaller ones. For horizontally-polarized radars like the WSR88-D, greater horizontal diameters reflect more energy back to the radar. This results in greater derived rainfall rates.
Even relatively small 13-mm- (half-inch) diameter hailstones contribute greatly to radar reflectivity. That’s why the presence of hail results in anomalously high derived-rainfall rates. This anomaly is typically minimized through use of rainfall-rate thresholds.
In Depth: Reflectivity Factor, Z
Z = ∫ N(D) D6 dD
Z = reflectivity factorD = drop diameterN(D) = number of drops of given diameter per cubic meterThis equation is presented to explain the sensitivity of reflectivity factor, Z, to drop diameter. Because the drop diameter is raised to the 6th power, small changes in drop diameter result in very large changes to Z. And large changes to Z result in large changes to derived rainfall rates.
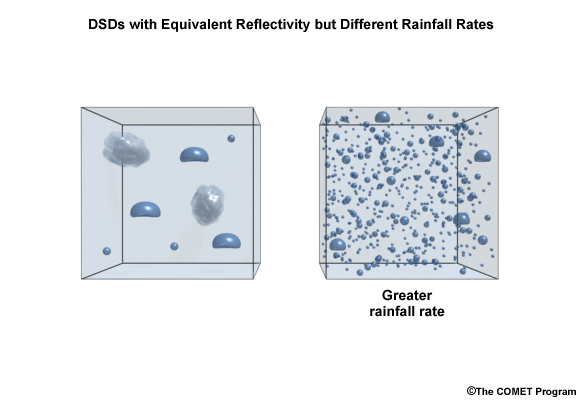
Drop size distribution (DSD) refers to the size and concentration of drops in a volume, say a cubic meter. Here we show two DSDs.
The radar is more sensitive to the horizontal diameter of the hydrometeors than it is to the concentration of hydrometeors. Therefore, a small number of large hydrometeors can result in the same reflectivity value as a very large number of smaller drops. But the DSD on the right is producing greater rainfall rates. The two DSDs should therefore be represented by different Z-R relationships.
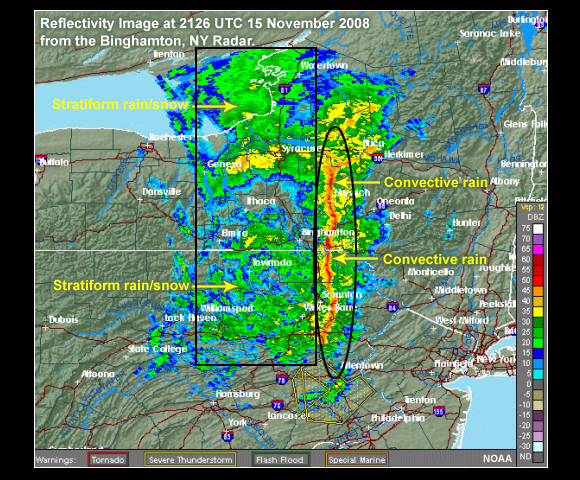
The DSD can vary significantly and quickly in both space and time. This means that it may be appropriate to have more than one Z-R relationship in effect at the same time. As of this writing, the NOAA National Mosaic and Multisensor QPE (NMQ) radar precipitation product can utilize numerous Z-R relationships based on atmospheric conditions.
Here we have a region with a squall line that most likely has a DSD consistent with convective rainfall. Nearby stratiform precipitation will exhibit a different DSD and should be associated with a different Z-R relationship than the convective area. As the precipitation system moves, the Z-R relationship at any one location should change with time.
II. Remote Sensing of QPE » Reflectivity and Snow
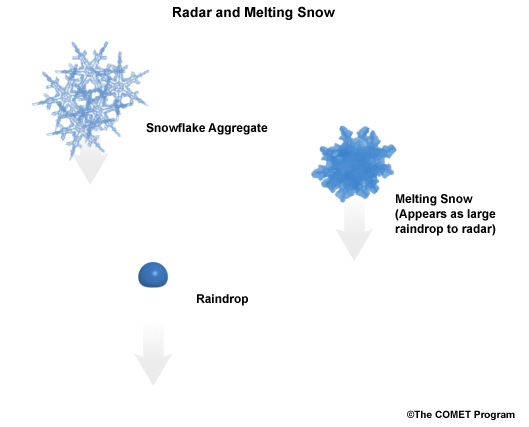
As snowflakes begin to melt, a coating of water can make them “appear” as very large raindrops to the radar. This can cause very high reflectivity and overestimated rainfall rates at the ground below where the radar is sampling the melting layer aloft.
Pure snowflakes and crystals violate the assumption of liquid hydrometeors that go into the Z-R equation. However, several research institutions are working on radar-derived snowfall including Z-S, or reflectivity snowfall rate relationships.
II. Remote Sensing of QPE » Precipitation Estimates with Dual Polarimetric Radar
Advances are made in radar technology every year. As this lesson is being developed, dual polarized radar, or polarimetric radar, is the most impactful with respect to precipitation.
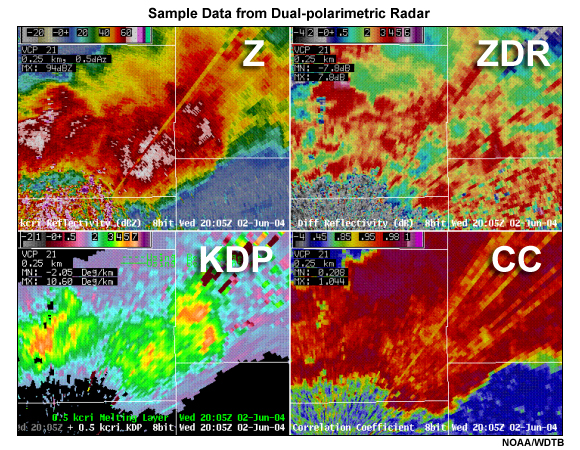
Since the WSR-88D radar network was upgraded to dual-polarization capabilities in about 2010 and 2011, many of the ambiguities associated with the phase, size, and distribution of hydrometeors have been greatly reduced. Further, the overall data quality has been improved with the addition of dual-polarization data. For example, ground clutter, bright-band and biological echoes are difficult to reliably identify and remove with traditional radars. But with dual-polarization radars these sources of contamination are readily identified by automated algorithms. Although errors from DSD variations, bright-band contamination and clutter remain ongoing issues for the WSR-88D radar data, the errors associated with them have been substantially reduced with the addition of dual-polarization capability.
Excellent training resources on precipitation measurement using polarimetric radar is available from NOAA’s WDTD. We will not repeat those lessons here, but we strongly encourage you to review them: http://www.wdtb.noaa.gov/courses/dualpol/Outreach/.
In addition to reflectivity estimates that we are familiar with, dual-polarization radar allows for estimates of the average shapes of hydrometeors within the resolution volume and whether or not differently shaped hydrometeors are collocated, i.e., mixed phase. This is accomplished by transmitting and receiving both a horizontally and a vertically polarized radar beam. By measuring the different returns from these two polarizations, one can estimate the shape and the effects from different hydrometeor shapes, which increase the accuracy of precipitation estimates and hydrometeor type classification.
For example, we can determine if the prominent reflectors are large raindrops, which tend to be oblate with a large horizontal axis. We can also determine if the hydrometeors are more spherical, which is consistent with small raindrops. Or we can discern whether the hydrometeors are highly reflective and generally spherical, consistent with hail. Other measures can be used to estimate the presence of snow, insects, or ground targets.
II. Remote Sensing of QPE » Radar Sampling of Precipitation
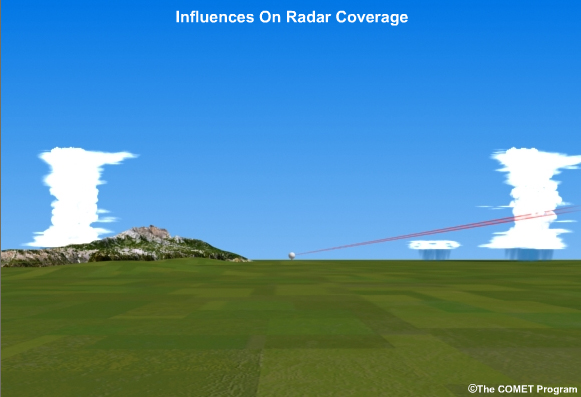
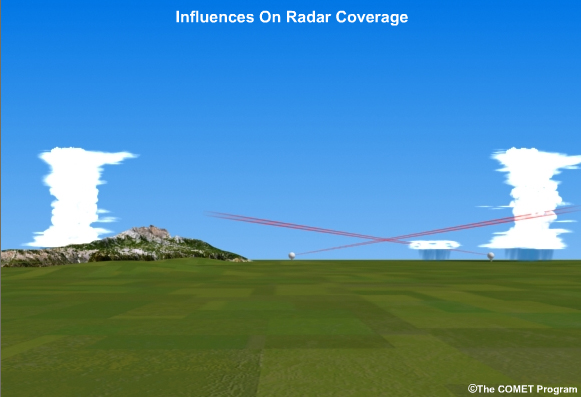
Most of the discussion so far is applicable for areas with good radar coverage. Good radar coverage is determined by three main factors.
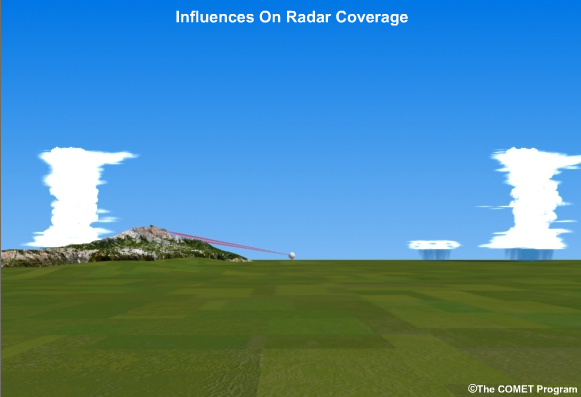
There are no obstructions of the low-level radar beam from terrain features or other ground targets like buildings.
Precipitation systems extend through a deep portion of the troposphere, as we see with convective storms.
The density of radar sites is sufficient. In other words, the radars are close enough to each other so that all radar sampling is occurring in the low levels of the atmosphere.
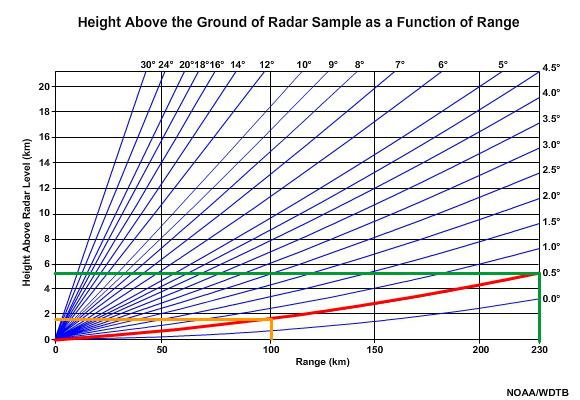
The radar beam gets higher in the atmosphere with distance from the radar. Even a low tilt angle like 0.5° is ~1.5 km (5,000 ft) above the ground at 100 km from the radar, and 5.2 km (17,000 ft) high at 230 km. Therefore, to sample the low-level precipitation, which is most likely to be representative of the precipitation reaching the ground, radars need to be positioned close to each other.
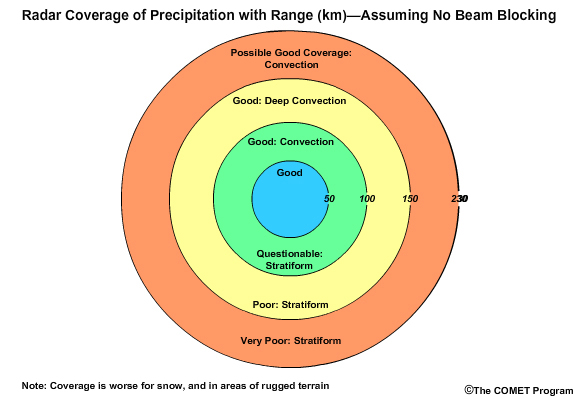
For stratiform precipitation, it is best to sample the lowest 1 km of the atmosphere, which typically occurs within 50 km of the radar. Beyond 50 km, the radar sample may be questionable. This range can be further limited by terrain blocking of the radar beam. Sampling of stratiform precipitation is almost always poor beyond 100 km from the radar.
Convective precipitation is distributed over a much deeper layer of the atmosphere than stratiform precipitation. Therefore, in seasons and locations where convection is common and terrain is minimal, the radar may be able to sample precipitation well at long distances from the radar, perhaps beyond 150 km. Shallow convection may be undersampled by the radar at ranges closer than 150 km. Range coverage is worse for snow.
II. Remote Sensing of QPE » Radar Coverage
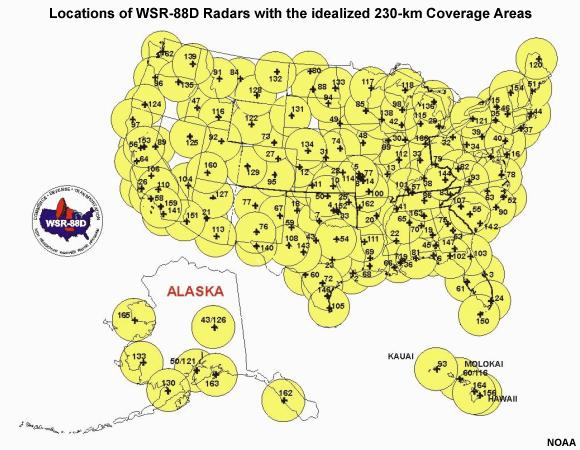
Here are the NWS radar locations with the ideal 230-km range shown with yellow circles. The density of weather radars is generally lower in the Western United States and Alaska than in other parts of the country. These maps do not account for terrain features that can greatly reduce the radar coverage.
For many locations and precipitation regimes, it’s unrealistic to expect good precipitation estimates with the idealized 230-km coverage shown here. A more realistic radius of 100 or 150 km would show greater and more numerous gaps, especially in the Western United States. In the winter, the range of realistic coverage may shrink to less than a 100-km radius.
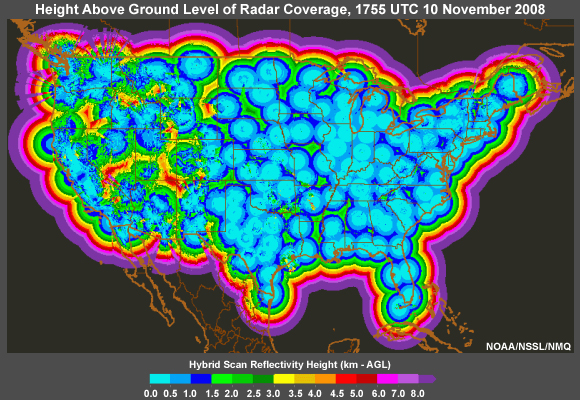
A more realistic coverage is shown here with a map of the height above ground level (AGL) of the radar sampling. It is for November 10th, 2008. Although this map can change depending on weather conditions and radar operations, the basic pattern will be the same.
The light blues show where there is good coverage of the low levels. The best low-level coverage is obviously in areas with relatively flat terrain and good radar density. Recall that for stratiform precipitation, radar coverage can be significantly impacted if the radar sampling is 1 km or more above the ground, as shown in the dark blue, greens, yellows, and reds. Even in the Central and Eastern U.S., stratiform precipitation may be significantly underestimated in places. In the West, radar sampling can be more than 3 km above the ground in large areas. This results in completely missed precipitation systems, especially stratiform. This is also a problem in Alaska. As an example, let’s look more closely at radar coverage in the northwestern portion of the contiguous United States.
II. Remote Sensing of QPE » Radar Climatology
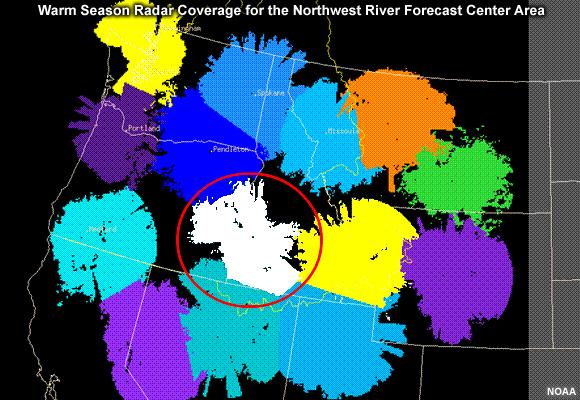
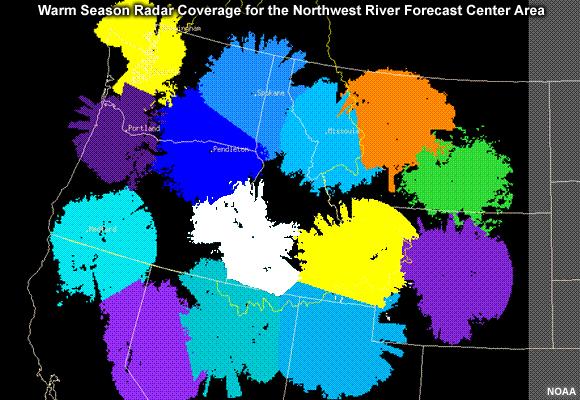
To account for the geographic and seasonal variability, the NWS has radar coverage maps. Here we see the warm-season effective radar coverage for the Northwest. The color-shaded areas are where radar climatology shows good coverage from at least one radar. The individual colors depict which radar the “good” coverage will come from. For example, the white area shows where radar estimates would come from the radar at Boise, Idaho, KCBX.
KCBX is considered good here because 1) this radar is able to sample precipitation, and 2) in areas of overlap with neighboring radars, KCBX is sampling from a lower elevation. The jagged appearance is caused by mountains preventing uniformly good coverage throughout the entire 230-km radius.
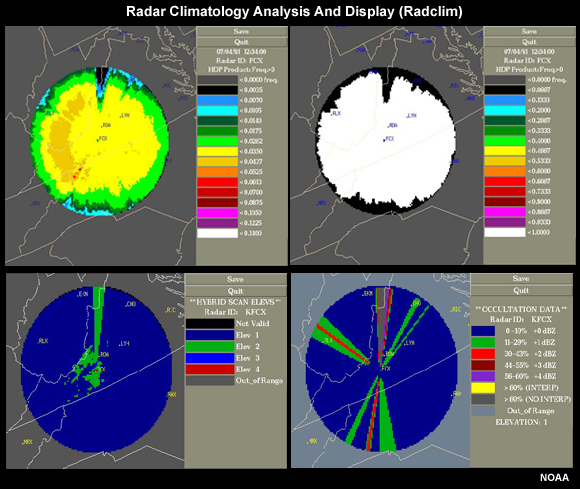
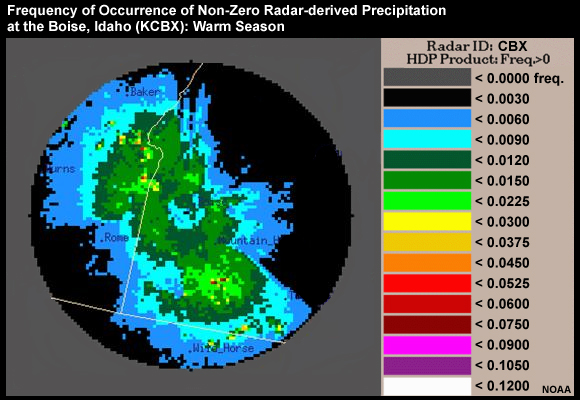
These are produced by the NWS radar climatology program, RADCLIM. We will briefly demonstrate radar climatology based on frequency of occurrence of precipitation for Boise, Idaho.
The precipitation frequency of occurrence starts with a precipitation threshold for defining what we will consider precipitation. Let’s use a threshold of 0.0 mm which means that any time there is more than 0.0 mm detected by the radar, we have a precipitation event. We could choose a higher threshold if we wanted to filter out light events.
The frequency of precipitation, for each radar bin, is the number of times more than 0.0 mm was observed divided by all of the radar observations in the dataset. We get this image for the Boise radar. The radar is in the center of the 230-km radius of ideal radar coverage.
The different colors show the different frequencies of occurrence. As distance increases from the radar, the frequency of precipitation decreases, indicated by blue and black colors. Note the large areas with very low frequencies of occurrence, are shown as black. These do not represent natural precipitation distribution. Rather, it shows where the radar sampling is greatly inhibited by terrain blocking.
II. Remote Sensing of QPE » Radar Coverage Map
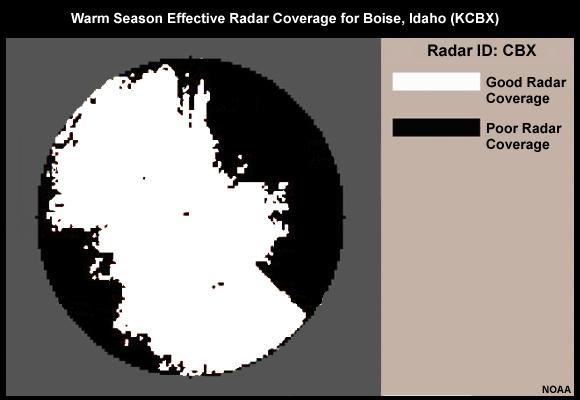
So now we want to choose a precipitation frequency threshold to represent effective radar coverage. In other words, we will say, “only when precipitation occurred at least this often, will we trust the radar estimates.”
In this example, a frequency of occurrence of 0.006 was chosen. This means that we will only consider radar bins where greater than 0.0 mm occurred at least 0.006, or 0.6% of the time according to the radar climatology.
This figure shows all non-black shaded areas shown on the radar coverage map as white shading. So the white shading is where we assume there is good radar coverage. We should assume bad coverage in the black areas. In the black areas, precipitation estimates should come from other radars or other sources such as rain gauges and satellite.
The choice of frequency threshold is somewhat subjective, based on forecaster experience regarding what produces the most useful guidance.
Radar climatologies are generated for specific months or seasons. Let’s go back to the summer season radar coverage for the northwestern portion of the contiguous United States. All of the non-black areas are where we can assume there is good radar coverage.
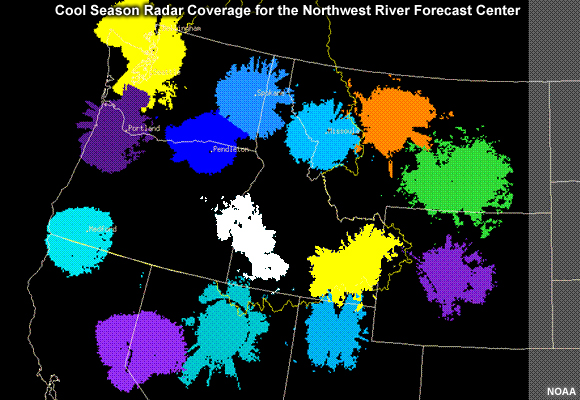
In the cool season, there is more low-level precipitation and thus the effects of terrain and distance on radar precipitation estimates are more severe. Note the sharp decrease in good radar coverage in the radar coverage map for the Northwest in the cool season.
These types of radar coverage maps, based on radar climatology, are used in MPE to determine where radar-derived data should be used.
II. Remote Sensing of QPE » Satellite QPE
Satellite estimation of precipitation is potentially useful in areas with poor coverage from radars and rain gauges. Although satellite sampling is more consistent from place to place than radar sampling, satellite-derived precipitation is lower resolution and generally less accurate than radar-derived precipitation. It is therefore considered a supplement, not a replacement for the radar products.
Satellite-derived rainfall products perform best in the tropics and in the middle latitudes during the warm season. In other words, it verifies best when the wind shear is relatively low and precipitation is dominated by convection. These are not the conditions in the radar-sparse Western United States during the wintertime wet season.
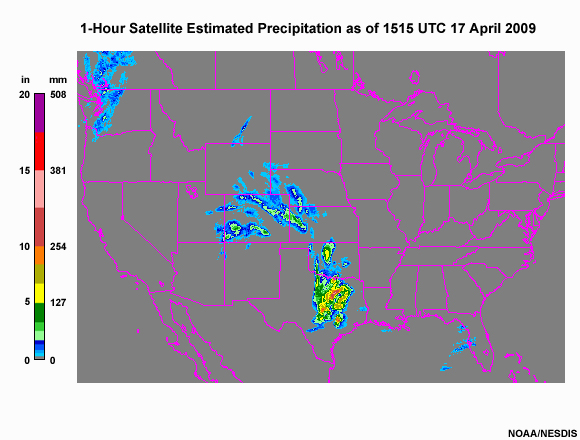
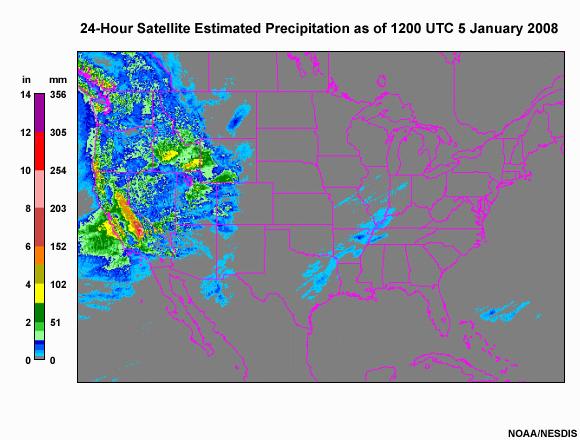
This NOAA product, known as the hydro-estimator, applies a terrain factor to the precipitation estimate using 700 mb winds. This helps to resolve the spatial distribution of the precipitation. Other improvements to precipitation rates may be achieved by applying factors related to cloud, moisture, and stability characteristics.
For satellite Hydro-Estimator rainfall products: http://www.star.nesdis.noaa.gov/smcd/emb/ff/HydroEst.php
In addition to adjustments based on both measured and modeled environmental properties, there is increasing use of additional sensor capabilities such as microwave satellite sensing and lightning detection. Passive microwave observations allow detection of water and ice within the cloud to derive more accurate rainfall rates. However, because microwave-sensing capabilities are specific to polar-orbiting satellites, the temporal frequency is much less than that of the hydro-estimator products based on geostationary satellites.
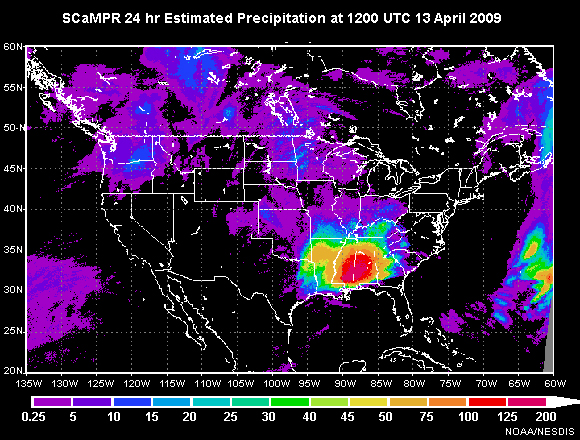
The Self-Calibrating Multivariate Precipitation Retrieval product, (SCaMPR) is an example of combining the temporal resolution of geostationary satellites with the more accurate estimation of rainfall rates of polar orbiters, and previews the next generation of operational satellite-based precipitation estimation tools.
For more information on efforts pertaining to real time satellite-based precipitation estimation at NOAA, please see: http://www.star.nesdis.noaa.gov/smcd/emb/ff/index.html.
Multi-satellite precipitation products have also greatly benefited from the new constellation of polar-orbiting satellites, known as the GPM, or Global Precipitation Measurement mission.
II. Remote Sensing of QPE » Remote Sensing QPE Key Points
Radar data, where available, provide the best resolution in space and time.
The best radar coverage occurs with convective precipitation, liquid precipitation, and in regions with minimal terrain features.
Errors in radar-derived precipitation are associated with variations in drop size distributions, precipitation phase, and lack of low-level information.
Dual-polarized radars estimate hydrometeor shapes, and have generated more accurate precipitation products.
Satellite-derived precipitation is a supplement in regions with poor radar and rain-gauge coverage.
3.2.3 Weather climatologies
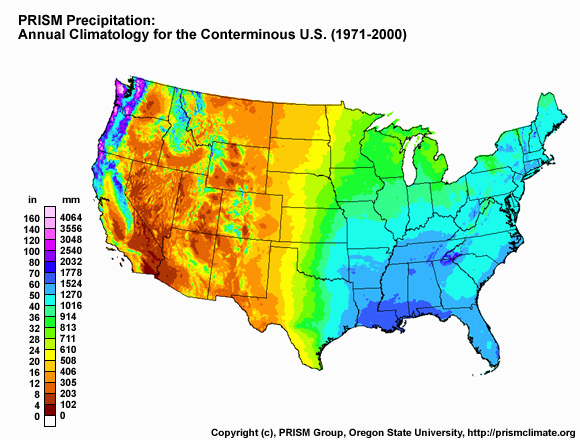
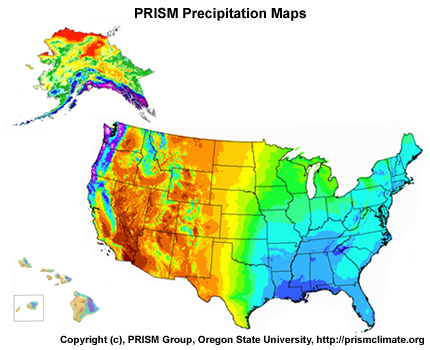
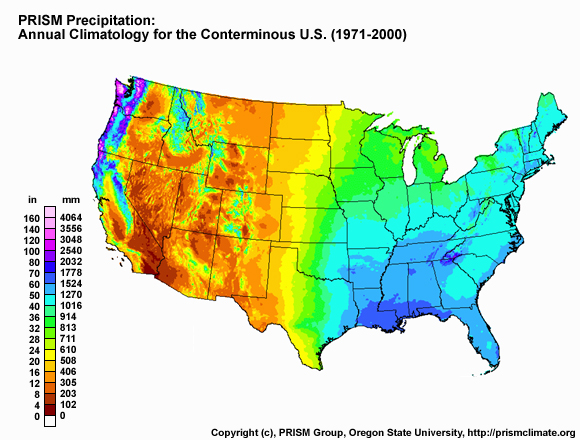
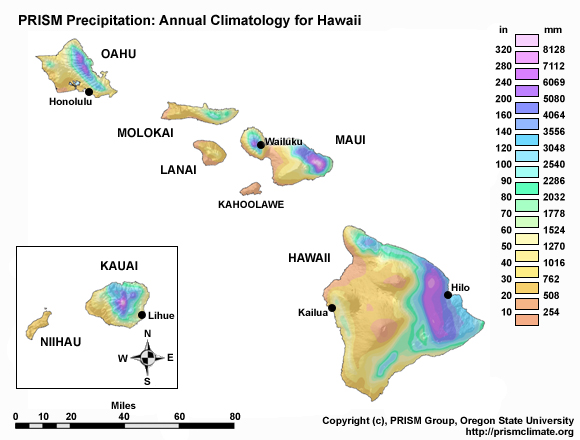
A weather climatology is sometimes used to augment weather-variable estimates. These climatologies are especially useful in regions with limited capacity for measurements or rapidly changing terrain features, the latter causing weather-variable dependence on this topographic variability (e.g.,sharp changes in elevation and/or nearby large bodies of water) as well as potentially limiting the ability for direct observation (such as in cases of radar-beam blockage as discussed in the previous section). Some of the more commonly used climatologies (which can include a variety of weather variables, and may have daily weather estimates for some products) are the Parameter-elevation Regressions on an Independent Slopes Model, or PRISM from Oregon State (for more information on precipitation climatology guidance from PRISM see: http://www.prism.oregonstate.edu/); Daymet daily surface weather and climatological summaries from Oak Ridge National Laboratory (https://daymet.ornl.gov/); gridMET from the Climatology Lab of the University of California-Merced (https://www.climatologylab.org/gridmet.html); and the Livneh datasets from the University of Colorado (https://ciresgroups.colorado.edu/livneh/data).`
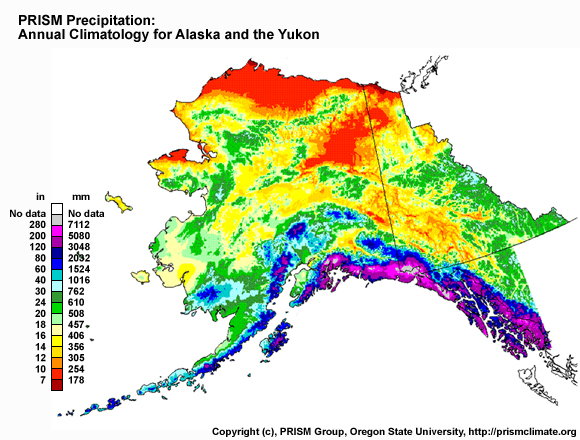
Figure: The Parameter-elevation Regressions on an Independent Slopes Model (PRISM) is a commonly-used precipitation climatology tool. For more information on precipitation climatology guidance from Parameter-elevation Regressions on an Independent Slopes Model (PRISM), see: http://www.prism.oregonstate.edu/.
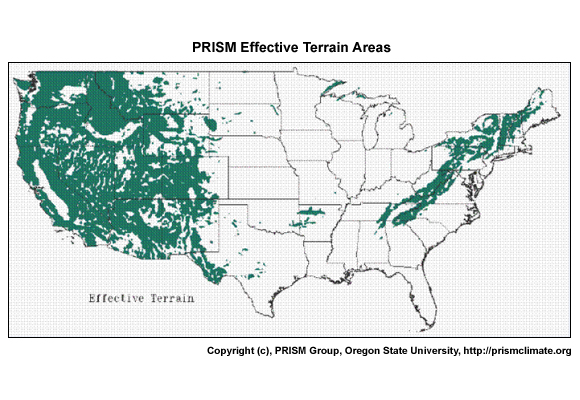
The approach used by PRISM using gauge and terrain data is considered the 3-dimensional (3-D) approach. This can be very useful in terrain-affected areas (see figures below). The areas that are within 100 km of the green shading on this map are where PRISM uses the 3-D approach for QPE. This would also include all of the Hawaiian Islands and most of Alaska. For the white areas on this map, PRISM uses a 2-D process. This is basically a distance-weighted gauge analysis.
Figure: Effective terrain grid for the U.S. Shaded areas denote terrain features that are expected to produce significant terrain-induced (3D) precipitation patterns. Unshaded grid cells as far as 100 km away from the shaded areas may also be considered 3D; see text for discussion. Grid resolution is 2.5 minutes (~ 4 km). (Source: https://prism.oregonstate.edu/documents/pubs/2002_influenceTerrain_daly.pdf)
Below we provide more information on the PRISM approach.
PRISM Precipitation Climatology/PRISM
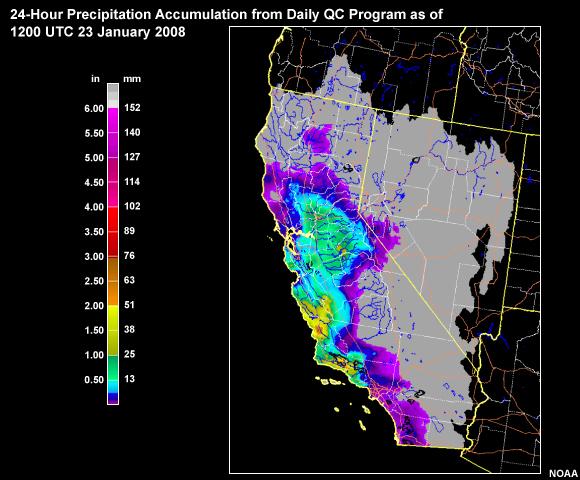
Precipitation climatology guidance can be used to help fill in the gaps where estimates of observed precipitation are poor. The most widely used precipitation climatology tool in the United States as of 2009 is the PRISM model. Prior to its use in multiple-sensor precipitation estimation (MPE), PRISM was used extensively in several River Forecast Centers in the Western United States.
Topics in this section include the rationale for PRISM, the use of PRISM data, and limitations of using precipitation climatology for QPE.
Precipitation Climatology/PRISM » PRISM
Developed at Oregon State University, PRISM climatology products include precipitation climatology guidance for the contiguous United States…
…the Hawaiian Islands, Puerto Rico, Guam, and…
…Alaska, along with portions of neighboring Canadian provinces.
Products and detailed presentations about deriving those products are available for download from the PRISM group at Oregon State University: http://www.prism.oregonstate.edu/.
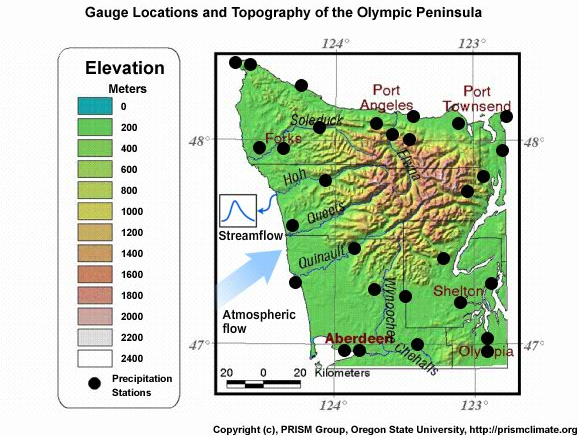
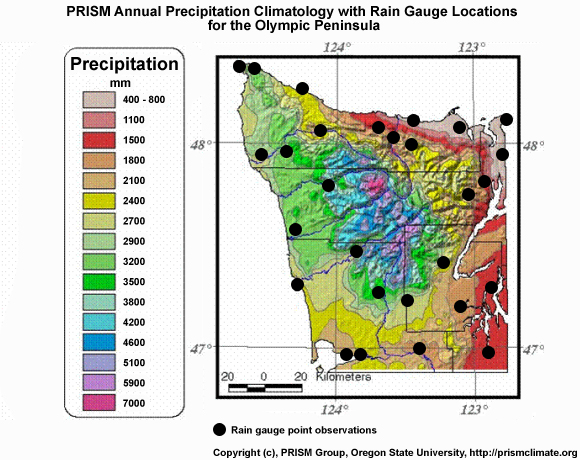
PRISM precipitation climatologies are based on the historic record of measured precipitation at point locations, geographic input, especially terrain information, and in some cases, the prevailing wind direction. Streamflow discharge measurements are used to correlate basin precipitation climatology with runoff climatology and thus provide a rough validation check on the precipitation amount.
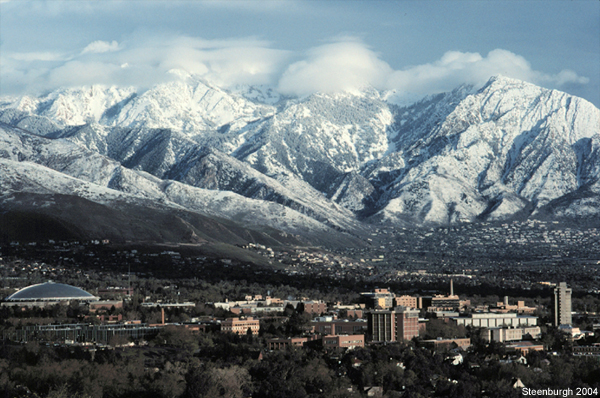
Point observations are rarely sufficient to represent spatial patterns of precipitation. This is especially true in regions with sharp changes in elevation and/or nearby large bodies of water. PRISM uses the known relationships of precipitation with geographic features. An automated statistical approach is used for efficiency, but this is guided by human expertise.
Precipitation Climatology/PRISM » Basic Use of PRISM
PRISM precipitation climatology may be used for both observed precipitation (QPE) and forecast precipitation (QPF).
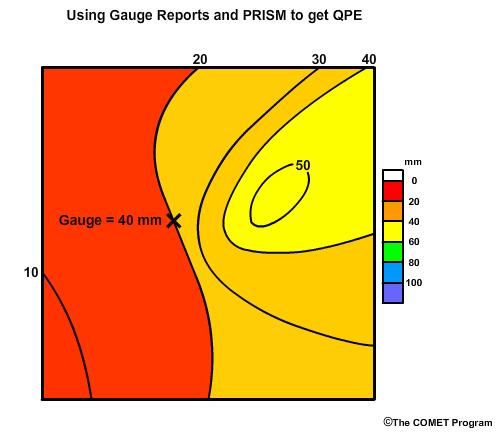
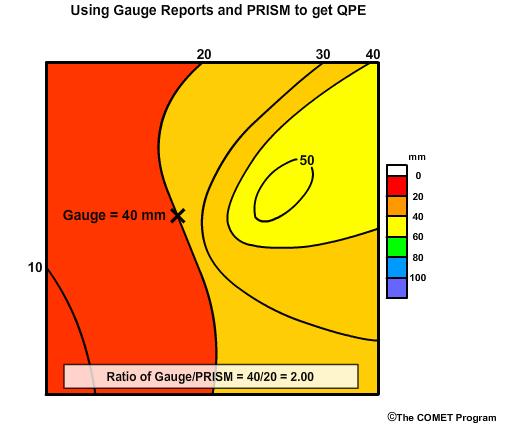
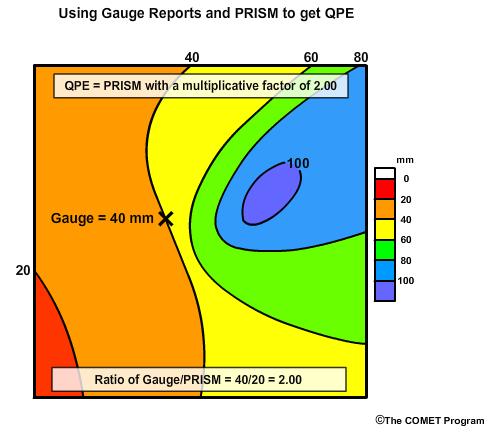
Deriving QPE from PRISM precipitation climatology starts with point values, such as reading from a rain gauge. From there we derive the ratio of the point value to the PRISM value.
In this example we assume the gauge reading is 40 mm (1.57 in) and the PRISM value at that point is 20 mm (0.79 in). The ratio of 40 over 20 is 2.0. Now, we apply that ratio to other PRISM values.
This adjusts the areal precipitation estimate by the ratio of 2.0 but it preserves the gradients and the relative magnitudes that we see in the PRISM data.
Of course this process is done for numerous gauge locations using distance-weighting schemes.
This approach using gauge and terrain data is considered the 3-dimensional (3-D) approach. This can be very useful in terrain-affected areas. The areas that are within 100 km of the green shading on this map are where PRISM uses the 3-D approach for QPE. This would also include all of the Hawaiian Islands and most of Alaska. In the white areas on this map, PRISM uses a 2-D process. This is basically a distance-weighted gauge analysis.
Precipitation Climatology/PRISM » Limitations of Precipitation Climatology
As with any climatological data, there are limitations. Climatology averages the individual events in a dataset. Individual precipitation events may show large departures from climatology, especially in the locations of extreme and sharp gradients. However, even with these limitations, there are regions that will likely benefit somewhat from climatological tools.
Individual events will often be closer to climatology in regions with large orographic influences.
In addition, regions that tend to receive widespread, stratiform precipitation will be closer to climatology than areas dominated by convection.
So the western coasts of North America may be the areas that can benefit most from climatological adjustments to QPE. Keep in mind that departures from climatological norms will likely have greater impacts as one looks at smaller basins.
3.2.4 Reanalysis
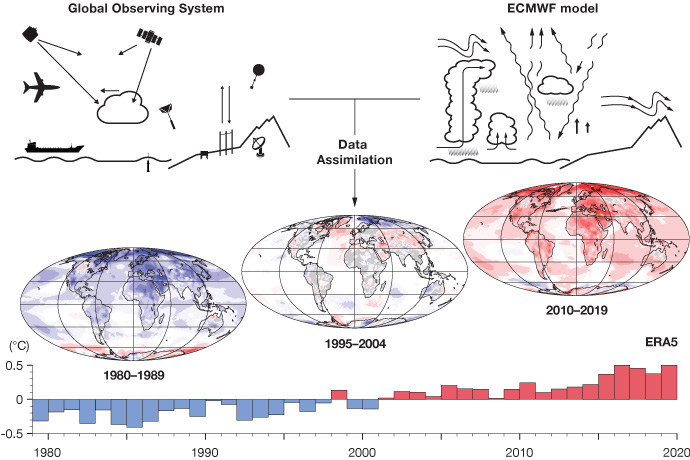
Climate reanalysis is a method used to reconstruct past climate conditions by combining historical observational data with modern climate models. This approach provides a comprehensive and consistent dataset of atmospheric, oceanic, and land-surface conditions over an extended period. The historical observational data can come from weather stations, satellites, ships, buoys, and other sources, and typically undergo rigorous quality control to correct errors and inconsistencies. The climate models used are often numerical weather prediction (NWP) models, sophisticated models that simulate the Earth’s atmosphere, oceans, and land surface based on physical laws. The integration of the observational data into the NWP models is done through a process called data assimilation. For a given period of interest and for a given (grid-) location, data assimilation systems use different mathematical methods (e.g.,4D-Var, Ensemble Kalman Filter, etc.) to combine often unevenly spatially-distributed observations with errors in a prescribed time-window of interest with a NWP-derived estimate constrained by previous observations on a regularly spaced grid to obtain what is called an optimal estimate of the state of the Earth system (i.e. estimates of atmospheric parameters such as air temperature, pressure and wind at different altitudes, and surface parameters such as rainfall, soil moisture content, ocean-wave height and sea-surface temperature, produced for all locations on earth) at the time of interest, and its time evolution constrained by physical laws. This combinatorial process is typically done by adjusting the NWP estimate in a physically consistent manner so that it matches the latest observations closely, while taking into account the relative uncertainties in the observations and the NWP estimates (somewhat mimicking the production of day-to-day weather forecasts, which use an analysis of the current state of the Earth system as their starting point).
Figure: A schematic of the reanalysis process. (Source: ECMWF)
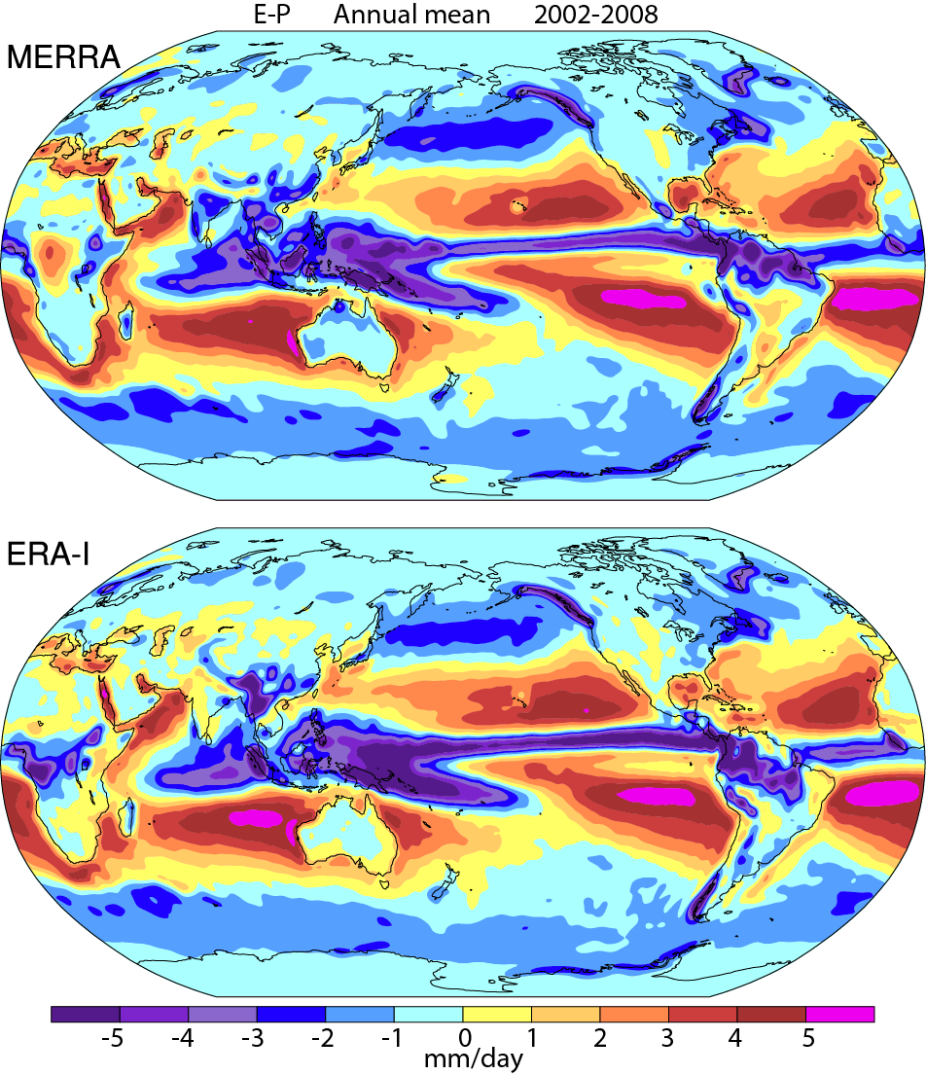
Although reanalyses have proven to be quite useful in general, they have their limitations. Even though the reanalysis framework is consistently applied over long time frames that can extend back several decades or more, the one component that does vary are the sources and amount of the raw input data due to changing global observational networks. Due to this changing mix of observations, the reliability of the reanalysis can vary considerably depending on the location, time frame, and variable considered; and this changing mix, along with biases in observations and models, can also introduce spurious variability and trends into the output. Of particular importance to this primer, variables relating to the hydrological cycle such as precipitation (P) and evaporation (E) are derived quantities that are calculated from the primary variables (or differences in the primary variables) of the NWP model, and therefore not directly predicted by the model’s governing equations, making them especially sensitive to inaccuracies in the numerical modeling process. As such, reanalysis-derived hydrologic cycle variables need to be used with caution and and assessed for their physical reasonableness. Consider the figure below (from Trenberth et al. 2011), which compares two reanalysis products (NASA MERRA and ECMWF ERA-Interim) and shows how E-P is of different sign between the two products over central Africa (but noting this is an analysis from over a decade ago)! However, we note that just as reanalysis products continue to improve in accuracy and their ability to remove formerly known deficiencies, some products (e.g.,ERA5) also are providing information about uncertainty: data from areas or periods where observations are sparser are likely to be less certain.
Figure: Evaporation minus Precipitation in MERRA (top) and ERA-Interim (bottom) based on Trenberth et al. (2011). (Contributed by J Fasullo and NCAR Climate Data Guide)
Further renalysis resources
NCAR Climate Data Guide: https://climatedataguide.ucar.edu/climate-data/atmospheric-reanalysis-overview-comparison-tables
ECMWF reanalysis description: https://www.ecmwf.int/en/research/climate-reanalysis
ECMWF Reanalysis fact sheet: https://www.ecmwf.int/en/about/media-centre/focus/2023/fact-sheet-reanalysis
3.2.5 Blending multiple sensors and data products
Multiple sensors and data products are often employed, especially in the case of producing time-series of data, to compensate for deficiencies in each product alone. As an example, over-CONUS radar and rain-gauge networks have been the primary tools for precipitation analyses, but advances in satellite tools for precipitation analysis are showing great promise in areas with poor coverage from radar and rain-gauge networks, especially over Alaska. Particularly promising are tools that merge data from different satellites.
One particular example of a blended time-series data product that employs multiple sensors is the NOAA Analysis Of Record for Calibration (AORC), a gridded record of near-surface weather conditions covering the continental United States and Alaska and their hydrologically contributing areas. Derived weather variables include hourly total precipitation, temperature, specific humidity, terrain-level pressure, downward longwave and shortwave radiation, and west-east and south-north wind components, with this suite of eight variables sufficient to drive most land-surface and hydrologic models and is used as input to the National Water Model (NWM) retrospective simulation. As an example of this blending process, consider that the AORC was assembled from over a dozen individual time-series and climatological datasets, not all of which were available through the entire period-of-record. The best available input dataset for each of the constituent elements was used at any given time and place. Some alternative time-series data (such as satellite data) were used to replace the input forcings at particular areas or used to temporally disaggregate higher-temporal resolution data. The climatological datasets were used to bias correct the time-series data (such as PRISM [Vose et al., 2014] and Livneh [Livneh et al., 2015] data), and were all developed based on ground-based gauge observations.
Further AORC details: see Analysis of Record for Calibration: Version 1.1, Sources, Methods, and Verification, National Weather Service, Office of Water Prediction, Oct. 2021.
3.2.6 Broader climate variable observation resources
There continues to be a broad range of remotely sensed hydrologically-relevant data sources that continue to be made publically available and can help offset and supplement some of the datasets mentioned above (e.g.,GPM and SWOT), especially for regions with limited observed coverage, and the reader is encouraged to continue to monitor the availability of additional resources that could help with their hydrometeorological data needs. Examples:
Global Precipitation Measurement: https://gpm.nasa.gov/missions/GPM
Surface Water and Ocean Topography Mission: https://swot.jpl.nasa.gov/
3.2.7 Further Resources
For further resources and guidance on observational datasets, please see:
the NSF NCAR Climate Data Guide: https://climatedataguide.ucar.edu/
IPCC AR6 WG1 Annex I Observational Products (filtered table of North American and water cycle focused provided below) https://www.ipcc.ch/report/ar6/wg1/
Data sources that were developed or referenced by the NOAA Technical Support Unit supporting the U.S. Fifth National Climate Assessment can be found here:
NCA5 Atlas https://atlas.globalchange.gov/
Global Change Information System https://data.globalchange.gov/
NOAA’s nClimGrid monthly https://www.ncei.noaa.gov/access/metadata/landing-page/bin/iso?id=gov.noaa.ncdc:C00332
NOAA’s nClimGrid daily https://www.ncei.noaa.gov/products/land-based-station/nclimgrid-daily
NOAA’s nClimDiv climate indices https://www.ncei.noaa.gov/access/metadata/landing-page/bin/iso?id=gov.noaa.ncdc:C00005
Below we provide a list of IPCC AR6-referenced climate variable observational products applicable to the U.S. and North America. The table lists observational datasets commonly used for climate studies that are considered well vetted by the scientific community. The table documents the details of the types and versions of datasets, the time frame they cover, and citations and (where available) web links to the data. Reanalysis data products are included. Datasets are sorted alphabetically according to the dataset name or, if there is no formal name, the name of the responsible institution or lead author.
Table of Observational datasets
Name |
Version |
Type |
Spatial Resolution |
Temporal Resolution |
TimePeriod |
Link |
Citation and DOI (Where Available) |
|---|---|---|---|---|---|---|---|
NOAA-CIRES 20th Century Reanalysis (20CR) |
2c |
Reanalysis |
2deg x2deg, 24 vertical levels |
3-hourly |
1851-2014 |
www.esrl.noaa.gov/psd/data/20thC_Rean/ |
Compo etal. (2011) |
NOAA-CIRES 20th Century Reanalysis (20CR) |
3 |
Reanalysis |
0.5deg x0.5deg |
3-hourly |
1851-2020 |
www.esrl.noaa.gov/psd/data/20thC_Rean/ |
Slivinski etal. (2019) |
AERONET AOD Level 2.0 |
3 |
Remote Sensing |
Point-based |
Monthly |
1995-2020 |
https://aeronet.gsfc.nasa.gov/data_push/AOT_Level2_ Monthly.tar.gz |
Giles etal. (2019) |
AIRS specific humidity |
RetStd-v5 |
Remote Sensing |
1deg x1deg |
Monthly |
2003-2010 |
Susskind etal. (2006); Tian etal. (2013) |
|
AIRS-6 climate data products |
Remote Sensing |
Various |
2002-2020 |
Susskind etal. (2014) |
|||
AMOC dataset |
In situ,reanalysis |
Regional |
Monthly |
2004-2017 |
Smeed etal. (2018) |
||
Advanced Microwave, Scanning Radiometer 2(AMSR2) |
Remote Sensing |
3-hourly |
2012-2019 |
https://lance.nsstc.nasa.gov/amsr2-science/data/level2/ rainocean/ |
Kummerow etal. (2015) |
||
Aquas Advanced Microwave Scanning Radiometer for Earth Observing System (AMSR-E) |
Remote Sensing |
5.4-56km |
2002-2011 |
Kawanishi etal. (2003) |
|||
Advanced Scatterometer (ASCAT) |
Remote Sensing |
25km |
Daily |
2006-2016 |
Wagner etal. (1999) |
||
Cross-calibrated multi-platform wind dataset (Atlas) |
Remote Sensing, in situ |
25km |
6-hourly |
1987-2020 |
www.remss.com/measurements/ccmp/ |
Atlas etal. (2011) |
|
Berkeley Earth surface air temperature |
In situ |
1deg x1deg(or equivalent equal-area grid) |
Monthly |
1750-2020 |
www.berkeleyearth.org |
Rohde and Hausfather (2020) |
|
Boulder stratospheric water vapour |
In situ |
Point-based |
Profiles approx.monthly |
1980-2010 |
Hurst etal. (2011) |
||
NCEP Climate Forecast System Reanalysis (CFSR) |
Reanalysis |
T382, approx. 38 km |
Hourly |
1979-2010 |
Saha etal. (2010) |
||
Climate Hazards Group InfraRed Precipitation with Station data (CHIRPS) |
2 |
Remote Sensing |
0.25deg x0.25deg |
Daily, monthly |
1981-2018 |
www.chc.ucsb.edu/data/chirps |
Funk etal. (2015) |
CPC Merged Analysis ofPrecipitation (CMAP) |
Remote Sensing |
2.5deg x2.5deg |
Monthly |
1979-2020 |
www.esrl.noaa.gov/psd/data/gridded/data.cmap.html |
Xie etal. (2007a) |
|
Climate Prediction Center (CPC) Nino indices |
In situ |
Regional |
Monthly |
1950-2020 |
www.cpc.ncep.noaa.gov/data/indices/ |
Derived from ERSSTv5 |
|
Climate Prediction Centre (CPC) Precipitation |
In situ |
2.0deg x 2.5deg (hourly); 0.25deg x 0.25deg (Daily) |
Hourly; Daily |
1948-2006 |
Higgins etal. (2000); Xie etal. (2007b); Chen etal. (2008) |
||
CPC teleconnection indices (AAO, AO, NAO, PNA) |
In situ |
Regional |
Daily |
1950-2020; (1979-2019 for AAO) |
www.cpc.ncep.noaa.gov/products/precip/CWlink/daily_ ao_index/teleconnections.shtml |
www.cpc.ncep.noaa.gov/products/precip/CWlink/daily_ ao_index/teleconnections.shtml |
|
CPC Unified GaugeBased Analysis of GlobalDaily Precipitation |
RemoteSensing |
0.5deg x0.5deg |
Daily |
1979-2019 |
https://psl.noaa.gov/data/gridded/data.cpc.globalprecip.html |
Xie etal. (2010) |
|
CloudSat CloudProfilingRadar (CPR) |
RemoteSensing |
1.5km horizontal,0.5km vertical |
2006-2019 |
Tanelli etal. (2008) |
|||
CRU TS |
4.04 |
In situ |
0.5deg x0.5deg |
Monthly |
1901-2020 |
Harris etal. (2020) |
|
CRUTEM |
5 |
In situ |
5deg x5deg |
Monthly |
1850-2020 |
Osborn etal. (2021) |
|
Mexican climate(Cuervo-Robayo) |
In situ |
30 arcsec |
Monthly |
1910-2009 |
Cuervo-Robayo etal. (2014) |
||
3D-VAR regionalreanalysis(Dahlgren) |
Reanalysis |
0.2deg x0.2deg |
6-hourly |
1989-2010 |
Dahlgren etal. (2016) |
||
ERA-5 |
Reanalysis |
30km, 137 vertical levels |
Hourly |
1979-2020 |
www.ecmwf.int/en/forecasts/datasets/reanalysis datasets/era5 |
Hersbach etal. (2020) |
|
GHCN precipitation |
2 |
In situ |
5deg x5deg |
Monthly |
1900-2014 |
www.esrl.noaa.gov/psd/data/gridded/data.ghcngridded.html |
Jones and Moberg (2003) |
Global Historical Climatology Network (GHCN)- Monthly |
4 |
In situ |
Point-based |
Monthly |
1880-2020 |
www.ncdc.noaa.gov/ghcnm/ |
Menne etal. (2018) |
GISTEMP |
4 |
In situ |
2deg x2deg |
Monthly |
1880-2020 |
Lenssen etal. (2019) |
|
GLDAS |
Reanalysis |
1deg x1deg |
Monthly |
1951-2010 |
https://hydro1.gesdisc.eosdis.nasa.gov/data/GLDAS/ GLDAS_NOAH10_M.2.0/ |
Rodell etal. (2004) |
|
Global Precipitation Climatology Centre (GPCC) |
8 |
In situ |
0.25deg x0.25deg |
Monthly |
1981-2020 |
ftp://ftp.dwd.de/pub/data/gpcc/html/fulldata-monthly_ v2018_doi_download.html |
Becker etal. (2013); Schneider etal. (2017) |
Global Precipitation Climatology Project (GPCP) |
2.3 |
RemoteSensing, in situ |
2.5deg x2.5deg |
Monthly |
1979-2020 |
www.esrl.noaa.gov/psd/data/gridded/data.gpcp.html |
Adler etal. (2018) |
Gravity Recovery andClimate Experiment (GRACE) |
Remote Sensing |
400 m |
3 days |
2002-2017 |
Tapley etal. (2004); Wouters etal. (2019) |
||
GRID-Sat |
Remote Sensing |
4km |
15-minute |
1994-2016 |
Inamdar and Knapp (2015) |
||
Global StreamflowIndicesand MetadataArchive (GSIM) |
In situ |
Point-based |
Daily |
1806-2016 |
Do etal. (2018) |
||
GSMaP |
Remote Sensing |
0.1deg |
Hourly |
2007-2020 |
Kubota etal. (2020) |
||
GEWEX Water Vapour Assessment (G-VAP) |
Reanalysis,Remote Sensing |
2deg x2deg |
Monthly |
1988-2009 |
Schroder etal. (2018) |
||
Hawaii OceanTime-seriesData |
In situ |
Point-based |
1988-2018 |
Dore etal. (2009) |
|||
Boulder stratosphericwatervapor (Hegglin) |
In situ |
1980-2010 |
Hegglin etal. (2014) |
||||
Integrated GlobalRadiosonde Archive (IGRA) |
In situ |
Point-based |
1900-2019 |
https://data.noaa.gov/dataset/dataset/integrated-global radiosonde-archive-igra-version-2 |
Durre etal. (2006) |
||
IPRC subsurface, temperaturedata |
In situ |
1deg x1deg |
Monthly |
2005-2020 |
http://apdrc.soest.hawaii.edu/projects/Argo/data/gridded/ On_standard_levels/index-1.html |
http://apdrc.soest.hawaii.edu/projects/Argo/data/gridded/ On_standard_levels/index-1.html |
|
Landsat Global Land Survey(GLS) database |
Remote Sensing |
Global images |
Daily |
1972-2019 |
Gutman etal. (2013) |
||
Combined satellite andstation data (Maidment) |
Remote Sensing, in situ |
0.0375deg x0.0375deg |
10-day |
1983-2012 |
Maidment etal. (2014) |
||
Marshall SAM index |
In situ |
Regional means |
Monthly |
1957-2020 |
www.nerc-bas.ac.uk/icd/gjma/sam.html |
Marshall (2003) |
|
Princeton MEaSUREs |
Reanalysis, remote sensing, in situ |
0.5deg x0.5deg |
Monthly |
1950-2019 |
Pan etal. (2012) |
||
Multivariate ENSO Index(MEI) |
In situ |
Monthly |
1977-2017 |
www.esrl.noaa.gov/psd/enso/mei/ |
Wolter and Timlin (1998) |
||
MERRA-2 reanalysis |
2 |
Reanalysis |
0.5 x0.66deg,72 vertical levels |
Hourly |
1980-2020 |
Gelaro etal. (2017) |
|
MERRA-2 reanalysis- Land |
2 |
Reanalysis |
0.5deg x0.66deg,72 vertical levels |
6-hourly |
1980-2020 |
Reichle (2012) |
|
MODIS Aerosol Optical Depth 550nm |
MYD08_M3 |
Remote Sensing |
1deg x1deg |
Monthly |
2003-2011 |
Platnick etal. (2003) |
|
MODIS NDVI/EVI vegetation greenness index |
6 |
Remote Sensing |
1km |
16-day |
2000-2018 |
Myneni etal. (2015)doi:10.5067/MODIS/MCD15A2H.006 |
|
Moderate Resolution Imaging Spectro-radiometer (MODIS) |
MCD12Q1 |
Remote Sensing |
500 m |
Annual |
2001-2019 |
Loveland and Belward (1997) |
|
Northern Hemisphere Blended Snow Cover Extent and Snow Mass Time Series (Mudryk) |
RemoteSensing, in situ |
Monthly |
1980-2018 |
http://data.ec.gc.ca/data/climate/scientificknowledge/ climate-research-publication-based-data/northern hemisphere-blended-snow-extent-and-snow-mass time-series/ |
Mudryk etal. (2020) |
||
NCEP-NCAR Reanalysis |
Reanalysis |
2.5deg x2.5deg |
Daily and monthly |
1980-2020 |
www.esrl.noaa.gov/psd/data/gridded/data.ncep. reanalysis.html |
Kalnay etal. (1996) |
|
NOAA Global Temp |
5 |
In situ |
5deg x5deg |
Monthly |
1880-2020 |
www.ncdc.noaa.gov/data-access/marineocean-data/ noaa-global-surface-temperature-noaaglobaltemp |
Huang etal. (2020) |
NOAA Global Temp- Interim |
In situ |
5deg x5deg |
Monthly |
1850-2020 |
Vose etal. (2021) |
||
NOAA reconstructedsnowcover dataset |
Remote Sensing, in situ |
Hemispheric |
Monthly |
1915-1997 |
Brown (2002); Brown and Robinson (2011) |
||
NOAA STAR satellitetemperature |
3 |
Remote Sensing |
2.5deg x2.5deg,3 vertical layers |
Monthly |
1979-2020 |
www.star.nesdis.noaa.gov/smcd/emb/mscat/ |
Zou and Wang (2011) |
National Oceanography Centre (NOC) surface flux and meteorological dataset |
2 |
In situ |
1deg x1deg |
Monthly |
1973-2014 |
Berry and Kent (2011) |
|
NASA Water Vapor Project MEaSUREs (NVAP-M) |
Remote Sensing |
1deg |
Daily |
1988-2008 |
https://public.satproj.klima.dwd.de/data/GVAP_data_ archive/v1.0/TCWV/long/ |
Vonder Haar etal. (2012) |
|
USA temperature (Oyler) |
In situ |
30-arcsec |
Daily |
1948-2012 |
Oyler etal. (2015) |
||
PERSIANN-CDR |
Remote Sensing |
0.25deg x0.25deg |
Daily |
1982-2020 |
www.ncdc.noaa.gov/cdr/atmospheric/precipitation persiann-cdr |
Ashouri etal. (2015) |
|
Randolph Glacier Inventory |
6 |
Remote Sensing |
Decametric shapefiles of glacieroutlines, global 0.5deg global grid of glacierized area |
1955-2014 |
www.glims.org/RGI/rgi60_dl.html |
Scherler etal. (2018) |
|
REGEN global precipitation |
1 |
In situ |
1deg x1deg |
Daily |
1950-2016 |
https://researchdata.ands.org.au/rainfall-estimates gridded-v1-2019/1408744 |
Contractor etal. (2020)doi:10.25914/5ca4c380b0d44 |
MSG-based griddeddatasetsof clouds,precipitation and radiation (Roebeling andHolleman) |
Remote Sensing |
0.27deg x0.27deg |
Daily |
2005-2019 |
Roebeling and Holleman (2009) |
||
ROM SAF radio occultation climate data record |
Remote Sensing |
5deg latitude bins,200m vertical |
Monthly |
2001-2020 |
www.romsaf.org |
Gleisner etal. (2020) |
|
Arctic permafrost layertemperature (Romanovsky) |
In situ |
Site-based |
Annual |
1977-2020 |
Romanovsky etal. (2020) |
||
Remote Sensing Systems (RSS) precipitation andwater vapour |
7 |
Remote Sensing |
0.25deg x0.25deg |
2 per day |
1987-2020 |
www.remss.com/measurements/rain-rate/ |
Wentz (2013) |
Remote Sensing Systems RSSsatellite temperature |
4 |
Remote Sensing |
2.5deg x2.5deg,5 vertical layers |
Monthly |
1979-2020 |
www.remss.com/measurements/upper-air-temperature/ |
Mears and Wentz (2017) |
Rutgers University/NOAA snow cover extent dataset |
V01r01 |
Remote Sensing |
100-200km |
Weekly |
1966-2020 |
Estilow etal. (2015) |
|
Southern OscillationIndex(SOI) |
In situ |
Regional time series |
Monthly |
1876-2020 |
www.bom.gov.au/climate/current/soihtm1.shtml |
Troup (1965) |
|
State University of New York (SUNY) radiosonde dataset |
In situ |
10deg x10deg |
Monthly |
1958-2020 |
Zhou etal. (2021) |
||
TRMM PrecipitationRadar3A25 |
7 |
Remote Sensing |
0.5deg |
Monthly |
1997-2014 |
Iguchi etal. (2000) |
|
TRMM GPOF |
GPOF |
Remote Sensing |
0.25deg x0.25deg |
Daily |
1997-2015 |
Stocker etal. (2018) |
|
TRMM MicrowaveImager(TRMM TMI) |
TMI |
Remote Sensing |
0.25deg x0.25deg |
3 day |
1997-2015 |
Wentz etal. (2001) |
|
TRMM Multi-Satellite Precipitation Analysis |
7 |
Remote Sensing |
0.25deg x0.25deg |
3-hourly |
1997-2018 |
Huffman etal. (2007); TRMM (2011); Z. Liu etal. (2012) |
|
Tropical Rainfall Measuring Mission Precipitation Radar (TRMM PR) |
PR |
Remote Sensing |
0.5deg x0.5deg |
Monthly |
1997-2015 |
Haddad etal. (1997) |
|
University of AlabamaatHuntsville (UAH) satellite temperature |
6 |
Remote Sensing |
3 vertical layers |
Monthly |
1979-2020 |
www.nsstc.uah.edu/climate/ |
Spencer etal. (2017) |
UCAR/ NOAA radio occultation data |
Remote Sensing |
5deg latitude bands |
Monthly |
2002-2020 |
Steiner etal. (2020) |
||
Global temperaturedataset(Vaccaro) |
In situ |
5deg x5deg |
Monthly |
1850-2020 |
Vaccaro etal. (2021) |
||
W5E5 bias-adjustedreanalysis |
1 |
Reanalysis |
0.5deg x0.5deg |
Daily |
1979-2016 |
https://dataservices.gfz-potsdam.de/pik/showshort. php?id=escidoc:4855898 |
Lange (2019)doi:10.5880/pik.2019.023 |
Wegener Centre radiooccultation dataset |
Remote Sensing |
0.1km vertical |
Monthly |
2001-2020 |
Angerer etal. (2017) |
||
Global Earth Observation for Integrated Water Resource Assessment (Earth2Observe) Water ResourcesReanalysisv2 (WRR2) |
2 |
Reanalysis |
0.5deg x0.5deg |
Monthly |
1979-2012 |
Schellekens etal. (2017) |
