There are many other ways to visualize WRF data with VAPOR. Various visualization techniques are documented on the VAPOR website.
Some useful capabilities include:
- Display of particle traces (unsteady flow lines) can be shown with time-varying data.
- Isosurfaces of 3D variables can be interactively displayed, and can be colored according to other variables in the data.
- Many weather-based derived variables (e.g. radar reflectivity, cloud-top temperature) can be visualized in the VAPOR scene, using the VAPOR Python interface.
- The viewpoint can be animated over time so as to rotate around the scene or zoom into a feature of interest.
- 2D variables can be plotted as planar images or their values can be applied to the terrain.
- Contour lines of 2D or 3D variables can be plotted in the scene.
- NCL plots of derived variables can be inserted in the scene, as planar images, or can be applied to the terrain.
- Flow can be visualized in animated planar slices, using image-based flow visualization.
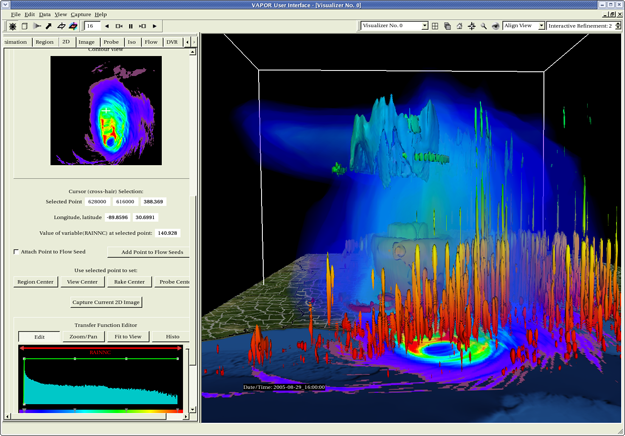
For example, the following illustrates an isosurface of QCLOUD, colored by values of T, with values of the accumulated nonconvective rain (RAINNC) applied to the terrain surface.

