To investigate the wind dynamics inside the hurricane, it is useful to look at a cross-section of the W variable (vertical wind velocity). The eyewall tends to be associated with positive values of W. The hurricane draws air inward near the ground, and lifts it at the eyewall. To see this we shall use the Probe tool.
Set the time step to 10.
Disable the flow (i.e un-check the Instance:1 checkbox in the flow panel). Leave the DVR running, it will help locate the hurricane eye.
Click the Probe icon (![]() Probe), a bold upward pointing arrow in the mode selector at the top left of the the window. This puts you in Probe mode, so that you can manipulate the probe in the scene. You will see a horizontally-oriented square in the middle of the scene, indicating the extents of the Probe.
Probe), a bold upward pointing arrow in the mode selector at the top left of the the window. This puts you in Probe mode, so that you can manipulate the probe in the scene. You will see a horizontally-oriented square in the middle of the scene, indicating the extents of the Probe.
You will need to click on the button "Show Probe Layout Options" to control the settings below.
In the probe layout options, click on the "90-degree rotate" pulldown menu, and select "+ X". Note that the probe becomes vertically oriented.
Click on the button "Fit to Region" in the layout options, so that the probe becomes a vertically oriented rectangle filling the full data domain.
Rotate the scene (dragging with the left mouse button) so that you can see the hurricane from above.
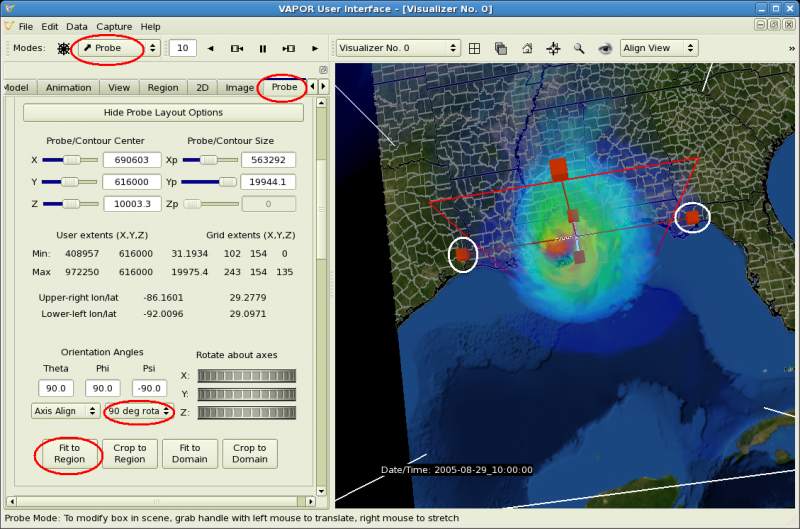
Drag with the right mouse on the East and West handles on the probe (circled in white in the image below), to shrink the probe to where it just crosses the full diameter of the hurricane.
Your VAPOR scene should appear about like the following. The GUI elements that were set above are marked with red ovals.
Disable the DVR (un-check the "Instance:1" checkbox in the DVR tab). We don't need the volume rendered image any more, and it interferes with our view of the Probe.
At the top of the Probe tab, check "Instance: 1" to enable the probe rendering. The image displayed will not be correct because we have not specified the W variable yet.
If you converted your data to a VDC (instead of importing the wrfout files directly), then, in the probe Basic Settings, below the Renderer Control, select Refinement 2. This is the highest (most accurate) level of detail, so that we will see an accurate cross section of the hurricane at full resolution. If you imported your data from wrfout files, the data is already at the highest resolution level (0).
To display the cross section of vertical wind speed, we must specify the variable. Select "W" in the Variable selector in the Basic Settings.
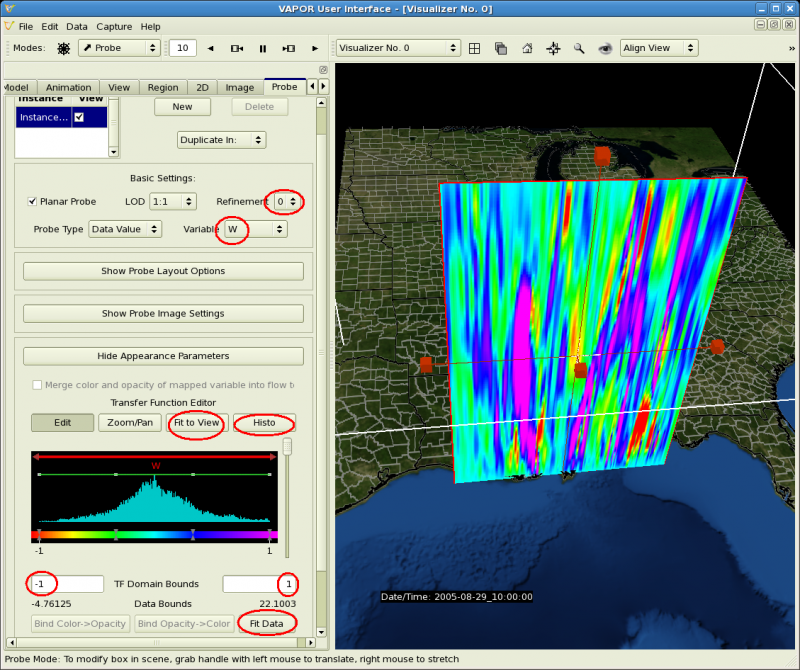
Scroll down to the probe Appearance Parameters, where you will see the Probe transfer function editor. Click the button "Fit data" (below the transfer function editor) , then click the buttons "Fit to View" and "Histo" above the transfer function editor. You will see that the values of W go from -4.76 to 22, and these are set to equal the current TF domain bounds.
Reset the TF domain bounds to be -1 and 1 (and press enter). Most of the data values are inside these bounds. Again click "Fit to View" and "Histo" to see the new histogram of W values in the Probe.
In the probe image, and in the probe in the scene, you will see there are vertical violet regions, identifying the (approximately) cone-shaped extents of the eye wall, as shown below: