Probe Overview:
The VAPOR Probe enables the user to place a 2D or 3D box at an arbitrary location and orientation in the 3D scene. The probe is designed to be an efficient means of querying and visualizing 3D variables at specific locations in the scene while providing a contour plane visualization of the variables. The following illustrates a typical application of the Probe:
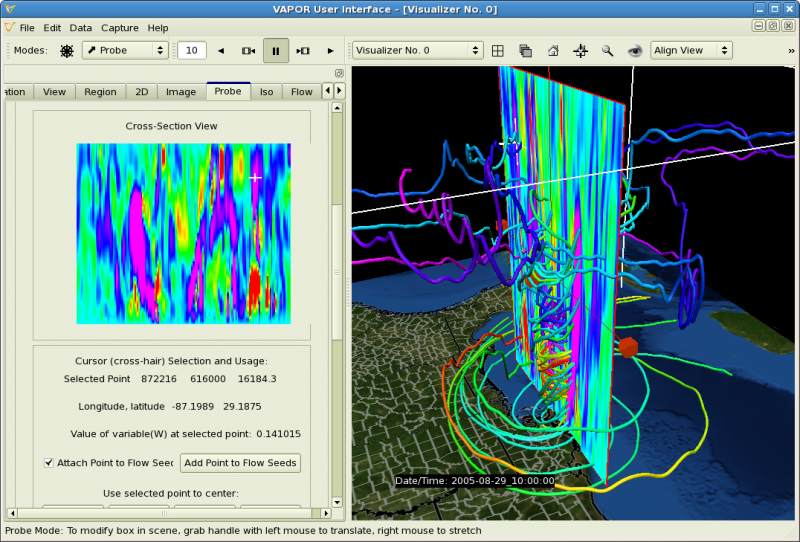
In the above screen shot, the Probe has been used to visualize a vertical section of the variable W, the vertical wind speed, of a WRF-ARW simulation of Hurricane Katrina. The probe color indicates upward (red) and downward (violet) wind velocity, thereby delineating the eyewall of the hurricane. By placing the cursor in the Probe, one is able to specify flow seed points. The resulting streamlines illustrate the motion of wind currents near the eyewall. The process of creating this image is described in the Hurricane Katrina Tutorial.
In Probe mouse mode, the probe can be manually positioned by translation or stretching. The contour image displays the value of the specified variable through the center plane of the Probe. When the probe is not axis-aligned, the size of the probe can be adjusted using sliders in the tab. When in Probe mouse mode, a cursor in the probe contour plane is also displayed as a 3D cursor in the 3D volume, enabling interactive identification of the location of features in the data.
There are two types of Probe, the Data Probe and the Flow Image probe. The Probe Type selector in the Basic Settings allows you to choose between these types. Refer to Probe Tab: Image Based Flow Visualization for a discussion of the flow image capability.
By default the probe is forced to be planar; however by unchecking the "Planar Probe" checkbox, the Probe can be expanded to a full 3D box. This useful for histogramming data values in 3D boxes.
The extents of the probe are shown in user coordinates, grid coordinates and (when the data is georeferenced) in lat/lon coordinates. There are two sets of sliders in the Probe panel. The sliders on the left indicate the (X,Y,Z) center coordinates of the probe (in user coordinates). The sliders on the right determine the size of the probe and are identified as (Xp, Yp, Zp). These indicate the size of the probe in the probe's coordinate system, which may be rotated from the user coordinates, when the orientation angles are nonzero. The probe rotation is described more fully under Orientation of the Probe.
If the probe is planar (the default) then the Zp size of the probe is 0.
The extents of the probe can be restricted to fit inside the current region or in the current data domain. See "Crop or Fit Probe to Region" for an explanation of this. When in Probe Mouse Mode, the extents of the Probe are displayed in the 3D scene, and the Probe position can be controlled by dragging with the (left or right) mouse button in the scene.
When the Probe is enabled, the 2D slice (through the center of the probe) is displayed in the Probe Tab, as well as in the 3D scene. By clicking the left mouse button in the Probe image, the coordinates of the selected point and the value of the Probe variable at the selected point are displayed. In Probe Mode, this coordinate is also displayed as a 3D cursor in the 3D scene. If the scene is geo-referenced, latitude and longitude of the cursor are displayed.
The probe cursor can be used to manually specify flow seed points, positioning flow seeds at the position specified by the cursor.
The selected position of the cursor can also be used to set the center point of the current region or rake extents, or to reposition the center of the current probe. This point can also be used to set the center of rotation in the view, so as to point the current view at the probe cursor position in the scene.
The probe is displayed as a plane, colored by a mapping of the probe variable to color and opacity. With a flow image, the probe appears as a planar slice of the flow, optionally colored by the color and opacity mapped variable.
The color and opacity of the Probe are specified with a transfer function editor that determines how the Probe variable is mapped to color and opacity, determining a contour plane image. The "Discrete color map" checkbox is useful in making iso-lines in the probe visible as the boundaries between the various colors.
With a Flow Image Probe (i.e. using Image-based flow visualization in the Probe), the color and transparency can be applied to the (black/white) flow image by checking "Merge mapped variable into flow texture".