Access CESM2 LENS data from NCAR’s Geoscience Data Exchange (GDEX) and compute GMST
Table of Contents
Section 1: Introduction
Python package imports and useful function definitions
# Display output of plots directly in Notebook
%matplotlib inline
import intake
import numpy as np
import xarray as xr
import nc_time_axis
import os
import dask
from dask_jobqueue import PBSCluster
from dask.distributed import Client
from dask.distributed import performance_report# Set up your sratch folder path
username = os.environ["USER"]
glade_scratch = "/glade/derecho/scratch/" + username
print(glade_scratch)
#
catalog_url = 'https://osdata.gdex.ucar.edu/d010092/catalogs/d010092-osdf.json'
# catalog_url = 'https://osdata.gdex.ucar.edu/d010092/catalogs/d010092-https.json' #NCAR's Object store /glade/derecho/scratch/harshah
# GMST function ###
# calculate global means
def get_lat_name(ds):
    for lat_name in ['lat', 'latitude']:
        if lat_name in ds.coords:
            return lat_name
    raise RuntimeError("Couldn't find a latitude coordinate")

def global_mean(ds):
    lat = ds[get_lat_name(ds)]
    weight = np.cos(np.deg2rad(lat))
    weight /= weight.mean()
    other_dims = set(ds.dims) - {'time','member_id'}
    return (ds * weight).mean(other_dims)
Section 2: Select Dask Cluster
Setting up a dask cluster. You will need to choose the type of cluster based on your use case.
The default will be LocalCluster as that can run on any system.
If running on NCAR’s HPC i.e, Casper with a PBS Scheduler, set USE_PBS_SCHEDULER to True. Otherwise, set to False.
USE_PBS_SCHEDULER = TrueIf running on Jupyter server with Dask Gateway configured, set to True. Otherwise, set to False.
USE_DASK_GATEWAY = FalsePython function for a PBS cluster
# Create a PBS cluster object
def get_pbs_cluster():
    """ Create cluster through dask_jobqueue.
    """
    from dask_jobqueue import PBSCluster
    cluster = PBSCluster(
        job_name = 'dask-osdf-25',
        cores = 1,
        memory = '4GiB',
        processes = 1,
        local_directory = glade_scratch + '/dask/spill',
        log_directory = glade_scratch + '/dask/logs/',
        resource_spec = 'select=1:ncpus=1:mem=4GB',
        queue = 'casper',
        walltime = '3:00:00',
        #interface = 'ib0'
        interface = 'ext'
    )
    return cluster
Python function for a Gateway Cluster
def get_gateway_cluster():
    """ Create cluster through dask_gateway
    """
    from dask_gateway import Gateway

    gateway = Gateway()
    cluster = gateway.new_cluster()
    cluster.adapt(minimum=2, maximum=4)
    return cluster
Python function for a Local Cluster
def get_local_cluster():
    """ Create cluster using the Jupyter server's resources
    """
    from distributed import LocalCluster, performance_report
    cluster = LocalCluster()

    return cluster
Python logic to select the Dask Cluster type
This uses True/False boolean logic based on the variables set in the previous cells
# Obtain dask cluster in one of three ways

if USE_PBS_SCHEDULER:
    cluster = get_pbs_cluster()
elif USE_DASK_GATEWAY:
    cluster = get_gateway_cluster()
else:
    cluster = get_local_cluster()

# Connect to cluster
from distributed import Client
client = Client(cluster)
/glade/u/home/harshah/.conda/envs/osdf/lib/python3.11/site-packages/distributed/node.py:188: UserWarning: Port 8787 is already in use.
Perhaps you already have a cluster running?
Hosting the HTTP server on port 34263 instead
warnings.warn(
cluster.scale(4)
client.wait_for_workers(4)
clusterSection 3: Data Loading
Load CESM2 LENS zarr data from GDEX using an intake-ESM catalog
For more details regarding the dataset. See, https://
gdex .ucar .edu /datasets /d010092 /#
# Open collection description file using intake
col   = intake.open_esm_datastore(catalog_url)
colcesm_temp = col.search(variable ='TREFHT', frequency ='monthly')
cesm_tempcesm_temp.df['path'].values<ArrowExtensionArray>
['osdf:///ncar-gdex/d010092/atm/monthly/cesm2LE-historical-cmip6-TREFHT.zarr',
'osdf:///ncar-gdex/d010092/atm/monthly/cesm2LE-historical-smbb-TREFHT.zarr',
'osdf:///ncar-gdex/d010092/atm/monthly/cesm2LE-ssp370-cmip6-TREFHT.zarr',
'osdf:///ncar-gdex/d010092/atm/monthly/cesm2LE-ssp370-smbb-TREFHT.zarr']
Length: 4, dtype: large_string[pyarrow]dsets_cesm = cesm_temp.to_dataset_dict(xarray_open_kwargs={'engine':'zarr','backend_kwargs':{'consolidated': True,'zarr_format': 2}})
--> The keys in the returned dictionary of datasets are constructed as follows:
	'component.experiment.frequency.forcing_variant'
dsets_cesm.keys()dict_keys(['atm.ssp370.monthly.cmip6', 'atm.ssp370.monthly.smbb', 'atm.historical.monthly.smbb', 'atm.historical.monthly.cmip6'])historical_cmip6 = dsets_cesm['atm.historical.monthly.cmip6']
future_cmip6 = dsets_cesm['atm.ssp370.monthly.cmip6']future_cmip6 Make a quick plot to check data transfer
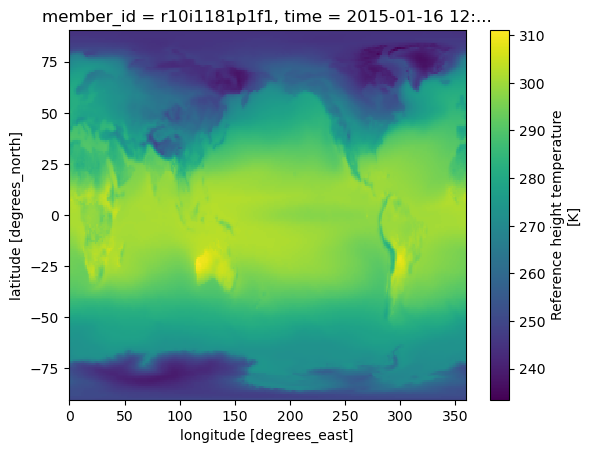
%%time
future_cmip6.TREFHT.isel(member_id=0,time=0).plot()
CPU times: user 98.5 ms, sys: 18.1 ms, total: 117 ms
Wall time: 615 ms
Section 4: Data Analysis
Perform the Global Mean Surface Temperature computation
Merge datasets and compute Global Mean surrface temperature anomaly
Warning! This section takes about a min to run!
Config: 3 dask workers with 8GiB memory.
merge_ds_cmip6 = xr.concat([historical_cmip6, future_cmip6], dim='time')
# merge_ds_cmip6 = merge_ds_cmip6.dropna(dim='member_id')
merge_ds_cmip6 = merge_ds_cmip6.TREFHT
merge_ds_cmip6Compute (spatially weighted) Global Mean
ds_cmip6_annual = merge_ds_cmip6.resample(time='YS').mean()
ds_cmip6_annual%%time
gmst_cmip6 = global_mean(ds_cmip6_annual)
gmst_cmip6 = gmst_cmip6.rename('gmst')
gmst_cmip6CPU times: user 6.52 ms, sys: 263 μs, total: 6.79 ms
Wall time: 6.64 ms
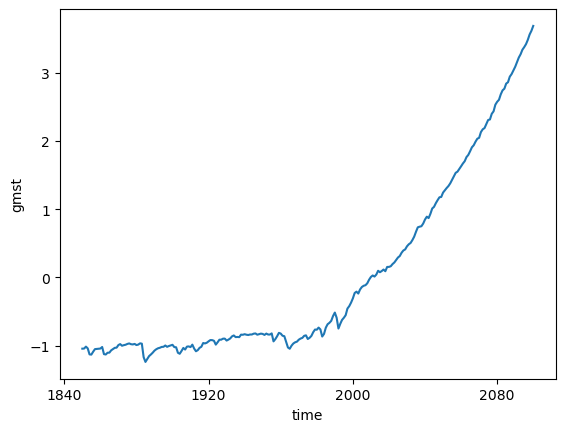
Compute anomaly and plot
gmst_cmip6_ano = gmst_cmip6 - gmst_cmip6.mean()
gmst_cmip6_anogmst_cmip6_ano = gmst_cmip6_ano.compute()%%time
gmst_cmip6_ano.mean(dim='member_id').plot()CPU times: user 7.62 ms, sys: 3.78 ms, total: 11.4 ms
Wall time: 10.9 ms
cluster.close()